Global Market Outlook - Standard Chartered
←
→
Page content transcription
If your browser does not render page correctly, please read the page content below

WM Chief Investment Office
30 April 2021
Global Market Outlook
Relentless
optimism?
Expectations for a global economic and
earnings recovery remain relentlessly
positive, despite an increasingly tightening
policy bias in China and the risk of higher
US taxes. We favour equities over bonds.
US equities remain most likely to outperform
other regions amid supportive policy, in our
view. Asia ex-Japan faces headwinds from
China’s tightening liquidity and a surge in
COVID-19 cases in India and other markets.
Asia and Emerging Market USD bonds
continue to offer value and Developed
Market High Yield bonds may still have
room to outperform. A further inflation rise is
likely to push bond yields, net-of-inflation,
lower – a positive for gold and negative for
the USD.
How should investors be Are technical charts Where are the
positioned for higher pointing to a further rise opportunities in the
inflation? in US equities and gold? electric vehicles sector?
Important disclosures can be found in the Disclosures Appendix.
Contents

     Strategy
01   Investment strategy: Relentless optimism?   03

     Our 12-month tactical asset allocation      05

     Perspectives on key client questions        06

     Electric vehicles come of age               08

     Macro Overview
02   Summary                                     10

     Asset Classes
03   Bonds                                       11

     Equity                                      12

     FX                                          13

     Technicals                                  14

     Tracking market diversity                   15

     Performance Review
04   Asset allocation summary                    16

     Market performance summary                  17

     2021 key events                             18

     Our key advisory publications               19

     Disclosures                                 20
Strategy | Macro Overview | Bonds | Equity | FX | Alternatives | Performance Review

2   Investment strategy and key themes
    Steve Brice                      Manpreet Gill
    Chief Investment Officer         Head, FICC Investment Strategy

                                        Relentless optimism?
        Implications
        for investors                   •   Expectations for a global economic and earnings recovery remain relentlessly
                                            positive, despite an increasingly tightening policy bias in China and the risk of
        •   Prefer global
                                            higher US taxes. We favour equities over bonds.
            equities over bonds
            and cash                    •   US equities remain most likely to outperform other regions amid supportive
        •   Equities: Prefer the            policy, in our view. Asia ex-Japan faces headwinds from China’s tightening
            US and the UK                   liquidity and a surge in COVID-19 cases in India and other markets.
        •   Bonds: Prefer Asia          •   Asia and Emerging Market USD bonds continue to offer value and DM High Yield
            USD, EM USD and                 bonds may still have room to outperform. A further inflation rise is likely to push
            DM HY                           bond yields, net-of-inflation, lower, a positive for gold and negative for the USD.
        •   The USD is likely to
            weaken against the          Markets remain relentlessly optimistic
            EUR, AUD, GBP               Markets maintained relentless optimism on economic and corporate earnings
            and CNY over the            forecasts. In the US, for example, S&P500 earnings growth forecasts for 2021 are
            next 12 months              now 32%, compared with just over 23% at the start of the year.
                                        However, this was balanced by four emerging risks: First, a relatively muted market
        Key themes                      reaction to some strong earnings raises questions about whether the positivity is
                                        priced in. Second, the possibility of higher US taxes entered the narrative. Third,
        •   Ready, Steady,
                                        China’s central bank signalled its tightening bias was set to extend. Fourth, the
            Rotate
                                        market’s expectations of US inflation continued to rise towards pre-pandemic highs.
        •   Race for Income
        •   USD to slump in             Equities vs corporate bonds
            2021                        The risk of ‘sell-in-May’ volatility notwithstanding, we believe risk/reward continues
        •   Golden equity               to favour global equities over bonds over a 12-month horizon. Earnings are
            themes for the              recovering, valuations (vs bond yields) are more attractive for global equities than
            2020s                       global corporate bonds and fiscal and monetary policies remain ultra-supportive.
        •   A time for climate          Within this, rising divergences – between the Fed and the PBoC on policy direction
            investing                   and between Developed Market (DM) and Emerging Market (EM) assets, for
        •   A world of yield-free       example, have been a part of the recent narrative. However, there may be a need
            risk                        to be agile if USD exceptionalism fades and the USD downtrend decisively resumes.

    3        Global Market Outlook
Strategy | Macro Overview | Bonds | Equity | FX | Alternatives | Performance Review

Fig. 1 Relative to bond yields, equity valuations                                      Fig. 2 Some regions vaccinating at a faster pace
less elevated than corporate bond valuations                                           than others, accelerating economic normalisation
Valuations vs US Treasury yields (since 2001):                                         COVID-19 vaccine doses administered, per hundred
Global equities and global corporate bonds
         100                                                                                                  70

                                                                                        doses (per hundred)
                                                                                         No. of vaccination
                                                                                                              60
              80
 Percentile

                                                                                                              50
              60                                                                                              40
                                                                                                              30
              40
                                                                                                              20
                                                  More
              20                                                                                              10
                                                expensive
                                                                                                               0
              0                                                                                                Dec-20     Feb-21          Apr-21
                              Global equities              Global corporate bonds
                       Earnings yield - Treasury yield Yield premium over Treasuries                             Brazil   Germany         India
                                                                                                                 UK       US              China
                               LT average                    Current
Source: FactSet, Bloomberg, Standard Chartered                                         Source: Our World in Data, Standard Chartered

Bottom-up challenges in Asian equities                                                 A focus on riskier bonds still attractive
Within global equities, our preference for the US and the                              Our preference for equities over bonds notwithstanding,
UK remains unchanged. While the prospect of higher                                     we believe riskier bonds (both corporate and EM) that
taxes is a risk for the US, most estimates of the impact                               are less sensitive to a renewed rise in US government
on earnings remain small (mid-single digits) and it                                    bond yields remain attractive, including for income
remains far from clear that the tax measures will pass                                 investors (see our ‘Race for Income’ theme).
in their current form. This means markets are likely to
                                                                                       Asia and EM USD bonds continue to offer attractive
continue focusing on strong earnings growth data and
                                                                                       value relative to both their own history and DM bonds.
the US/UK lead in per-capita COVID-19 vaccinations.
                                                                                       The yield gap between Asia and US HY bonds has
In China, though, a tightening policy bias is becoming                                 widened significantly in favour of Asia HY bonds,
increasingly evident in credit growth data. In India, the                              presenting an attractive opportunity to add exposure.
economic and earnings recovery is at risk of a delay                                   EM USD government bond valuations are also not far
amid a new, devastating COVID-19 surge. While we                                       from their long-term medians amid an increasingly
believe Asia ex-Japan should still do well on a 12-month                               attractive absolute yield.
horizon, in line with global equities, the chances of
                                                                                       The valuations picture looks less attractive for DM HY
outperforming global equities have fallen, in our opinion.
                                                                                       bonds following their strong rally over the past year.
The risk of a rebound in JPY, amid renewed USD                                         Historically, though, returns from these levels have still
weakness, may pose more of a challenge for Japanese                                    tended to be strong on 12-month horizons. This is not
equities. The Euro area continues to rank last in our                                  surprising as HY bond price behaviour tends to be
preference order, though here, we remain on watch for                                  asymmetric through a cycle – trending higher until a
any signs of potential upside surprises if the pace of                                 recession causes a disproportionate sell-off.
COVID-19 vaccinations begins to accelerate.
                                                                                       Rising inflation good for gold, bad for USD
Fig. 3                  China’s credit growth is slowing                               Rising market inflation expectations and an increasingly
                                                                                       muted rise in bond yields paint a bearish picture for real
China M2 money supply growth, % y/y
                                                                                       (ie, net-of-inflation) bond yields from here.
                  15
                                                                                       For gold, this is a positive as lower real yields reduce
                  14
                                                                                       the opportunity cost of holding the non-yielding metal.
                  13
                                                                                       We continue to view it as a core holding, though, as
                  12
                                                                                       gains are unlikely to exceed those on global equities.
              %

                  11
                  10                                                                   For the USD, the prospect of lower real bond yields
                   9                                                                   could provide a catalyst for a resumption of the long-
                   8                                                                   term downtrend (our ‘USD to slump in 2021’ theme).
                   7
                   Apr-15              Apr-17             Apr-19             Apr-21
Source: Bloomberg, Standard Chartered

                                                                                                                           Global Market Outlook   4
Strategy | Macro Overview | Bonds | Equity | FX | Alternatives | Performance Review

2   Our 12-month tactical asset allocation

    12-month tactical asset allocations for investors with a moderate risk profile (numbers may not sum to
    100% due to rounding)

               Bond 36%
                                                                                         Bond 36%
        4% - DM IG Govt                                41% Equity
        5% - DM IG Corp                                                             2% - DM IG Govt                            41% Equity
                                                       North America - 24%
       9% - DM HY Corp                                                              3% - DM IG Corp
                                                       Europe ex-UK - 2%                                                       North America - 16%
       6% - EM HC Govt                                                             6% - DM HY Corp            Asia
                                    Global             UK - 2%                                                                 Europe ex UK - 5%
        5% - EM LC Govt                                                            8% - EM HC Govt          balanced
                                   balanced            Japan - 2%                                                              UK - 3%
    8% - Asia USD bonds                                                             7% - EM LC Govt
                                                       Asia ex-Japan - 7%                                                      Japan - 2%
                                                                               10% - Asia USD bonds                            Asia ex Japan - 12%
                6% Cash                                Other EM - 3%
                                                                                                                               Other EM - 4%
                5% Gold                                                                    6% Cash
         11% Alternatives                                                                  5% Gold
                                                                                    11% Alternatives

           20% Non-core                                40% Bond                             Equity hedge                  Relative value
        8% - Covered calls                             DM IG Govt - 2%                          38%                           22%
        9%- Sub financials                             DM IG Corp - 1%
                                     Global            DM HY corp and senior                               Alternatives
              3% - Others
                                   multi-asset                                                              allocation
                                    income             floating rate loans - 14%
              40% Equity
                                                       EM HC Govt - 8%
         40% - Global high
                                                       EM LC Govt - 4%                      Global macro                  Event driven
           dividend equity
                                                       Asia USD bonds - 11%                     6%                           34%

    Summary of our key asset class views
                                View detail
    USD cash                     ▼      + Safety || - Close to no yield
    Bonds
    DM Govt                      ▼      + High credit quality, policy support || - Very sensitive to rising US bond yields
    DM IG Corporate              ▼      + Policy support || - Very sensitive to rising US bond yields
    DM HY Corporate              ▲      + Attractive yield, low rate sensitivity || - Unexpected defaults, valuations
    EM USD Govt                  ▲      + Attractive yield, attractive value || - Sensitivity to rising yields, USD rebound
    EM Local Ccy Govt            ◆      + Moderate yield, weak USD view || - Rising policy rates in some EMs
    Asia USD                     ▲      + Moderate yield, low volatility || - China policy risk
    Equities
    North America                ▲      + Growth, earnings rebound, policy support || - Early Fed taper, potential tax rise
    Europe ex-UK                 ▼      + Rotation to Value, policy support || - Geopolitics, slow vaccination progress
    UK                           ▲      + Attractive valuation, Value rotation, Brexit deal || - Policy risk, strong GBP
    Japan                        ◆      + Global economic recovery || - JPY strength, China policy tightening
    Asia ex-Japan                ◆      + Earnings rebound || - China policy tightening, COVID-19, USD rebound
    Gold                         ◆      + Weak USD, diversifier benefits || - Return of risk appetite, higher real yields
    Alternatives                 ◆      + Diversifier characteristics || - Equity, corporate bond volatility

    Source: Standard Chartered Global Investment Committee
    Legend:      ▲ Most preferred | ▼ Least preferred | ◆ Core holding || Green: upgrade from prior view | Red: downgrade from prior view

    5        Global Market Outlook
Strategy | Macro Overview | Bonds | Equity | FX | Alternatives | Performance Review
19 Perspectives on key client questions
Audrey Goh Trang Nguyen
Senior Cross Asset Strategist Portfolio Strategist
How should investment allocations be positioned for
higher inflation?
With the US 10-year government bond yield rising by 73bps YTD on the
back of expectations for a strong economic rebound, inflation has quickly
become one of the most important considerations in asset allocation for
investors. We expect inflation to rise above 2% by year-end, before retracing
lower in 2022. For investors concerned about the effects of higher inflation
on their investment allocations, the growth and inflation framework below
can be a useful starting point.
Higher inflation is generally not a drag on equity returns when
growth expectations improve
Higher inflation expectations can have a mixed impact on asset prices via
two factors – expected cash flows and discount rates. Higher inflation
expectations may boost nominal cashflows, especially if companies are able
to pass on price increases to end users. However, if higher inflation leads
to higher interest rates, the present value of future cash flows may decline
as the interest rates used to ‘discount’ these flows goes up.
Expectations of a global economic rebound and a modest rise in inflation
are supportive of a view to allocate a higher weight to equities. Historically,
an environment of rising growth and higher inflation (our central scenario) is
a very supportive backdrop for equity assets, as shown in figure 4 below.
Fig. 4 Strong economic rebound supports the case for higher equity allocation even if inflation rises
Average 12m returns of various asset classes in different economic regimes (Oct 2005 to Feb 2021)
Global growth rising and inflation falling Global growth rising and inflation rising
25% 18%
(Our central scenario)
16%
20% 14%
12%
15% 10%
8%
10%
6%
5% 4%
2%
0% 0%
Global HDY
Asia USD
Global equities
Alternatives
Leveraged loans
Preferred
DM HY
Gold
EM HC govt
DM IG corp
Covered calls
DM IG govt
EM LC govt
Global REITs
Coco
Global HDY
Asia USD
Global equities
Alternatives
DM HY
EM HC govt
Preferred
Gold
DM IG corp
Leveraged loans
Covered calls
EM LC govt
Global REITs
DM IG govt
Coco
Global growth falling and inflation rising Global growth falling and inflation falling
12% 12.0%
10% 9.0%
8% 6.0%
6% 3.0%
4% 0.0%
2% -3.0%
0% -6.0%
Preferred
Gold
Alternatives
Asia USD
DM HY
EM HC govt
Global HDY
DM IG corp
Global equities
Covered calls
EM LC govt
Global REITs
Coco
Leveraged loans
DM IG govt
Alternatives
EM HC govt
Covered calls
Asia USD
Preferred
Gold
DM HY
Global HDY
EM LC govt
DM IG corp
Global equities
Global REITs
Coco
DM IG govt
Leveraged loans
Source: Bloomberg, Standard Chartered. Economic scenarios are identified by BCA research data across business cycles. Refer to
Explanatory notes related to Contingent Convertibles at the end of this document
Global Market Outlook 6
Strategy | Macro Overview | Bonds | Equity | FX | Alternatives | Performance Review

Tilt toward less rate-sensitive assets within a                          Fig. 5 Global equities and bond yields tend to
bond allocation                                                          rise together in periods of higher inflation
‘Duration’ is a measure of the sensitivity of the price of               expectations
a bond to a change in the yield. Figure 6 shows the                      12m rolling correlation between global equity prices
simulated returns of various fixed income components                     and US 10y Treasury yield
in the event of a shift in US government bond yields by                        1.5
+/- 50, 100 and 150bps.
                                                                               1.0
As bond yields continue rising on the back of improving                        0.5
growth (as we have seen YTD) and higher inflation

                                                                           %
                                                                               0.0
expectations, we would look for opportunities to
gradually reduce an investment allocation’s ‘duration’                         -0.5
by moving towards less interest-rate-sensitive assets.                         -1.0
That said, in the current low-yield environment, the                              Feb-00             Oct-06             Jun-13         Feb-20
                                                                                    Periods of rising global inflation expectations
yields on offer from short-term bonds are likely
insufficient to buffer for the effects of higher inflation.                           12m rolling correlation between Global equity prices & US
                                                                                      10Y Treasury yld
Intuitively, investors can increase protection against                   Source: Bloomberg, Standard Chartered
inflation by having some exposure to Treasury Inflation-
Protected Bonds (TIPS). However, most of these assets                    Having exposure to equities becomes
are already trading at negative real yields. US TIPS                     increasingly important during rising inflation
currently yield 0.10%, well below inflation, and already-                We also look at cross-asset correlation for more insights
elevated inflation expectations suggest limited room for                 on how to better prepare investment allocations for
further capital gains.                                                   higher inflation. As figure 5 illustrates, history suggests
An alternative solution is tilting the bond allocation                   that correlation between the equity market and bond
towards ‘credit’ (corporate and EM bond) assets that                     yields (as proxied by the 12-month rolling correlation
still offer relatively decent income with shorter                        between global equity prices and US 10-year Treasury
durations, such as DM HY bonds, contingent                               yield since 2000) tends to rise in the early phase of
convertibles and Asia USD bonds. These credit                            rising inflation expectation.
components tend to be sensitive to changes in growth                     While this relationship may not be stable across all
expectations and should do well in an environment of                     periods of rising inflation, it does argue the case to
improving growth (figure 4).                                             consider having exposure to equities to benefit from
                                                                         rising prices that tend to translate into higher margins
                                                                         and profitability for companies in the early phase of a
                                                                         pickup in inflation.

Fig. 6                   Total return of fixed income assets assuming different shifts in bond yields
Yield to worst and duration for fixed income asset as of 29 April 2021
                                               EM USD                EM LCY
                                 DM IG corp     govt    DM IG govt    govt            Asia USD         DM HY           Coco           TIPS
Yield to worst                     2.19%       5.04%      1.14%      5.29%              3.45%          4.39%          3.44%           0.10%
Duration                            8.44        7.88       7.39       5.29               4.60           4.27           3.91           2.78

                        -1.5%      14.9%       16.9%      12.2%      13.2%              10.4%          10.8%           9.3%           4.3%

                        -1.0%      10.6%       12.9%      8.5%       10.6%               8.1%           8.7%           7.3%           2.9%
    Change in yield*

                        -0.5%       6.4%        9.0%      4.8%        7.9%               5.8%           6.5%           5.4%           1.5%

                        0.0%        2.2%        5.0%      1.1%        5.3%               3.5%           4.4%           3.4%           0.1%

                        0.5%        -2.0%       1.1%      -2.6%       2.6%               1.2%           2.3%           1.5%           -1.3%

                        1.0%        -6.3%      -2.8%      -6.3%       0.0%              -1.2%           0.1%          -0.5%           -2.7%

                        1.5%       -10.5%      -6.8%      -9.9%      -2.6%              -3.5%          -2.0%          -2.4%           -4.1%
Source: Bloomberg, Standard Chartered. Simulated returns are calculated assuming a parallel shift across the whole yield curve. Refer to
Explanatory notes related to Contingent Convertibles at the end of this document.

7                      Global Market Outlook
Strategy | Macro Overview | Bonds | Equity | FX | Alternatives | Performance Review

Electric vehicles come of age

                                                                       declining costs and evolving consumer demand are
     Where are the investment opportunities                            converging to begin a golden age for electric cars.
in the electric vehicles sector?
                                                                       The World Resource Institute’s data shows transport
Electric vehicles (EVs) have been in investors’ spotlight
                                                                       accounts for around one-fifth of global carbon dioxide
over the past year and featured as an important
                                                                       (CO2) emissions. As more and more governments set
component of the transition towards a ‘net zero’ carbon
                                                                       ambitious targets to reduce carbon emissions, the focus
emission world powered by sustainable energy. We
                                                                       has accelerated on the electrification of transport.
believe       increased      government         support,

Fig. 7    Road transport vehicles account for the largest share of global CO2 emissions
Breakdown of global CO2 emissions from various forms of transportation in 2018. Transport accounts for 24% of
CO2 emissions from energy.
                                                                                                         Other (mainly transport of oil,
                                                                                                         gas, water, steam and other
                        74.5% of transport emissions come from road vehicles
                                                                                                            materials via pipelines)
                                                                                                                      2.2

                                                                                                     Aviation (81% from
                Road (passenger; includes cars,                       Road (freight; includes
                                                                                                      passenger; 19% Shipping Rail
                 motorcycles, buses, and taxis)                         trucks and lorries)
                                                                                                        from freight)   10.6  1.0
                             45.1                                              29.4
                                                                                                            11.6

   0           10          20           30          40           50               60            70               80            90            100
                                                                 %
Source: Our World in Data, Standard Chartered

EV growth across key markets                                           last year. This proportion is likely to increase
                                                                       substantially over the next decade.
Europe, China and the US were the top markets in
terms of EV sales in 2020.
EV sales in Western Europe are expected to exceed 1m                   Fig. 8          Projected EV share in light vehicle market
for the first time this year, according to Schmidt                     Current (light blue) and forecasted EV share of total
Automotive Research. While this increase, driven by                    light-vehicle market, %
government subsidies, is expected to weaken when                                       China                    Europe                     US
subsidies run out, demand is expected to accelerate
                                                                                        100                       100                      100
again in 2025 as a result of the next European Union
                                                                                         52                       44
CO2 emissions hurdle and a continued fall in EV costs.                                                                                      36
                                                                                         37                        33
China is also likely to consolidate its position as the                                                                                     17
fastest growing EV market in 2021, with a 40% sales                        7                         7                         3

increase forecast by the China Association of                            2020          2030      2020            2030        2020          2030
Automobile Manufacturers. According to research firm
                                                                               Aggressive scenario          Base scenario
Canalys, China represented 41% of global EV sales last
                                                                       Source: McKinsey Centre for Future Mobility, Standard Chartered
year (1.3m units), just behind Europe at 42%. The US
sold just a quarter of EVs sold by China (328,000 units).
                                                                       Battle for EV leadership to support global growth
There remains significant potential in the EV market in
both the US and China. Despite current growth rates,                   President Joe Biden has said that the US must
EV sales accounted for just 2.4% of overall auto sales                 significantly increase its production of EVs. Biden has
in the US and 6.3% of all passenger cars sold in China                 proposed a USD 174bn spending package aimed

                                                                                                                Global Market Outlook              8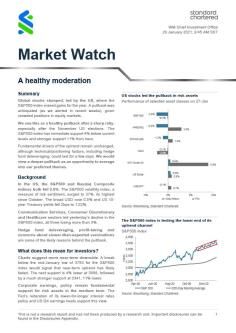
Strategy | Macro Overview | Bonds | Equity | FX | Alternatives | Performance Review

at driving consumer demand. The plan includes                 prices have fallen significantly in real terms since 2010
providing USD 100bn in consumer rebates and                   – from above USD 1,100 per kilowatt-hour to USD
developing supporting infrastructure, such as more EV         137/kWh in 2020. By 2023, Bloomberg estimates that
charging stations.                                            average prices will be close to USD 100/kWh, a level at
                                                              which automakers should be able to price mass market
China, meanwhile, had a head start in driving EV
                                                              EVs at the same price (and margin) as internal
adoption, having provided more than CNY 52bn (USD
                                                              combustion vehicles in some markets.
8bn) in subsidies. It is now focused on building
infrastructure such as EV charging stations and battery       ESG risks to consider in EVs
swapping and recycling facilities. According to
                                                              As the EV market continues to grow, it makes sense to
Bloomberg, China rolled out 112,000 public EV
                                                              be mindful of ESG risks, especially relating to battery
charging points in December 2020 alone, more than the
                                                              production.
entire US public charging network.
                                                              There are various social and environmental factors to
Declining costs to fuel long-term growth
                                                              consider throughout the supply chain – from extracting
Cost competitiveness relative to fossil fuel-powered          raw materials through to disposal and recycling of
vehicles is key to unlocking momentum in EV vehicles,         batteries. For example, the mining of lithium and cobalt
especially as governments eventually remove                   is often concentrated in countries with weaker social
consumer subsidies.                                           and environmental standards, raising reputational risks.
While consumers are increasingly concerned about              Another area is supply chain risks – China is a dominant
environmental issues, they remain price sensitive when        supplier along the EV supply chain, raising the sector’s
it comes to vehicle purchase and fuel costs. For              vulnerability to any further rise in geopolitical tensions
example, China saw its EV sales slow as it started            between the US and China.
cutting back on subsidies in 2019, resulting in an
                                                              However, the trend of electrification of transportation
extension of subsidies until 2022.
                                                              should accelerate, creating opportunities for investors
The battery is the most valuable part and the most            in industrial sectors that support the supply chain and
expensive single component of an EV. Advancements             related businesses. This could potentially address
in battery technology – making them better and cheaper        some of the above-mentioned risks.
– are therefore critical to watch. Lithium-ion battery pack

9     Global Market Outlook
Strategy | Macro Overview | Bonds | Equity | FX | Alternatives | Performance Review
2 Macro overview – at a glance
Rajat Bhattacharya Sean Pang
Senior Investment Strategist Investment Strategist
Key themes
The global economy continues to see divergence in growth and inflation amid a varied pace of vaccinations. The
US and UK are likely to achieve herd immunity (70% people fully vaccinated) by Q3, enabling economic activity to
normalise faster. The Euro area, which is in a double-dip recession, and Japan are likely to take longer to recover
amid renewed lockdowns and slower pace of vaccinations. The divergent economic outlook, high jobless rates and
excess productive capacities are likely to contain global inflation pressures, even in the US where prices should
settle down by 2022 after a jump this year caused by supply bottlenecks and statistical effects from last’s year’s
plunge. Against this backdrop, we expect major central banks to maintain their accommodative policies. There is a
risk the Fed could signal tapering of bond purchases in H2 if the job market heals faster than expected. US tax hikes
to fund President Biden’s infrastructure plan is another risk. China, in contrast, is likely to continue tightening credit
as it targets moderate growth, having subdued the pandemic and returned to pre-pandemic levels of overall activity.
Key chart
Faster vaccinations in the Fig. 9 Vaccination leaders (US, UK) have seen growth forecast upgrades
US and UK have boosted Consensus growth (2021) and inflation (2021-22) estimates for major economies
growth and inflation 9.0 3.5
GDP forecasts* y/y%
China inflation target (3%)
CPI forecasts* y/y%
3.0
expectations. Still, the 6.0
2.5
Developed markets inflation target (2%)
consensus is for US 3.0 2.0
inflation to return towards 1.5
0.0
the Fed’s target by 2022, Jan-20 Jun-20 Nov-20 Apr-21
1.0
0.5
while inflation in other US Euro area
0.0
UK China
markets remains subdued Emerging economies Japan
US UK Euro area Japan China
2021 2022
Source: Bloomberg, Standard Chartered, *Bloomberg consensus estimates
Macro outlook positive for risk assets Macro outlook negative for risk assets
Infrastructure plans follow pandemic aid – Tax hikes proposed to fund infrastructure
US
Faster vaccinations; herd immunity by Q3 – COVID cases still elevated; mutation risks
▽ ◆ △ Savings, jobs rebound lifting consumption – Goods demand to slow; precaution saving
Fed signals no rate hikes at least till 2023 – Weak credit demand; Fed tapering of QE
Euro area Rising vaccinations, vaccine passports – Vaccine supply delay, German lockdown
Industrial rebound; Q2 consumption lift – Industry supply shortages; weak services
▼ ◇ △ ECB to lift bond buying; Recovery Fund – Delays in Recovery Fund implementation
China Easing restrictions to revive consumption – Global goods-to-service shift to hit exports
Policy to boost domestic consumption – Credit, regulatory tightening; rising costs
▽ ◇ ▲ Robust manufacturing and exports – Precautionary savings; geopolitical risk
Japan Strong export growth, pent-up demand – Global goods-to-service shift to hit exports
More fiscal stimulus likely amid lockdowns – COVID-19 cases rising, new restrictions
▽ ◆ △ Vaccination rates to improve in H2 – Structural deflationary forces
UK Easing restrictions; longer pandemic aid – Brexit-related supply chain disruptions
Vaccines to lead to herd immunity by Q3 – Vaccine supply and safety setbacks
▽ ◆ △ Infrastructure spending boost – Tighter monetary policy risk amid inflation
Source: Standard Chartered Global Investment Committee Legend: ▲ Tighter policy | ▼ Easier policy | ◆ Neutral policy
Global Market Outlook 10Strategy | Macro Overview | Bonds | Equity | FX | Alternatives | Performance Review
2 Bonds – at a glance
Abhilash Narayan Cedric Lam
Senior Investment Strategist Senior Investment Strategist
Key themes
The 10-year US government bond yield stabilised over the past month, after the sharp rise in early 2021. Given a
global resurgence in virus cases, we expect the yields to be range-bound between 1.50% and 1.75% over the next
6-12 months. Despite the resurgence of virus risks in EMs, we retain our preference for Asian USD and EM USD
government bonds as we believe attractive relative valuations compared to DM bonds and the resumption of USD
weakness should help support their performance. We continue to favour DM HY corporate bonds due to the
reasonable yield on offer and tailwinds from strong vaccination progress in the US, and despite increasingly
expensive valuations.
Key chart
EM bonds still offer Fig. 10 EM bonds still offer relatively attractive yield premiums
attractive yield premiums Spread percentiles for various markets (since 2000); US HY bond yield premiums
that balance the risk of Current Median 2,000
spread Min Max Percentile
resurgence in COVID-19 1,500
US IG Corp 85 70 545 9%
cases. Despite expensive
US HY 291 233 1,971 4% bps
1,000
valuation relative to
history, DM HY bonds DM HY 359 221 1,804 16% 500
resemble the 2005-2007 EM USD 341 157 906 47%
0
episode when yield Asia USD 216 153 472 39% Jan-00 Feb-07 Mar-14 Apr-21
premiums had been Source: Bloomberg, Standard Chartered; as of 23 April 2021
consistently rich. * Credit spread = yield premium over US Treasuries. Percentile is an indicator of historic relative
valuation, where a lower number means an asset is more expensive compared to history, and vice versa.
The bullish case The bearish case
Asia Strong credit fundamentals – Reduction in government support could
USD Increasing foreign demand lead to higher defaults in China
▽ ◇ ▲ Attractive valuations relative to the US – Lower yields vs other EM bonds
DM HY Balance sheet improvement in 2021 – Expensive valuations
corporate Default rates to decline – Increase in supply
▽ ◇ ▲
Low interest rate sensitivity
EM USD Higher commodity prices – Resurgence in virus cases
Preference order
government Cheaper valuations vs US IG/HY bonds – High interest rate sensitivity
▽ ◇ ▲ Relatively attractive yield
EM local Higher commodity prices – Resurgence in virus cases
currency Improvement in EM FX reserves – Tighter EM monetary policy
▽ ◆ △ Relatively attractive yield – Stretched investor positioning
DM IG Strong credit fundamentals – Expensive valuations
corporate Attractive hedged yield for non-USD – High interest rate sensitivity
▼ ◇ △
investors – Low absolute yield
DM IG High credit quality – Improvement in growth and/or inflation
government Fed, ECB to remain accommodative – Large net issuance increase
▼ ◇ △
Source: Standard Chartered Global Investment Committee Legend: ▲ Most preferred | ▼ Less preferred | ◆ Core holding
11 Global Market OutlookStrategy | Macro Overview | Bonds | Equity | FX | Alternatives | Performance Review
2 Equity – at a glance
Daniel Lam, CFA Fook Hien Yap Belle Chan
Senior Cross-asset Strategist Senior Investment Strategist Senior Investment Strategist
Key themes
Global equity remains our most preferred asset class, driven by a cyclical economic recovery. Corporate earnings
appear to be benefitting from the growth rebound as monetary policies support investment and consumption, while
fiscal stimulus lifts demand further. Our most preferred market continues to be the US, given expectations of
infrastructure stimulus and the extremely accommodative Fed. The UK is also a preferred market, given the
country’s faster pace of vaccinations compared with other regions. The UK is also attractively valued compared with
other markets, with its Value-bias benefitting from the recovery in the pandemic-impacted sectors. Meanwhile, we
have downgraded Japan and Asia ex-Japan to core holding due to: 1) resurgence of COVID-19 cases, 2) valuation
being no longer cheap, and 3) continued tightening in liquidity in China when compared with the rest of the world.
Key chart
US earnings likely to be Fig. 11 US boosted by infrastructure stimulus; UK valuations inexpensive
boosted by infrastructure Consensus US EPS growth; consensus 12-month forward P/E ratio for MSCI Euro
stimulus, while UK equities area, UK and AC World
remain cheap relative to 30 21
19
12m fwd P/E (x)
20
the rest of the world
EPS growth (%)
17
10
15
0
13
-10 11
-20 9
-30 7
Jan-20 Jun-20 Nov-20 Apr-21 Jan-07 Oct-11 Jul-16 Apr-21
2020 2021 2022 Euro area UK AC World
Source: MSCI, FactSet, Standard Chartered
The bullish case The bearish case
US Fiscal, infrastructure stimulus – Expensive valuations
equities Reopening; leader in vaccine rollout – Rising real yields
▽ ◇ ▲ ▲Most positive earnings guidance – Spectre of capital gains tax hike
UK Reopening; leader in vaccine rollout – Stronger GBP holding back gains
equities Rotation to value – Household savings increased, but
▽ ◇ ▲ Inexpensive valuations
Return of dividends
lagging other regions
Preference order
Asia ex-Japan Global trade recovery – Tightening liquidity in China
equities USD weakness – Regulatory risks for Growth stocks
▽ ◆ △ –
–
Geopolitical risks
Resurgence in COVID-19
Japan Cyclical heavy – Potentially stronger JPY
equities Attractive valuations – Resurgence in COVID-19
▽ ◆ △ Global trade recovery – Stretched investor positioning
Euro area Rotation to Value – Laggard in vaccine inoculation
equities Higher bond yields benefit Euro area – Earnings revision weaker than other
▼ ◇ △ the most regions
Source: Standard Chartered Global Investment Committee Legend: ▲ Most preferred | ▼ Less preferred | ◆ Core holding
Global Market Outlook 12Strategy | Macro Overview | Bonds | Equity | FX | Alternatives | Performance Review
2 FX – at a glance
Manpreet Gill DJ Cheong, CFA
Head, FICC Investment Strategy Investment Strategist
Key themes
We expect a range-bound USD over the next 1-3 months as near-term relative US growth and real bond yield
outperformance likely fade. Our 12-month view remains USD bearish as the longer-term cyclical USD decline
resumes. We expect faster global vaccinations to revive non-US growth and yields. The Fed is expected to keep
policy accommodative, slowing the rise in nominal bond yields. USD risk appetite may decline if US budget and
trade deficits surge. We prefer high-beta currencies such as the GBP and AUD, as well as EUR, over the JPY.
Prolonged global growth dislocation, possibly driven by the pandemic or geopolitics, is a key risk to our view.
Key chart
The counter-cyclical USD Fig. 12 The counter-cyclical USD is likely to resume its longer-term decline
has tended to follow a USD Index (DXY) monthly chart with stylistic representation of long-term cycles
long 6- to 9-year cycle. 165
We believe that the
145
longer-term down cycle
will resume once near- 125
DXY
term consolidation ends. A
105
rise in global economic
growth and rising US twin 85
deficits are likely weak- 65
USD drivers Jan-70 Nov-82 Sep-95 Jul-08 May-21
Source: Bloomberg, Standard Chartered
12-month 12-month
The bullish case The bearish case The bullish case The bearish case
outlook outlook
USD Rising nominal – Fed policy and USD/ Possible slowing – Rising global
(DXY) and real yields ample USD supply CNY credit impulse trade and exports
Greater fiscal – US twin deficits Fading relative – Domestic growth
▼ stimulus boost and global growth
▼ rate differentials recovery extends
EUR/ Better vaccination – Pandemic issues USD/ Slow global travel – Non-monetisation
USD & growth recovery continue to weigh SGD & leisure rebound of fiscal stimulus
A stronger shift to – Failure to deploy Slower China – Rising global
▲ fiscal stimulus fiscal stimulus
◆ growth and trade growth and trade
GBP/ Vaccination-led – Brexit deal impact USD/ Longer lasting – Strong commodity
USD growth recovery on services MYR pandemic impact price correlation
Interest rates – Threat of move to Slower China – Rising global
▲ unlikely to fall fiscal austerity
▼ growth and trade growth and trade
AUD/ Global growth and – RBA may lean USD/ Higher oil prices – Policy support
USD commodity prices against AUD rise INR and RBI policy likely to continue
Stronger domestic – China impulse Pandemic impact – Rising inflows for
▲ demand may weaken
◆ may derail growth bonds & equities
USD/ Rising nominal US – Narrowing real USD/ Slower China – Expected inflows
JPY Treasury yields yield differentials KRW growth and trade for investments
Weak safe-haven – Currency hedging Geopolitical – Strong tech sector
◆ demand for JPY offshore assets
▼ tensions exports
Source: Standard Chartered Global Investment Committee Legend: ▲ Most preferred | ▼ Less preferred | ◆ Core holding
13 Global Market OutlookStrategy | Macro Overview | Bonds | Equity | FX | Alternatives | Performance Review
10 Technicals
Manish Jaradi
Senior Investment Strategist
S&P500: Where is it headed? Fig. 13 S&P500: Next levels to watch
Fibonacci projections and price channels often provide S&P500 index weekly chart
a guide when markets are at record highs. For the
4,500
S&P500 index, the 78% projection of the March 2020–
September 2020 price move works out to roughly 4300 4,000
S&P 500 Index
(about 2% above the April 29 close). The top end of an
3,500
extended pitchfork channel is currently around 4450
(+5.7%). 3,000
The ‘outside view’ (based on historical trends) tends to 2,500
support the case for further rise in the index. For the first
time at least since 1996, 97% of members within the 2,000
Nov-18 Sep-19 Jul-20 May-21
S&P500 index were above their respective 200-DMAs.
In the past, there have been two occasions when 95% Source: Refinitiv, Standard Chartered
of the members have been above the average. The
index was up 100% of the times in the subsequent one
year in both instances.
Fig. 14 Gold: Downward pressure is abating
Gold: Downward pressure is abating XAU/USD weekly chart
A minor double-bottom pattern (the March lows) 2,100
triggered this month is a sign that the seven-month long
1,900
downward pressure on the yellow metal is abating. The
price objective of the pattern points to a rise towards 1,700
Gold
1,835. To be fair, this doesn’t mean that the downtrend
1,500
is reversing – it could be, but to confirm this, gold would
need to break above immediate resistance on the 200- 1,300
DMA (now at about 1,856), roughly coinciding with the
1,100
upper edge of a declining channel from August. Dec-18 Nov-19 Oct-20
Source: Refinitiv, Standard Chartered
US 10-year Treasury yield: Upward pressure
Fig. 15 US 10-year Treasury yield: Support at the
eases
55-DMA
In last month’s Global Market Outlook, we highlighted
UST 10y yield daily chart with 55-DMA & 100-DMA
the increased chances of an imminent pause in the US
10-year Treasury yield’s rally. The yield’s break below a 1.9
US 10Y Treasury yield
minor uptrend line from January confirms the upward 1.7
pressure has eased somewhat. We believe a break 1.5
below the 55-DMA, which has broadly defined the 1.3
uptrend since late 2020 (see chart), would be a 1.1
confirmation that the retreat has further to run. Such a 0.9
break could pave the way towards quite strong support 0.7
on the 100-DMA (now at 1.32%). On the upside, the 0.5
Jul-20 Oct-20 Jan-21 Apr-21
March high of 1.776% remains a tough resistance level.
US 10y Treasury yield 55DMA 100DMA
Source: Refinitiv, Standard Chartered
Global Market Outlook 14Strategy | Macro Overview | Bonds | Equity | FX | Alternatives | Performance Review
11 Tracking market diversity
Francis Lim
Senior Quantitative Strategist
About our market diversity indicators
Our market diversity indicators help to identify a potential change in short-term trends due to a fall in market
breadth across equities, credit, FX and commodities. When market diversity falls, it implies either buyers or
sellers are dominating, leading to a rapid rise or fall in asset prices. This is usually unsustainable and is likely to
be followed by a slowdown or a reversal. Our diversity indicator is based on a statistical index called fractal
dimension; a value below 1.25 serves as a guideline that prices are rising or falling too fast.
Where is diversity falling or rising this month? Another key change is in the US 10-year government
Global equities have been the best performing asset bond yield, which our indicator had previously flagged
class after rising 10% so far into 2021. This is despite for low diversity – this has improved after the recent
several setbacks along the way due to fears of the pullback in the yield. The short-term change in yield was
ongoing pandemic, impact of higher interest rates and accompanied by a temporary reversal in gold. The
rich equity valuation. While these factors will continue to diversity of the commodity remains a touch above our
evolve, our market diversity indicator has yet to show standard minimum threshold.
signs of fatigue in equities since early February. On the In debt markets, diversity of DM IG government bonds
contrary, we find market diversity at current level is often and corporate bonds have also improved. This is not
a supportive signal for a trend continuation. surprising given the higher duration of these assets (ie.
sensitivity to changes in interest rate levels) and the
Fig. 16 Average market diversity score across recent pullback in the US 10-year yield.
equities, bonds and FX
Market diversity are broadly healthy Fig. 18 Diversity of equities remains healthy and
2.3 that for DM bonds has improved
2.1 30-day
1.9
Market diversity
Index
Level 1 diversity trend
●
1.7
Gold Spot
1.5
1.3 Bond
1.1 DM IG Sovereign Bond Index ◐
Apr -20 Jul-20 Oct-20 Jan-21 Apr -21
Equity Bonds Currencies DM IG Corporate Bond Index ◐
Source: Bloomberg, Standard Chartered Equity
MSCI USA Index ◐
Fig. 17 % of assets with diversity score < 1.25
MSCI Europe Index ◐ →
Number of low diversity assets remains low
100%
MSCI AC Asia ex-Japan Index ●
Rates
80%
60%
US 10-year Govt. Bond Yield ◐ →
Source: Bloomberg, Standard Chartered; data as on 29 April 2021
40%
Legend: ○ Very low ◐ Low/moderate ● High
20%
0%
Apr-20 Jul-20 Oct-20 Jan-21 Apr -21
Equity Bonds Currencies
Source: Bloomberg, Standard Chartered
15 Global Market OutlookStrategy | Macro Overview | Bonds | Equity | FX | Alternatives | Performance Review
14 Asset allocation summary
ASIA FOCUSED GLOBAL FOCUSED
Conservative
Conservative
Aggressive
Aggressive
Aggressive
Aggressive
Moderately
Moderately
Moderate
Moderate
Summary View
Cash ▼ 14 6 3 0 14 6 3 0
Fixed Income ▼ 63 36 24 6 63 36 24 6
Equity ▲ 23 41 57 85 23 41 57 85
Gold ◆ 0 5 5 4 0 5 5 4
Alternatives ◆ 0 11 11 5 0 11 11 5
Asset class
USD Cash ▼ 14 6 3 0 14 6 3 0
DM Government Bonds ▼ 4 2 2 0 6 4 2 1
DM IG Corporate Bonds ▼ 6 3 2 1 8 5 3 1
DM HY Corporate Bonds ▲ 10 6 4 1 15 9 6 1
EM USD Government Bonds ▲ 14 8 5 1 11 6 4 1
EM Local Ccy Government Bonds ◆ 11 7 4 1 9 5 3 1
Asia USD Bonds ▲ 17 10 7 2 13 8 5 1
North America Equities ▲ 9 16 22 33 13 24 34 50
Europe ex-UK Equities ▼ 3 5 7 11 1 2 3 5
UK Equities ▲ 1 3 4 5 1 2 3 5
Japan Equities ◆ 1 2 2 4 1 2 2 3
Asia ex-Japan Equities ◆ 7 12 17 25 4 7 10 15
Non-Asia EM Equities ◆ 2 4 5 7 2 3 4 7
Gold ◆ 0 5 5 4 0 5 5 4
Alternatives ◆ 0 11 11 5 0 11 11 5
All figures in %. Source: Standard Chartered
Note: (i) For small allocation we recommend investors to implement through global equity/global bond product; (ii) Allocation figures may not
add up to 100 due to rounding.
Legend: ▲ Most preferred | ▼ Least preferred | ◆ Core holding
Global Market Outlook 16Strategy | Macro Overview | Bonds | Equity | FX | Alternatives | Performance Review
14 Market performance summary*
2021 YTD 1 Week
Equity | Country & Region
10.1% Global Equities 1.4%
9.2% Global High Divi Yield Equities 0.3%
10.7% Developed Markets (DM) 1.4%
6.1% Emerging Markets (EM) 1.7%
11.9% US 1.8%
10.5% Western Europe (Local) -0.1%
9.8% Western Europe (USD) 0.6%
6.6% Japan (Local) -0.6%
1.0% Japan (USD) -1.5%
10.0% Australia 1.0%
6.5% Asia ex-Japan 1.9%
13.8% Africa -0.2%
5.8% Eastern Europe 1.4%
0.5% Latam 1.4%
18.6% Middle East 2.3%
2.5% China 1.3%
5.6% India 4.3%
6.0% South Korea 0.4%
19.5% Taiwan 3.4%
Equity | Sector
7.5% Consumer Discretionary 1.1%
2.3% Consumer Staples -0.3%
20.1% Energy 4.6%
17.8% Financial 4.0%
4.8% Healthcare -0.9%
11.5% Industrial 0.9%
8.5% IT 0.9%
14.4% Materials 1.7%
14.2% Telecom 3.5%
3.2% Utilities -0.7%
12.1% Global Property Equity/REITs 1.0%
Bonds | Sovereign
-4.1% DM IG Sovereign -0.3%
-3.6% US Sovereign -0.4%
-4.7% EU Sovereign 0.1%
-2.6% EM Sovereign Hard Currency -0.4%
-3.6% EM Sovereign Local Currency 0.4%
-5.4% Asia EM Local Currency 0.2%
Bonds | Credit
-2.9% DM IG Corporates -0.1%
1.7% DM High Yield Corporates 0.4%
1.9% US High Yield 0.3%
1.5% Europe High Yield 0.9%
-1.1% Asia Hard Currency -0.3%
Commodity
15.5% Diversified Commodity 2.5%
19.5% Agriculture 1.4%
27.3% Energy 4.6%
16.9% Industrial Metal 4.2%
-5.8% Precious Metal -0.7%
32.7% Crude Oil 4.8%
-6.6% Gold -0.7%
FX (against USD)
-0.4% Asia ex-Japan 0.6%
0.9% AUD 0.8%
-0.8% EUR 0.9%
2.0% GBP 0.8%
-5.1% JPY -0.9%
-0.4% SGD 0.2%
Alternatives
3.0% Composite (All strategies) 0.7%
0.4% Relative Value 0.1%
3.4% Event Driven 0.5%
5.9% Equity Long/Short 1.3%
1.7% Macro CTAs 1.0%
-20% -10% 0% 10% 20% 30% 40% -4.0% 0.0% 4.0% 8.0%
Source: MSCI, JPMorgan, Barclays, Citigroup, Dow Jones, HFRX, FTSE, Bloomberg, Standard Chartered
*All performance shown in USD terms, unless otherwise stated
*YTD performance data from 31 December 2020 to 29 April 2021 and 1 week-performance from 22 April 2021 to
29 April 2021
17 Global Market OutlookStrategy | Macro Overview | Bonds | Equity | FX | Alternatives | Performance Review
2 2021 key events
MAY 2021 JUNE 2021 JULY 2021
06 BoE policy decision 10 ECB policy decision 01 100th anniversary of the
Chinese Communist
Party
06 Scottish parliament 16 FOMC policy decision 16 BoJ policy decision
elections
18 BoJ policy decision 22 ECB policy decision
18 Iran presidential 28 FOMC policy decision
elections
24 BoE policy decision
AUGUST 2021 SEPTEMBER 2021 OCTOBER 2021
05 BoE policy decision 9 ECB policy decision 22 Deadline for Japan
General Elections
17 World Economic Forum 22 FOMC policy decision 28 BoJ policy decision
annual meeting in
Singapore
22 BoJ policy decision 28 ECB policy decision
23 BoE policy decision
26 Federal elections in
Germany
NOVEMBER 2021 DECEMBER 2021
03 FOMC policy decision 15 FOMC policy decision
04 BoE policy decision 16 BoE policy decision
16 ECB policy decision
17 BoJ policy decision
▬ Central bank policy |▬ Geopolitics | ▬ EU politics
X – Date not confirmed | ECB – European Central Bank | FOMC – Federal Open Market Committee (US) | BoJ – Bank of Japan |
BoE – Bank of England | RBA – Reserve Bank of Australia
Global Market Outlook 18Strategy | Macro Overview | Bonds | Equity | FX | Alternatives | Performance Review
Our key advisory publications
WEEKLY
DAILY
ANNUALLY
MONTHLY
Annual Outlook Global Market Weekly Market View Global Wealth Daily
Outlook
AD HOC
Investment Brief
Market Watch 360 Perspectives
Annual Outlook – The Annual Outlook highlights our Market Watch focuses on major events or market
key investment themes for the year, the asset classes developments and their likely impact on our investment
we expect to outperform and the likely scenarios as we views.
move through the year.
360 Perspectives provides a balanced assessment of
Global Market Outlook – Our monthly publication the outlook for an asset class. It presents both the
which presents the key investment themes and asset positives and negatives of the asset class, as well as
allocation views of the Global Investment Committee for the major drivers, instead of offering a specific view.
the next 6-12 months.
Investment Brief explains the rationale behind our
Weekly Market View – Our weekly publication which views on an asset class, incorporating the fundamental
provides an update on recent developments in global and technical drivers.
financial markets and their implications for our
Speak to your Relationship Manager/Investment
investment views.
Advisor today for access to our security specific
Global Wealth Daily is an early morning update of publications.
major economic and political events and their day-to-
To visit our Market views
day impact on various assets classes the previous day. CLICK HERE
on-the-go page
19 Global Market Outlook2 Explanatory notes
1. Contingent Convertibles are complex financial instruments and are not a suitable or appropriate investment for
all investors. This document is not an offer to sell or an invitation to buy any securities or any beneficial interests
therein. Contingent convertible securities are not intended to be sold and should not be sold to retail clients in the
European Economic Area (EEA) (each as defined in the Policy Statement on the Restrictions on the Retail
Distribution of Regulatory Capital Instruments (Feedback to CP14/23 and Final Rules) (“Policy Statement”), read
together with the Product Intervention (Contingent Convertible Instruments and Mutual Society Shares) Instrument
2015 (“Instrument”, and together with the Policy Statement, the “Permanent Marketing Restrictions”), which were
published by the United Kingdom’s Financial Conduct Authority in June 2015), other than in circumstances that do
not give rise to a contravention of the Permanent Marketing Restrictions.
Disclosures
This document is confidential and may also be privileged. If you are not the intended recipient, please destroy all
copies and notify the sender immediately. This document is being distributed for general information only and is
subject to the relevant disclaimers available at https:// www. sc. com/en/regulatory-disclosures/#market-
commentary-disclaimer. It is not and does not constitute research material, independent research, an offer,
recommendation or solicitation to enter into any transaction or adopt any hedging, trading or investment strategy,
in relation to any securities or other financial instruments. This document is for general evaluation only. It does not
take into account the specific investment objectives, financial situation or particular needs of any particular person
or class of persons and it has not been prepared for any particular person or class of persons. You should not rely
on any contents of this document in making any investment decisions. Before making any investment, you should
carefully read the relevant offering documents and seek independent legal, tax and regulatory advice. In particular,
we recommend you to seek advice regarding the suitability of the investment product, taking into account your
specific investment objectives, financial situation or particular needs, before you make a commitment to purchase
the investment product. Opinions, projections and estimates are solely those of SCB at the date of this document
and subject to change without notice. Past performance is not indicative of future results and no representation or
warranty is made regarding future performance. Any forecast contained herein as to likely future movements in
rates or prices or likely future events or occurrences constitutes an opinion only and is not indicative of actual future
movements in rates or prices or actual future events or occurrences (as the case may be). This document must not
be forwarded or otherwise made available to any other person without the express written consent of the Standard
Chartered Group (as defined below). Standard Chartered Bank is incorporated in England with limited liability by
Royal Charter 1853 Reference Number ZC18. The Principal Office of the Company is situated in England at 1
Basinghall Avenue, London, EC2V 5DD. Standard Chartered Bank is authorised by the Prudential Regulation
Authority and regulated by the Financial Conduct Authority and Prudential Regulation Authority. Standard Chartered
PLC, the ultimate parent company of Standard Chartered Bank, together with its subsidiaries and affiliates (including
each branch or representative office), form the Standard Chartered Group. Standard Chartered Private Bank is the
private banking division of Standard Chartered. Private banking activities may be carried out internationally by
different legal entities and affiliates within the Standard Chartered Group (each an “SC Group Entity”) according to
local regulatory requirements. Not all products and services are provided by all branches, subsidiaries and affiliates
within the Standard Chartered Group. Some of the SC Group Entities only act as representatives of Standard
Chartered Private Bank and may not be able to offer products and services or offer advice to clients. They serve as
points of contact only. ESG data has been provided by Refinitiv. Refer to https://www.refinitiv.com/en/financial-
data/company-data/esg-research-data.
Market Abuse Regulation (MAR) Disclaimer
Banking activities may be carried out internationally by different branches, subsidiaries and affiliates within the
Standard Chartered Group according to local regulatory requirements. Opinions may contain outright “buy”, “sell”,
“hold” or other opinions. The time horizon of this opinion is dependent on prevailing market conditions and there is
Global Market Outlook 20no planned frequency for updates to the opinion. This opinion is not independent of Standard Chartered Group’s trading strategies or positions. Standard Chartered Group and/or its affiliates or its respective officers, directors, employee benefit programmes or employees, including persons involved in the preparation or issuance of this document may at any time, to the extent permitted by applicable law and/or regulation, be long or short any securities or financial instruments referred to in this document or have material interest in any such securities or related investments. Therefore, it is possible, and you should assume, that Standard Chartered Group has a material interest in one or more of the financial instruments mentioned herein. Please refer to https:// www .sc. com/en/banking-services/market-disclaimer.html for more detailed disclosures, including past opinions/ recommendations in the last 12 months and conflict of interests, as well as disclaimers. A covering strategist may have a financial interest in the debt or equity securities of this company/issuer. This document must not be forwarded or otherwise made available to any other person without the express written consent of Standard Chartered Group. Country/Market Specific Disclosures Botswana: This document is being distributed in Botswana by, and is attributable to, Standard Chartered Bank Botswana Limited which is a financial institution licensed under the Section 6 of the Banking Act CAP 46.04 and is listed in the Botswana Stock Exchange. Brunei Darussalam: This document is being distributed in Brunei Darussalam by, and is attributable to, Standard Chartered Bank (Brunei Branch) | Registration Number RFC/61. Standard Chartered Bank is incorporated in England with limited liability by Royal Charter 1853 Reference Number ZC18 and Standard Chartered Securities (B) Sdn Bhd, which is a limited liability company registered with the Registry of Companies with Registration Number RC20001003 and licensed by Autoriti Monetari Brunei Darussalam as a Capital Markets Service License Holder with License Number AMBD/R/CMU/S3-CL. China Mainland: This document is being distributed in China by, and is attributable to, Standard Chartered Bank (China) Limited which is mainly regulated by China Banking and Insurance Regulatory Commission (CBIRC), State Administration of Foreign Exchange (SAFE), and People’s Bank of China (PBOC). Hong Kong: In Hong Kong, this document, except for any portion advising on or facilitating any decision on futures contracts trading, is distributed by Standard Chartered Bank (Hong Kong) Limited (“SCBHK”), a subsidiary of Standard Chartered PLC. SCBHK has its registered address at 32/F, Standard Chartered Bank Building, 4-4A Des Voeux Road Central, Hong Kong and is regulated by the Hong Kong Monetary Authority and registered with the Securities and Futures Commission (“SFC”) to carry on Type 1 (dealing in securities), Type 4 (advising on securities), Type 6 (advising on corporate finance) and Type 9 (asset management) regulated activity under the Securities and Futures Ordinance (Cap. 571) (“SFO”) (CE No. AJI614). The contents of this document have not been reviewed by any regulatory authority in Hong Kong and you are advised to exercise caution in relation to any offer set out herein. If you are in doubt about any of the contents of this document, you should obtain independent professional advice. Any product named herein may not be offered or sold in Hong Kong by means of any document at any time other than to “professional investors” as defined in the SFO and any rules made under that ordinance. In addition, this document may not be issued or possessed for the purposes of issue, whether in Hong Kong or elsewhere, and any interests may not be disposed of, to any person unless such person is outside Hong Kong or is a “professional investor” as defined in the SFO and any rules made under that ordinance, or as otherwise may be permitted by that ordinance. In Hong Kong, Standard Chartered Private Bank is the private banking division of Standard Chartered Bank (Hong Kong) Limited. Ghana: Standard Chartered Bank Ghana Limited accepts no liability and will not be liable for any loss or damage arising directly or indirectly (including special, incidental or consequential loss or damage) from your use of these documents. Past performance is not indicative of future results and no representation or warranty is made regarding future performance. You should seek advice from a financial adviser on the suitability of an investment for you, taking into account these factors before making a commitment to invest in an investment. To unsubscribe from receiving further updates, please click here. Please do not reply to this email. Call our Priority Banking on 0302610750 for any questions or service queries. You are advised not to send any confidential and/or important information to the Bank via e-mail, as the Bank makes no representations or warranties as to the security or accuracy of any information transmitted via e-mail. The Bank shall not be responsible for any loss or damage suffered by you arising from your decision to use e-mail to communicate with the Bank. India: This document is being distributed in India by Standard Chartered Bank in its capacity as a distributor of mutual funds and referrer of any other third party financial products. Standard Chartered Bank does not offer any ‘Investment Advice’ as defined in the Securities and Exchange Board of India (Investment Advisers) Regulations, 2013 or otherwise. Services/products related securities business offered by Standard Charted Bank are not intended for any person, who is a resident of any jurisdiction, the laws of which imposes prohibition on soliciting the securities business in that jurisdiction without going through the registration 21 Global Market Outlook
You can also read