Glastonbury Center 2020 - Developing a Shared Vision Market Analysis - Longmont Downtown ...
←
→
Page content transcription
If your browser does not render page correctly, please read the page content below

Glastonbury Center 2020
Developing a Shared Vision

Market Analysis

Prepared by
              BBP & Associates LLC
              111 Annapolis Street
              Annapolis, MD 21401
              www.bbpallc.com

                                 September 2010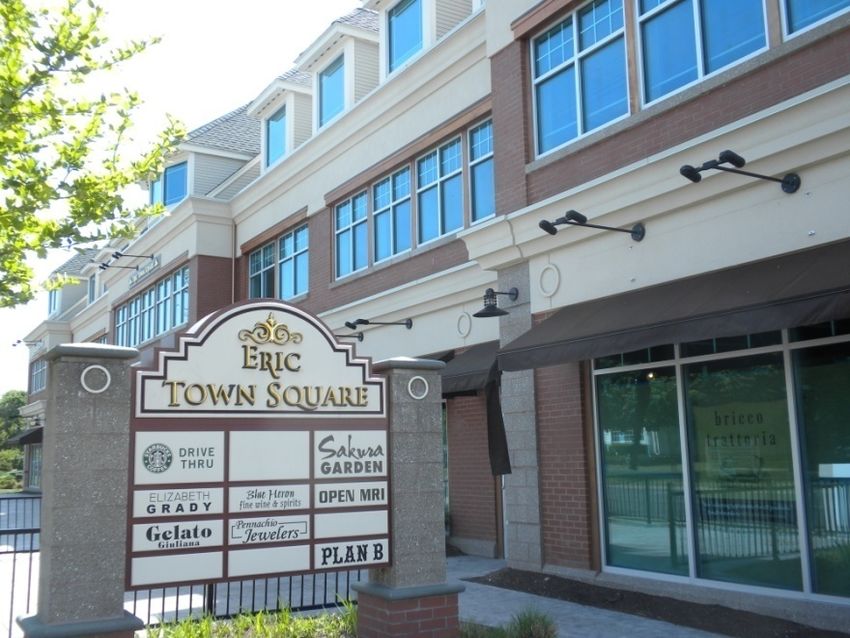

Market Analysis                                  Glastonbury Center 2020

Table of Contents

      1.0     Introduction                           2

      2.0     Economic and Demographic Profile       5

      3.0     Retail Market Analysis                 16

      4.0     Office Market Analysis                 42

      5.0     Residential Market Overview            51

      6.0     Development Opportunities              62

      Appendix                                       65

BBP & Associates LLC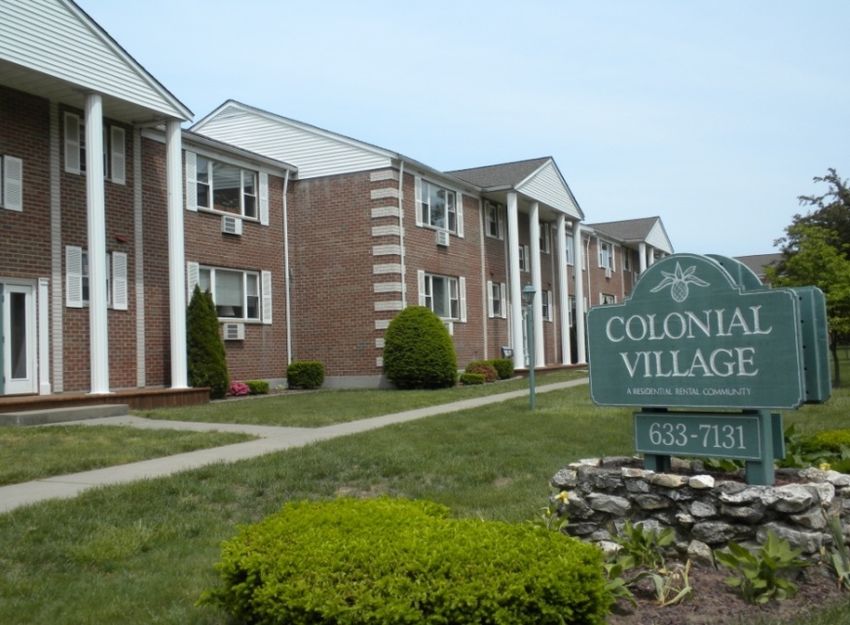
Market Analysis                                                           Glastonbury Center 2020

1.0 Introduction
1.1     Overview
Encompassing approximately 52 square miles with a population of nearly 34,000, the Town of
Glastonbury is an affluent Capitol Region suburb located approximately eight miles southeast of Hartford
(Connecticut). With its expansive land area, historic charm, and strategic location in the “center of
Connecticut” relative to the state’s capital city and interstate highways and varied topography,
Glastonbury has emerged as one of the region’s most desirable communities.

Originally settled by the Wongunks Connecticut Indian tribes, the Town has a strong history and tradition
of quality growth and economic development, top notch education opportunities, historic preservation and
a vibrant and diverse Town Center. Once primarily a farming community, Glastonbury has attracted many
quality businesses including high quality Class A office space and corporate business parks, a variety of
retail offerings and entertainment options, traditional manufacturing, and personal service businesses.
Today, Glastonbury has the second highest per capita income of any town in the Hartford metropolitan
area, with excellent schools, abundant recreational opportunities, upscale retail shopping and a strong
residential population base.

The Town recently updated its Plan of Conservation and Development (Plan) for the 10-year period 2007-
2017. Prepared as required under Connecticut General Statutes Section 8-23, the Plan outlines the
Town’s policies, goals and standards for the development of the Town over the next ten years including
conservation of existing resources. The Plan was developed and adopted by the Town Plan & Zoning
Commission (TP&Z) and received unanimous support of the Town Council (Council). Based on the
updated Plan, a joint Council/TP&Z subcommittee was formed to integrate desired and required changes
to the Town’s Building-Zone Regulation to reflect recommendations identified in the Plan.

Work completed by the Council/TP&Z subcommittee identified the need to better develop a shared
vision/concept for the Town Center area including better integration of economic sustainability and
development, potential new housing, vehicular and pedestrian circulation, parking and other
transportation and land use factors.

1.2     Study Purpose
The purpose of this project is to assist the Town by producing a Town Center shared vision/concept that
establishes a foundation for sustainable economic development and business expansion with a built
infrastructure that provides safe and efficient vehicular operations; improved pedestrian, public and
bicycle access; customer convenient and business friendly parking; enhanced lighting; new streetscape
opportunities; and the integration of new residential opportunities.

The Market Analysis focuses on the following:

    •   Summarize economic and demographic conditions and trends in Town Center, Town and
        Hartford region
    •   Outline market strengths, challenges and opportunities
    •   Provide retail, office and residential market data
    •   Profile development trends
    •   Identify potential sources of market demand for retail, office and residential uses in the Town
        Center

 BBP & Associates LLC                                                                                  2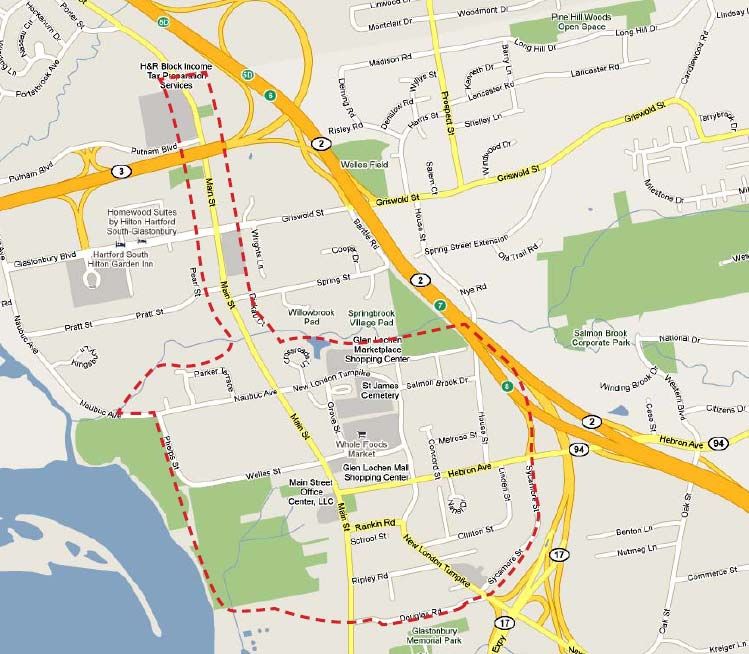
Market Analysis                                                      Glastonbury Center 2020

    •   Estimate development potential by market segment (retail, office and residential)
    •   Describe preliminary development opportunities for potential development and redevelopment
        sites

1.3     Report Organization
The report is organized into six sections. These sections include:

        Section 1       Introduction
        Section 2       Economic and Demographic Profile
        Section 3       Office Market Overview
        Section 4       Retail Market Overview
        Section 5       Residential Market Overview
        Section 6       Development Opportunities

 BBP & Associates LLC                                                                           3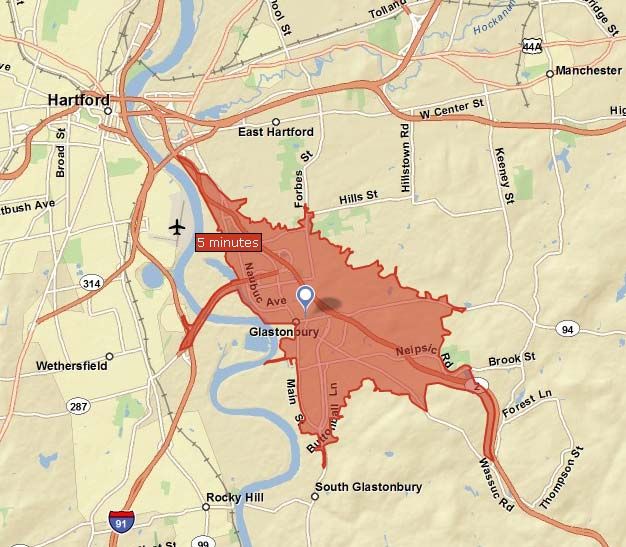
Market Analysis                                                            Glastonbury Center 2020

1.4     Participating Stakeholders
This report was informed by the insight of a variety of stakeholders. Individuals that lent their time and
expertise to this project included the following:

        Consultant Team
        Frank Fish, BFJ Planning
        Georges Jacquemart, BFJ Planning
        Melissa Kaplan-Macey, BFJ Planning
        Gary Sorge, Stantec
        Jim Prost, BBP & Associates LLC
        David Starnes, BBP & Associates LLC

        Steering Committee
        Richard Johnson, Town Manager
        Kenith Leslie, Town Planner
        Susan Karp, Town Council Chairperson
        Sharon Jagel, Town Plan & Zoning Commission Chairperson
        Timothy Coon, Town Council
        Pat Low, Town Plan & Zoning Commission

        Other Stakeholders
        Bruce Sawyer, Grove Properties
        Allan Schwartz, Eric Town Square
        Charles Davis, Centro Properties
        Don Goodwin, Murray Real Estate
        Robert Gaucher, O, R & L Realtors
        Craig Way, HB Nitkin
        David Valente, Town Assessor

                                                                        Glastonbury Town Green

 BBP & Associates LLC                                                                                   4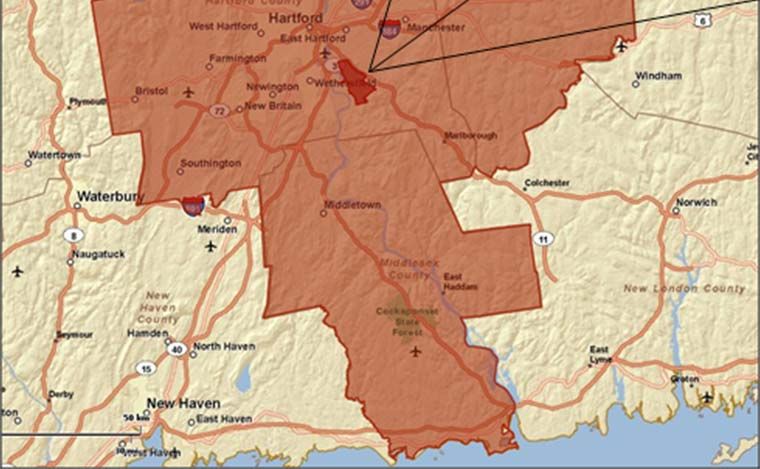
Market Analysis                                                        Glastonbury Center 2020

2.0 Economic and Demographic Profile
2.1    Overview
To understand the economic and market conditions in which the Town of Glastonbury and the Town
Center commercial businesses operate, a baseline economic and demographic profile was performed
which examines existing and projected demographic and economic factors for the Town Center, Town of
Glastonbury and greater regional geographic area (e.g. Hartford SMSA). Characteristics and trends of
households and employment within these areas were then compared to similar characteristics within the
predefined broader geographies to identify market opportunities for retail, office and residential
development within the study area.

2.2    Analysis Areas
The Glastonbury Town Center study area includes the area generally surrounding Main Street and along
New London Turnpike and Hebron Avenue within the municipal boundaries of the Town of Glastonbury.

                                  Exhibit 2.0 – Study Area Boundary

                                          Source: Googlemaps

 BBP & Associates LLC                                                                              5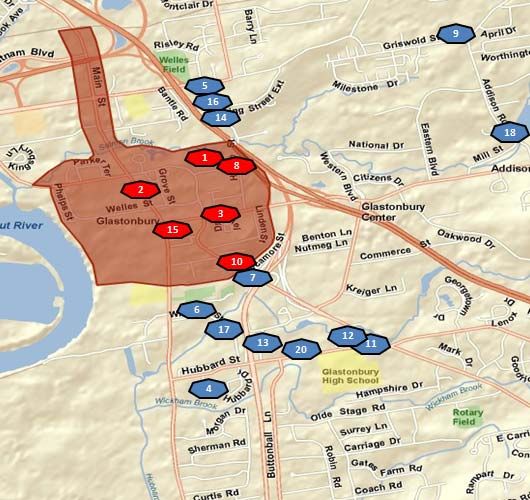
Market Analysis                                                               Glastonbury Center 2020

Other geographies assessed as part of this analysis include the Town of Glastonbury, communities east
of the Connecticut River (e.g. East Hartford, Manchester and South Windsor) and the Hartford regional
SMSA.

     Exhibit 2.1 – Town of Glastonbury and Town Center (including Greater Hartford Region)

                                 Source: ESRI Business Information Solutions

 BBP & Associates LLC                                                                                    6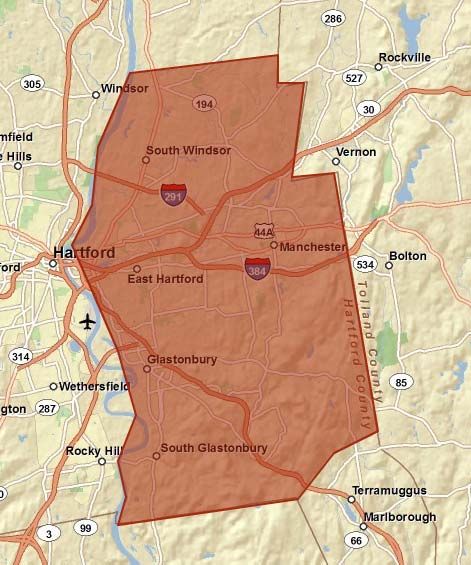
Market Analysis                                                                   Glastonbury Center 2020

2.4    Demographic and Economic Profile
To evaluate the depth and characteristics of potential demand presented by households and businesses
for commercial uses, an assessment of the demographic and economic conditions of Glastonbury Town
Center and the Town of Glastonbury and its surrounding geographic areas was performed.

Compared to the Town, Glastonbury Town Center has:

   •   5% of Town’s population
   •   7% of Town’s households
   •   35% of Town’s at-place employment (jobs)
   •   Smaller average household size (1.73) compared to Town (2.56) and region (2.46)
   •   Higher median age (50) compared to Town (43) and region (40)
   •   Lower median household income ($58,390) compared to Town ($96,994) and region ($68,289)
   •   More rental occupied housing (62%) compared to Town as a whole (22%)
   •   More affordable home values ($257,100) compared to Town ($371,300)

                             Exhibit 2.1 - Demographic & Economic Profile (2009)
                                      Town Center      Town of         SMSA            % of    % of
                                                     Glastonbury                       Town   SMSA
        Population                         1,683            33,224         1,198,934     5%   0.1%
        Households                          912             12,846          466,831      7%   0.2%
        Average Household Size              1.73             2.56             2.46      68%    70%
        Median Household Income           $58,390          $96,994          $68,289     60%    86%
        Median Household Value           $257,143          $371,258        $244,857     69%   105%
        % Owner Occupied                   38%               78%              62%       49%    61%
        Labor Force                         853             17,278          594,529      5%   0.1%
        At-Place Employment                6,476            18,738          658,180     35%     1%
        Median Age                           50               43               40      116%   125%
        Source: ESRI Business Information Solutions, BBPC 2010

Glastonbury Town Center residents are older when compared to the Town and region. 30% of Town
Center residents are 65+ years of age compared to 15% in the Town as whole. In addition, 15% are
school age (less than 20 years old) compared to 29% for the Town.

                                         Exhibit 2.2 – Age Cohort (2008)

                                     Source: ESRI Business Information Solutions

 BBP & Associates LLC                                                                                        7
Market Analysis Glastonbury Center 2020
The average household income ($58,390) of Town Center residents is 67% less compared to the Town of
Glastonbury as a whole ($96,994) and 18% less compared to the Hartford region ($68,289). More than
30% of Town Center households earn less than $35,000 compared to 11% for the Town. 50% of Town
Center households earn between $35,000 and $100,000 compared to 26% for the Town.
The Town of Glastonbury as a whole is an affluent community with nearly 50% of households earning
more than $100,000 compared to 19% of Town Center households and 25% of regional households
Exhibit 2.3 – Households By Income (2009)
Town Town of SMSA
Center Glastonbury
< $15,000 11.6% 3.5% 8.6%
$15,000 - $24,999 12.2% 4.3% 7.3%
$25,000 - $34,999 6.5% 3.3% 7.6%
$35,000 - $49,000 11.9% 7.1% 11.8%
$50,000 - $74,999 22.3% 14.0% 18.5%
$75,000 - $99,999 16.4% 19.6% 19.7%
$100,000 - $149,999 12.3% 17.7% 15.1%
$150,000 - $199,999 3.7% 14.7% 6.0%
$200,000 + 3.1% 15.8% 5.2%
Source: ESRI Business Information Solution, BBPC 2010
Households within the Town Center are comprised of fewer families than in surrounding geographies, and
contain a higher proportion of people over the age of 65. On average, 67% are family households in the
Town Center compared to 73% for the Town as a whole and 43% for the region. Households with
persons age 65+ comprise 25% of households in the Town Center compared to 23% for the Town as a
whole and 37% for the region
Exhibit 2.4 – Households by Type (2000)
Family Non-Family Households
with
Persons
65+
Town Center 67% 33% 25%
Town of Glastonbury 73% 27% 23%
SMSA 43% 57% 37%
Source: ESRI Business Information Solutions, BBPC 2010
To identify the lifestyle characteristics and housing preferences of local residents, an evaluation of top
household tapestry segments was performed. ESRI Business Information Solutions uses demographic
information such as labor force characteristics, median income, age, and spending habits to categorize
neighborhoods according to a trademarked Community Tapestry classification system.
The following table identifies the top tapestry segments in the Town Center, Town of Glastonbury and
Hartford SMSA. Glastonbury Town residents are affluent, comprised of families, empty nesters, retirees,
and young professionals, educated and Internet savvy, well read and active in their communities. Their
free time is typically devoted to family, travel, and self-improvement pursuits and their retail spending
includes home improvement, electronic gadgets, and upscale retailers.
BBP & Associates LLC 8Market Analysis Glastonbury Center 2020
Exhibit 2.5 – Top Selected Tapestry Segments
Exurbanites 6%
10%
City Lights 6%
Prosperous Empty Nesters 6%
6%
Wealthy Seaboard Suburbs 7%
2%
Connoisseurs 9%
100%
Retirement Communities 11%
3%
In Style 13%
7%
Suburban Splendor 42%
5%
0% 20% 40% 60% 80% 100% 120%
Town Center Town of Glastonbury Hartford MSA
Source: ESRI Business Information Solutions
The majority of residents within the Town represent the following tapestry segmentations:
¾ Exurbanites – Exurbanites are typically affluent married-couples, many of which are empty
nesters. Most residents work in professional and managerial occupations, though 20% of
residents have entered retirement. The typical household lives in an older single-family home in
a suburban community. Home and garden improvement and outdoor activities are common
leisure time pursuits.
¾ City Lights – The City Lights segment is diverse, consisting of different cultures, household
types, and housing preferences. This multiracial segment includes singles as well as families,
and residents live in single-family detached homes, townhomes, and apartments. Most residents
work in white-collar and service occupations and enjoy comfortable incomes. Residents enjoy
shopping, dining out, and fitness activities in their leisure time.
¾ Prosperous Empty Nesters – As the segment’s name implies, many Prosperous Empty Nesters
are affluent married couples with no children at home. Most residents are age 55 and over, and
while most are still working, a large minority (28%) collects retirement income. Most residents
live in older single-family detached homes. In their leisure time, residents exercise, golf, attend
sporting events, participate in civic organizations, and travel.
¾ Wealthy Seaboard Suburbs – Wealthy Seaboard Suburbs represent affluent, married-couple
families living in older communities in coastal metropolitan areas. Just under half of households
have children. Approximately 25% of households collect retirement income, while most of the
employed residents work in management or professional occupations. These residents are
among the top five most likely to commute to work (including community out-of-state to work).
BBP & Associates LLC 9Market Analysis Glastonbury Center 2020
¾ Connoisseurs – Connoisseurs represent somewhat of an older market of residents, where the
median age is 46.9 years. 70% of these households are married-couple families. With a median
household income of $123,255, these residents rank highest for conspicuous consumption.
These residents tend to live in older neighborhoods, where most homes are built before 1970,
and are located in densely populated city centers in established affluent areas. These residents
also live in a different state from where they work.
¾ Retirement Communities – Retirement Communities residents who are predominately singles
who live alone and represent an older market. These residents at the national level have a
median age of 51.4 years old with 44% of the households aged 65 years or older. Most residents
live in multi-unit structures and spend their free time engaging in leisure activities within their
residence.
¾ In Style – In Style residents represent professional couples who are computer savvy and typically
in a suburb of a metropolitan area. These residents are comprised of married couple families with
a slightly older median age at the national level of 40.2 years old. Known to be more educated
compared to the U.S. level, the median household income for this segment at the national level is
$72,112.
¾ Suburban Splendor – Suburban splendor represents families in growing neighborhoods,
typically located in metropolitan areas. With nearly half of the population aged between 35 and 64
years old, approximately 80% of the households consist of married couple families. Residents
have a median household income of $129,931 and work in management, professional, or sales
occupations. Compared to all tapestry segments, this tapestry segment leads home-ownership,
with 93% of householders owning their houses.
The diverse interest of these tapestry segments indicates they together demand a variety of retail goods
and services to meet their unique preferences. This demand is explored further in the retail market
analysis section.
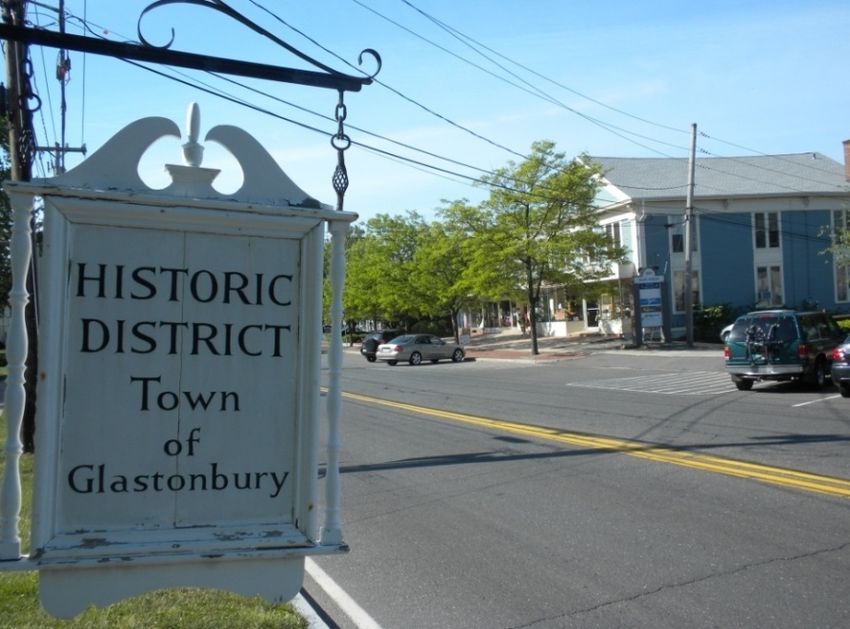
Glastonbury Historic District
BBP & Associates LLC 10Market Analysis Glastonbury Center 2020
2.5 Labor and Industry
In 2009, the Town of Glastonbury labor force totaled approximately 17,300 employed residents. Town
Center residents comprised approximately 850 employed residents or 5% of the Town’s total labor force.
The service industry dominates the labor force (46-47 percent) in the Town and Town Center, followed by
the finance, insurance and real estate industry (17-18 percent) then retail trade (8-9 percent).
Exhibit 2.6 – Labor Force by Industry (2009)
Town Center Town of Glastonbury Town
Employees % Employees % Center %
of Town
Agriculture 0 0% 69 0% 0%
Construction 32 4% 657 4% 5%
Manufacturing 89 10% 1,365 8% 6%
Wholesale Trade 28 3% 570 3% 5%
Retail Trade 68 8% 1,624 9% 4%
Transportation / Utilities 44 5% 587 3% 8%
Information 19 2% 346 2% 5%
FIRE 148 17% 3,145 18% 5%
Services 394 46% 8,121 47% 5%
Government 30 4% 795 5% 4%
Total 853 100% 17,278 100% 5%
Source: ESRI Business Information Solution, BBPC 2010
In terms of at-place employment, the top three job categories in the Town are services (53 percent)
followed by retail trade (18 percent) and Finance, Insurance and Real Estate-FIRE (13 percent). The
Town Center provides 35% of all jobs in the Town including 31% of all retail jobs, 39% of service jobs
(e.g. health, legal, education, other) and 82% of government jobs. Overall, the Town as a whole has more
residents than jobs (employee-residential population ratio of 0.57) while the Town Center has more jobs
than residents (employee-residential population ratio of 3.85). This suggests that the Town is an out-
commuting community (more residents then jobs) while the Town Center is a destination for in-commutes.
Exhibit 2.7 – At-Place Employment by Industry (2009)
Town Center Town of Town
Glastonbury Center % of
Employees % Employees % Town
Agriculture 28 0.4% 221 1% 13%
Construction 86 1% 719 4% 12%
Manufacturing 113 2% 1,100 6% 10%
Wholesale Trade 27 0.4% 509 3% 5%
Retail Trade 1,154 18% 3,700 20% 31%
Transportation / Utilities 82 1% 255 1% 32%
Information 10 0.2% 37 0.2% 27%
FIRE 874 13% 2,552 14% 34%
Services 3456 53% 8,856 47% 39%
Government 648 10% 789 4% 82%
Total 6,478 100% 18,738 100% 35%
Source: ESRI Business Information Solution, BBPC 2010
BBP & Associates LLC 11Market Analysis Glastonbury Center 2020
Retail trade and services are among the top two at-place employment categories in the Town of
Glastonbury accounting for nearly 70% of the at-place employees in the retail and services industries in
the Town. More than 35% of all the Town’s jobs are located in the Town Center (31% of retail trade jobs
and 39% of services jobs). Other observations include: 53% of the Town’s apparel jobs are located in the
Town Center, 43% of the Town’s legal jobs are located in the Town Center, 38% of health services jobs
are located in the Town Center and 49% of the Town’s eating and drinking places jobs are located in the
Town Center.
Exhibit 2.8 – Retail and Services At-Place Employment by Industry (2009)
Town Town of Town
Center Glastonbury Center %
Employees Employees of Town
Retail Trade 1,154 3,700 31%
Home Improvement 125 282 44%
General Merchandise Stores 0 1 0%
Food Stores 79 509 16%
Auto Dealers, Gas Stations 10 210 5%
Apparel & Accessory Stores 59 111 53%
Furniture & Home Furnishings 54 683 8%
Eating & Drinking Places 565 1,143 49%
Miscellaneous Retail 262 761 34%
Services 3,456 8,847 39%
Hotels & Lodging 49 102 48%
Automotive Services 41 100 41%
Motion Pictures & Amusements 46 519 9%
Health Services 480 1,270 38%
Legal Services 125 294 43%
Education & Libraries 102 1,084 9%
Other 2,613 5,478 48%
Total 4,610 12,547 37%
Source: ESRI Business Information Solution, BBPC 2010
BBP & Associates LLC 12Market Analysis Glastonbury Center 2020
2.6 Business Inventory – Glastonbury Town Center
In 2010 the Town of Glastonbury undertook an inventory of businesses located within the boundaries of
the Town Center. There were an estimated 505 total businesses in the Town Center. Services
businesses are dominant (56%) followed by General Retail (23%) and FIRE (16%). These businesses are
primarily located in retail shopping centers and along Main Street, Hebron Avenue and New London
Turnpike.
Exhibit 2.9 – Glastonbury Town Center Business Exhibit 2.10 - Glastonbury Town Center Business
Inventory Inventory (# of Businesses)
2010
Business Category # of %
Businesses
FIRE 83 16%
Services 281 56%
Retail
Health 109 22%
Legal 42 8%
23%
Personal 62 12%
Hotels & Lodging 1 0% Other Office
Other 67 13% Services
2%
Retail 115 23% 56%
Eating & Drinking 44 9% Construction/
Auto-Related 17 3% FIRE Interior
Apparel & Accessories 9 2% 16% Design/Lands
Furniture/Home Furnishing 14 3% caping
General 5 1% 3%
Food & Beverage Stores 9 2%
Other 17 3%
Other Office 11 2%
Construction/Interior 15 3%
Source: Town of Glastonbury, 2010
Design/Landscaping
Total 505 100%
Source: Town of Glastonbury
In terms of retail businesses, they were dominated by eating and drinking places (44 businesses or 38%
of the Town Center’s retail inventory), auto related retail (17 businesses or 15 percent) and
furniture/home furnishing (14 businesses or 12 percent). Notable observations include that the majority of
apparel and accessory businesses are jewelers and other unique retail businesses include photography
studios, children’s play/party rooms, karate and martial arts and music/guitar lessons shops.
BBP & Associates LLC 13Market Analysis Glastonbury Center 2020
Exhibit 2.11 - Glastonbury Town Center
Retail Business Inventory
Auto‐
Related
Eating & 15% Apparel &
Drinking Accessories
38% 8%
Furniture/
Home
Other Furnishing
15% 12%
Food & General
Beverage 4%
Stores
8%
Source: Town of Glastonbury, 2010
In terms of services businesses, they were dominated by health services (109 businesses or 39% of the
Town Center’s services inventory), personal services (62 businesses or 22%) and legal services (42
businesses or 15%). The predominant health related services include medical offices, medical suppliers,
physical therapy offices and health related consultants. Personal services are also present in large
quantities and include hair and nail salons as well as wellness/massage therapy businesses.
Exhibit 2.12 - Glastonbury Town Center
Services Business Inventory
Health
39%
Legal
15%
Personal
Other 22%
24%
Source: Town of Glastonbury, 2010
BBP & Associates LLC 14Market Analysis Glastonbury Center 2020
2.7 Summary Economic and Demographic Observations & Findings
The following table summarizes key observations and findings regarding the strengths, constraints, and
opportunities related to the demographic and economic characteristics and trends in the Glastonbury
Town Center study area.
Exhibit 2.13 – Economic and Demographic Observations
Strengths Constraints Opportunities
• Glastonbury is an affluent • Lack of specialized retail • Growth in selected “tapestry”
community comprised of businesses to cater to local demographic segments provides
families, empty nesters, population (e.g. opportunities to capture new
retirees and young clothing/apparel shops, residential demand in Town
professionals who are sporting goods) Center area
educated and Internet savvy, - Suburban Splendor
well read and active in their • Town Center is more of a - Prosperous Empty Nesters
communities business/employment center - Wealthy Seaboard Suburbs
than residential center - Connoisseurs
• Town Center is Town’s most - In Style
diverse area in terms of • Town Center residents are
housing and employment generally less affluent than the • Opportunity to capture leakage
opportunities Town as a whole of Town residents retail
expenditures by providing
• High incomes of Town specialty retail shopping to meet
households provide strong local demand
retail sales expenditure
potential relative to the region • Opportunity to provide high
and surrounding communities quality, market rate housing in
Town Center area to attract
targeted demographic segments
BBP & Associates LLC 15Market Analysis Glastonbury Center 2020
3.0 Retail Market Analysis
3.1 Overview
The Town of Glastonbury offers a wide variety of retail and business services to its residents and visitors
in particular in the Town Center area and its environs which is Glastonbury’s most diverse area and home
to a majority of the Town’s retail and service businesses.
The Main Street area is the historical “downtown” of Glastonbury and contains an eclectic range of retail
uses as well as neighborhood shopping centers. The area contains a variety of boutique shops, specialty
retail, restaurants and entertainment options. The Town Center has seen the most recent retail
development in the Town including the opening of Eric Town Square, Glastonbury’s newest lifestyle
center which offers retail and Class A office space in a mixed use environment, as well as a new Whole
Foods supermarket at the Shoppes at Fox Run.
Glastonbury has a number of specialty retail centers that offer local, regional and national chain stores.
This includes Somerset Square, off of Glastonbury Turnpike just north of the Town Center, a lifestyle
shopping center that has experienced continued development with the completion of two hotels as well as
additional retail and office space. The center offers several top national retailers such as: Talbots, Ann
Taylor, Chico’s, White House/Black Market, Coldwater Creek, J. Jill, Victoria’s Secret and Smith &
Hawken.
This section provides an overview of the retail market in Glastonbury and in the Town Center as well as
the Hartford region. It provides information on existing inventory, development activity, vacancy and
absorption. It then summarizes the Town’s current market position, strengths, challenges and
opportunities in terms of the retail market.
Eric Town Square, Glastonbury Town Center
BBP & Associates LLC 16Market Analysis Glastonbury Center 2020
3.2 Market Areas and Conditions
The Town of Glastonbury is situated within the broad context of the Hartford regional retail market. The
Hartford regional retail market encompasses the markets surrounding the City of Hartford and its
suburban communities. The retail submarkets most proximate to the Town of Glastonbury include:
Manchester, East Hartford, Hartford, Rocky Hill, East Hampton/East Haddam, Marlborough Outlying and
Wethersfield.
Exhibit 3.0 – Hartford Regional Retail Market Map
Source: CoStar
Retail Market Overview
The Hartford regional retail submarket comprises more than 138 million square feet of retail space
located in shopping centers, power centers, specialty centers, malls and general retail properties which
include freestanding retail buildings. The regional retail market has seen a decrease in vacancy rate over
the past four quarters dropping from 6.8% in the second quarter of 2009 to 6.2% in the first quarter of
2010.
The Town of Glastonbury’s retail market is located in the East market which includes East Hartford,
Manchester and South Windsor. The East market totals more than 12.8 million square feet of retail space
representing approximately 10% of the total Hartford regional retail market inventory. Glastonbury has 1.6
million square feet of retail space which represents 13% of the retail inventory in the East market.
Vacancy rates in the Town of Glastonbury are lower than in the East market and region averaging 5.6%
compared to 6.6% for the East market and 6.2% for the region.
BBP & Associates LLC 17Market Analysis Glastonbury Center 2020
Construction and delivery data for first quarter 2010 showed that competing submarkets have very little
development activity, if any. There is no retail development activity in the East market, including
Glastonbury. The only markets with development activity include City of Hartford, Middlesex County,
West, Litchfield County, Southwest, New London County and Windham County. This totals 356,000
square feet of retail development under construction as of the first quarter 2010.
Exhibit 3.1 – Hartford Regional Retail Market Snapshot
1st Quarter 2010
Existing Inventory Vacancy Average
# of Total GLA Avg Bldg Total SF Total % Rate
Bldgs Size Vacant Vacant
Town Center 73 756,721 10,366 77,863 10.30% $19.27
Town of Glastonbury 134 1,628,270 12,151 90,410 5.60% $20.49
East Market* 984 12,754,587 12,962 845,321 6.60% $15.47
Hartford Regional Market 12,836 138,773,949 10,811 8,641,564 6.20% $13.15
* East Market includes East Hartford, Glastonbury, Manchester, and South Windsor
Source: CoStar, Hartford Retail Market Report, 1st Quarter 2010
Within the eastern Hartford region Glastonbury is a smaller retail center when compared to Manchester
(6.9 million square feet) and East Hartford (2.8 million square feet), but larger when compared to East
Hampton (753,000 square feet) and South Windsor (1.4 million square feet). The Town of Glastonbury
also has a lower vacancy rate (5.6%) compared to Manchester (6.6%) and East Hartford (8.3%) but
higher compared to South Windsor (4.7%) and East Hampton/East Haddam (4.7%).
Exhibit 3.2 – Selected Regional Retail Market Overview (2010 1Q)
8,000,000 10%
7,000,000
8%
Total GLA (Square Feet)
6,000,000
5,000,000
Vacancy (%)
6%
4,000,000
3,000,000 4%
2,000,000
2%
1,000,000
0 0%
Total GLA Total % Vacant
Source: CoStar
BBP & Associates LLC 18Market Analysis Glastonbury Center 2020
Glastonbury Retail Market
The Town of Glastonbury comprises more than 1.6 million square feet of retail space, of which 756,000
square feet, or 46 percent, is located in the Town Center. 55% of the Town’s retail buildings are located in
the Town Center. The Town Center has a significantly higher vacancy rate (10.3 percent) compared to
other retail space outside of the Town Center (1.3 percent) and region (6.2 percent). Average lease rental
rates are lower in the Town Center ($19.27 per square foot) compared to other retail centers outside of
the Town Center ($21.45 per square foot) but are higher compared to the East market ($15.47 per square
foot) and region ($13.15 per square foot).
Exhibit 3.3 – Glastonbury Retail Market
1st Quarter 2010
Bldgs Existing SF Vacant SF Vacant % Rent
Town Center 73 756,721 77,863 10.30% $19.27
Other Town 61 871,549 12,547 1.44% $21.45
Town of Glastonbury 134 1,628,270 90,410 5.60% $20.49
st
Source: CoStar, Hartford Retail Market Report, 1 Quarter 2010
Exhibit 3.4 Glastonbury Retail Inventory
Square Feet of Space - 2010
Town
Other Town Center
54% 46%
Source: CoStar
The Town of Glastonbury’s retail inventory is mainly comprised of shopping center retail (community
centers, neighborhood centers and strip centers) and general retail (freestanding retail buildings, except
those contained within a center). Shopping centers account for 44 percent, or 723,000 square feet of
space and general retail facilities account for 47 percent, or 763,000 square feet of space. Power centers,
which typically consist of several freestanding anchors and only a minimum amount of small specialty
tenants, account for 9 percent, or 144,000 square feet of space in the Town.
In terms of building type, 84% of the retail centers in the Town of Glastonbury are classified as general
retail facilities. Vacancy rates are lowest among general retail (1.7 percent) and power centers (0 percent)
with shopping centers showing the highest vacancy rate (10.7 percent).
BBP & Associates LLC 19Market Analysis Glastonbury Center 2020
Exhibit 3.5 – Retail Inventory by Type
Town of Glastonbury
Existing Inventory Vacancy Rental Rate
# of Total GLA Total SF Total %
Bldgs Vacant Vacant
General Retail 112 763,477 13,110 1.70% $21.00
Power Center 1 141,416 0 0.00% $18.51
Shopping Center 21 723,377 77,300 10.70% $20.33
Total 134 1,628,270 90,410 5.60% $20.49
Source: CoStar, Hartford Retail Market Report, 1st Quarter 2010
Exhibit 3.6 - Retail Inventory by Type
Town of Glastonbury
Shopping General
Center Retail
44% 47%
Power
Center
9%
Source: CoStar
The most recent retail development activity in the Town includes Eric Town Square, a three-story, 85,000
square foot office/retail project located off of Hebron Avenue in the Town Center. This $13 million project,
completed in 2007, includes a variety of specialized retail offerings on the ground floor with Class A office
above, as well as, a 200-space underground parking garage.
In addition, a new 46,400 square foot Whole Foods supermarket that coincided with the rehab of The
Shoppes at Fox Run across from Eric Town Square has provided additional retail/grocery store product to
the local community. Other retail tenants in The Shoppes at Fox Run include a variety of personal
services (e.g. nail salon, hair salon, bank, eyeglass store, insurance agency), an electronics retailer, and
a restaurant.
The largest retail centers in the Town of Glastonbury are scattered within and around the Town Center
area along Main Street, Glastonbury Boulevard, Hebron Avenue and New London Turnpike. The largest
retail properties are primarily grocery-anchored shopping centers such as The Shoppes at Fox Run
(108,785 square feet), Putnam Bridge Shopping Center (97,169 square feet), and Super Stop and Shop
(62,900 square feet). The retail centers with the highest vacancies reported include The Shoppes at Fox
Run (26%), Glen Lochen (19.3%) and Glastonbury Commons (45%).
BBP & Associates LLC 20Market Analysis Glastonbury Center 2020
The largest non-grocery anchored shopping center in the Town is Somerset Square, a 80,400 square foot
lifestyle center located just north of Town Center off of Glastonbury Boulevard. The center has a number
of top national retailers such as Talbots, Ann Taylor, Chico’s, White House/Black Market, Coldwater
Creek, J. Jill, Victoria’s Secret and Smith & Hawken.
Exhibit 3.7 – Largest Selected Retail Properties – Town of Glastonbury
Largest Retail Properties
Town of Glastonbury
Name Existing Vacancy
SF
1 The Shoppes at Fox Run 108,785 26.3%
2 Home Depot/ Staples 97,169 0%
3 Somerset Square 80,391 6.8%
4 Glen Lochen 77,914 19.3%
5 Super Stop & Shop 62,900 0%
6 Super Stop & Shop 58,481 0%
7 Griswold Shoppes 56,469 8.3%
8 Glastonbury Commons 42,000 45.2%
9 Barnes & Noble 30,800 0%
10 Glastonbury Goodwill 25,974 0%
st
Source: CoStar, Hartford Retail Market Report, 1 Quarter 2010
BBP & Associates LLC 21Market Analysis Glastonbury Center 2020
3.3 Retail Development Potential
Demand for retail goods is primarily a function of the spending habits of nearby residents within a defined
market area. In addition, future new office employees, as well as, future new households in the Town
Center have been taken into consideration as additional sources of retail demand.
The Glastonbury Town Center currently captures a share of the expenditures from existing households;
however, the Town Center could capture a larger share with the introduction of new retail goods and
services. The Town Center would also benefit from new residential and office development in that the
new households and employees associated with such development would serve as a built-in customer
base for retail goods and services.
In order to determine the future square footage needed to support this demand and potential future
demand, the spending patterns of households and office employees have been analyzed. Expenditures
were then converted to supportable square feet using average sales foot data for different types of retail
goods (e.g. convenience and shoppers). This section describes the analysis of spending patterns and
potential square footage related to existing households, future new households, and future new office
employees.
Trade Area Definition
A trade area is the geographic area from which the preponderance of retail establishment’s customers
originates. Trade areas differ based on the type of products offered at the retail establishment. For
example, a trade area for a convenience good such as milk is typically smaller than the trade area for
shopper’s goods such as furniture or apparel. The distance a consumer will travel to buy a gallon of milk
is significantly shorter than the travel distance tolerated to buy a new sofa. Another factor affecting the
trade areas for convenience and shoppers goods is comparison shopping. To purchase a gallon of milk,
one does not need to compare brands or stores. To purchase a piece of furniture, consumers are willing
to travel further distances to compare various merchandise.
Trade areas are also impacted by competitive retail destinations. A shopping district with little nearby
competition will have a much larger trade area than a shopping district with significant regional shoppers
goods competition.
Defined as the geographic areas within which the majority of likely customers for new retail businesses in
the Glastonbury Town Center reside, two market areas for the Town Center have been identified.
• Convenience Goods Market Area – identified as the area within a 5-minute drive time from the
midpoint of the Town Center study area. This area is consistent with the typical trade area for a
neighborhood shopping center, which provides everyday convenience goods (foods, drugs, and
sundries) to meet the daily needs of residents in the immediate area.
• Shoppers Goods Market Area - identified as the East retail market, which as defined by CoStar
includes East Hartford, Manchester, South Windsor and Glastonbury. The East market is within a 15-
to 20-minute drive from the midpoint of the Town Center study area. This area is consistent with the
typical trade area for a regional shopping center, which provides general merchandise, apparel,
furniture, and home furnishings. The area is also based on discussions with local retail brokers and
retail center owners.
BBP & Associates LLC 22Market Analysis Glastonbury Center 2020
These trade areas are illustrated in the following maps.
Exhibit 3.8: Glastonbury Town Center Retail Market Areas
Convenience Goods Market Area Shoppers Goods Market Area
(5-Minute Driving Radius) (East market)
Source: ESRI Business Solutions
Source: ESRI Business Solutions
Convenience Goods Analysis
The convenience goods retail analysis evaluated at-place sales within the Glastonbury Town Center,
which is termed “supply,” and household expenditures in the Convenience Goods Market Area (CGMA, or
5-minute driving radius), called “demand”. This allowed an evaluation of any potential leakage that may
have occurred outside the Town Center (e.g. demand that was leaked as sales to retailers outside the
Town Center).
Convenience goods include:
• Groceries and specialty food items
• Beer, wine and liquor
• Health and personal care
• Flowers
• Office supplies, stationary and gifts
• Limited service restaurants
When comparing the Town Center sales to the CGMA expenditures, the CGMA expenditures (demand)
exceed sales (supply) in many convenience goods store groups, indicating sales in these categories are
being leaked to retailers outside the Town Center. The largest retail gap of $34 million was for groceries,
while the gap for beer, wine and liquor was nearly $1.6 million. Leakage also occurred in the categories
of specialty food and flowers. Such leakage indicates potential for increasing the supply of these types of
convenience goods within the Town Center to capture a portion of the sales that are currently being made
elsewhere.
BBP & Associates LLC 23Market Analysis Glastonbury Center 2020
Exhibit 3.9: Retail Gap – Select Convenience Retail Goods and Services (2010)
Glastonbury Town CGMA Demand Retail Leakage/ Capture
Center (Sales) (Expenditures) Surplus Rate
Grocery Stores $2,159,278 $37,036,380 ($34,877,102) 5.8%
Specialty Food Stores $313,588 $579,442 ($265,854) 54.1%
Beer, Wine and Liquor Stores $1,635,893 $3,225,361 ($1,589,468) 50.7%
Health and Personal Care Stores $9,829,055 $8,856,288 $972,767 111.0%
Florists $334,065 $371,291 ($37,226) 90.0%
Office Supplies, Stationary, and Gift Stores $900,519 $853,827 $46,692 105.5%
Limited Service Eating Places $14,604,051 $8,805,162 $5,798,889 165.9%
Total $29,776,449 $59,727,751 ($29,951,302) 49.9%
Source: ESRI Business Solutions, 2010
The growth or decline in households and household income within a particular area provides an estimate
on future demand. With households in the CGMA projected to grow at 0.08 percent annually, and
household income in the CGMA expected to grow at 2.77 percent annually, CGMA household
expenditures (demand) will increase by approximately $9 million between 2010 to 2015, from $59.7
million to $68.7 million between 2010 and 2015. Expenditures would then grow approximately $10 million
from 2015 to 2020, from $68.7 million to $79.1 million.
Exhibit 3.10: CGMA Household Expenditures (Demand), 2010-2020
CGMA Household Expenditures (Demand)
2010 (1/) 2015 (2/) 2020 (2/)
Grocery Stores $37,036,380 $42,630,791 $49,070,248
Specialty Food Stores $579,442 $666,968 $767,714
Beer, Wine and Liquor Stores $3,225,361 $3,712,558 $4,273,346
Health and Personal Care Stores $8,856,288 $10,194,046 $11,733,875
Florists $371,291 $427,375 $491,931
Office Supplies, Stationary, and Gift Stores $853,827 $982,799 $1,131,253
Limited Service Eating Places $8,805,162 $10,135,197 $11,666,137
Total/Average $59,727,751 $68,749,734 $79,134,504
Source: ESRI Business Solutions, 2010
1/ ESRI Business Solutions, 2010
2/ ESRI Business Solutions - based on CAGR of 2.77 percent between 2010 to 2015 of CGMA
household income, and CAGR of 0.08 percent between 2010 to 2015 of CGMA households
BBP & Associates LLC 24Market Analysis Glastonbury Center 2020
The analysis of potential convenience goods retail development and expansion includes low- and high-
case market scenarios for the next five years (2010 to 2015) and following five years (2015 to 2020).
• Low-case market scenario – represents existing capture rates of CGMA expenditures
• High-case market scenario – represents a 20 percent increase over 2010 capture rates, taking
into account strong market conditions and ability of the study areas to capture a larger share of
demand from the trade area.
Contingent upon future market conditions, the Glastonbury Town Center could capture between 49.9 to
59.8 percent of the unmet demand of residents within the convenience goods market area (CGMA).
Exhibit 3.11: Glastonbury Town Center Sales (Supply) vs. CGMA Household Expenditures (Demand) –
Capture Rates (2010-2020)
2015 Capture Rate 2020 Capture Rate
2010 Capture Low (2/) High (3/) Low (2/) High (3/)
Rate (1/)
Grocery Stores 5.8% 5.8% 7.0% 5.8% 7.0%
Specialty Food Stores 54.1% 54.1% 64.9% 54.1% 64.9%
Beer, Wine and Liquor Stores 50.7% 50.7% 60.9% 50.7% 60.9%
Health and Personal Care Stores 111.0% 111.0% 133.2% 111.0% 133.2%
Florists 90.0% 90.0% 108.0% 90.0% 108.0%
Office Supplies, Stationary, and Gift Stores 105.5% 105.5% 126.6% 105.5% 126.6%
Limited Service Eating Places 165.9% 165.9% 199.0% 165.9% 199.0%
Total 49.9% 49.9% 59.8% 49.9% 59.8%
1/ 2010 Glastonbury Town Center Sales / 2010 CGMA Household Expenditures
2/ Low market scenario - maintenance of 2010 capture rate
3/ High market scenario - 20% increase over 2010 capture rate
BBP & Associates LLC 25Market Analysis Glastonbury Center 2020
By applying the low-case and high-case capture rates to the projected 2015 CGMA Household
Expenditures (Demand), total 2015 Glastonbury Town Center sales can be estimated. With projections of
the Town Center capturing between 49.9 to 59.8 percent of the $68.7 million dollars in CGMA
convenience goods demand in 2015, total sales in 2015 in the Town Center are estimated to range
between $34 to over $41 million dollars.
Exhibit 3.12: Total Glastonbury Town Center Sales (Supply) - 2015
2015 Capture Rate 2015 Total Town Center Sales
(Supply) (1/)
2015 CGMA Household Low High Low High
Expenditures (Demand)
Grocery Stores $42,630,791 5.8% 7.0% $2,485,441 $2,982,529
Specialty Food Stores $666,968 54.1% 64.9% $360,956 $433,147
Beer, Wine and Liquor Stores $3,712,558 50.7% 60.9% $1,882,998 $2,259,597
Health and Personal Care Stores $10,194,046 111.0% 133.2% $11,313,751 $13,576,502
Florists $427,375 90.0% 108.0% $384,526 $461,431
Office Supplies, Stationary, and Gift Stores $982,799 105.5% 126.6% $1,036,544 $1,243,853
Limited Service Eating Places $10,135,197 165.9% 199.0% $16,810,019 $20,172,023
Total $68,749,734 49.9% 59.8% $34,274,235 $41,129,082
1/ 2015 CGMA Household Expenditures (Demand) x 2015 Capture Rate
Using the same method of projecting sales for 2020, a low-case market scenario of over $39 million is
projected, and a high-case market scenario of over $47 million is projected. These sales figures are
based on 2020 capture rates ranging from 49.9 to 59.8 percent and projected 2020 expenditures of $79.1
million in the CGMA.
Exhibit 3.13: Total Glastonbury Town Center Sales (Supply) - 2020
2020 Capture Rate 2020 Total Town Center Sales
(Supply) (1/)
2020 CGMA Household Low High Low High
Expenditures (Demand)
Grocery Stores $49,070,248 5.8% 7.0% $2,860,871 $3,433,045
Specialty Food Stores $767,714 54.1% 64.9% $415,479 $498,575
Beer, Wine and Liquor Stores $4,273,346 50.7% 60.9% $2,167,428 $2,600,913
Health and Personal Care Stores $11,733,875 111.0% 133.2% $13,022,714 $15,627,256
Florists $491,931 90.0% 108.0% $442,609 $531,131
Office Supplies, Stationary, and Gift Stores $1,131,253 105.5% 126.6% $1,193,116 $1,431,739
Limited Service Eating Places $11,666,137 165.9% 199.0% $19,349,202 $23,219,043
Total $79,134,504 49.9% 59.8% $39,451,419 $47,341,703
1/ 2020 CGMA Household Expenditures (Demand) x 2020 Capture Rate
BBP & Associates LLC 26Market Analysis Glastonbury Center 2020
To determine the net change in sales between 2010 and 2015, we subtract the 2010 sales from the
projected 2015 projected sales (supply) to obtain a range of net new sales by 2015. In 2015, the Town
Center could capture between $4.5 and $11.4 million in new sales. These sales can then be converted to
estimated square feet demanded by applying sales per square foot figures, as based on national data
from the Urban Land Institute. Applying such sales per square foot figures results in a projected range of
over 15,000 to nearly 39,000 square feet of new convenience retail space demanded from 2010 to 2015.
Exhibit 3.14: Potential Convenience Goods Retail Opportunities in SF (2010-2015)
2015 New Town Center Sales Total Opportunities in
(Supply) SF
2010 Town Low High Estimated Low High
Center Sales Sales/PSF (1/)
(Supply)
Grocery Stores $2,159,278 $326,163 $823,251 $473 690 1,740
Specialty Food Stores $313,588 $47,368 $119,559 $151 314 792
Beer, Wine and Liquor Stores $1,635,893 $247,105 $623,704 $396 624 1,575
Health and Personal Care Stores $9,829,055 $1,484,696 $3,747,447 $430 3,453 8,715
Florists $334,065 $50,461 $127,366 $226 223 564
Office Supplies, Stationary, and Gift Stores $900,519 $136,025 $343,334 $120 1,134 2,861
Limited Service Eating Places $14,604,051 $2,205,968 $5,567,972 $246 8,967 22,634
Total/Average $29,776,449 $4,497,786 $11,352,633 $292 15,404 38,881
1/ Urban Land Institute - Median Sales/PSF for respective store group categories
The same method of analysis was used to project net new sales in the Town Center in 2020. Subtracting
the 2010 sales from the projected 2020 sales results in $9.6 to over $17.5 million in new sales. After
applying sales per square foot figures to these sales, we project total opportunities over the 2010 to 2020
time period of 33,000 to 60,000 square feet of convenience retail space (which includes the new space
that could be added from 2010 to 2015). The net opportunities in square feet from 2015 to 2020 are
nearly 18,000 to over 21,000 square feet of convenience retail space.
Exhibit 3.15: Potential Convenience Goods Retail Opportunities in SF (2010-2020)
2020 New Town Center Total Opportunities Net Opportunities in
Sales (Supply) in SF (2010-2020) SF (2015-2020)
2010 Town Low High Estimated Low High Low High
Center Sales Sales/PSF
(Supply) (1/)
Grocery Stores $2,159,278 $701,593 $1,273,767 $473 1,483 2,693 794 952
Specialty Food Stores $313,588 $101,891 $184,987 $151 675 1,225 361 433
Beer, Wine and Liquor Stores $1,635,893 $531,535 $965,020 $396 1,342 2,437 718 862
Health and Personal Care Stores $9,829,055 $3,193,659 $5,798,201 $430 7,427 13,484 3,974 4,769
Florists $334,065 $108,544 $197,066 $226 480 872 257 308
Office Supplies, Stationary, and Gift Stores $900,519 $292,597 $531,220 $120 2,438 4,427 1,305 1,566
Limited Service Eating Places $14,604,051 $4,745,151 $8,614,992 $246 19,289 35,020 10,322 12,386
Total/Average $29,776,449 $9,674,970 $17,565,254 $292 33,135 60,158 17,731 21,277
1/ Urban Land Institute - Median Sales/PSF for respective store group categories
BBP & Associates LLC 27Market Analysis Glastonbury Center 2020
Shoppers Goods Analysis
The shoppers goods retail analysis compared at-place sales within the Glastonbury Town Center (supply)
to expenditures made by households (demand) in the Shoppers Goods Market Area (SGMA, or East
market). Such comparison allowed for the identification of expenditures that were leaked outside the
Town Center.
Shopper’s goods include:
• Auto parts, accessories and tires
• Furniture
• Home furnishings
• Electronics and appliances
• Building material and supplies
• Lawn and garden equipment
• Clothing
• Shoes
• Jewelry, luggage and leather goods
• Sporting goods, hobbies, and musical
instruments
• Books, periodicals and music
• Department stores
• General merchandise
• Used merchandise
• Miscellaneous stores
• Full-service restaurants
BBP & Associates LLC 28Market Analysis Glastonbury Center 2020
For shoppers goods, leakage is occurring in every retail category, and the Town Center is capturing a low
share of the overall demand for shoppers goods. Sales leakage is highest in the following categories:
full-service restaurants ($187 million); department stores ($98 million); clothing ($69 million); building
materials and supplies ($69 million); and general merchandise ($68 million).
Exhibit 3.16: Retail Gap – Select Shoppers Retail Goods and Services (2010)
Glastonbury Town SGMA Demand Retail Leakage/ Capture
Center (Sales) (Expenditures) Surplus Rate
Auto Parts, Accessories and Tire Stores $214,599 $29,087,655 ($28,873,056) 0.7%
Furniture Stores $1,141,629 $47,196,432 ($46,054,803) 2.4%
Home Furnishings Stores $919,683 $28,067,923 ($27,148,240) 3.3%
Electronics and Appliance Stores $6,820,946 $54,526,517 ($47,705,571) 12.5%
Building Materials and Supplies $11,685,407 $80,926,140 ($69,240,733) 14.4%
Lawn and Garden Supplies $181,172 $2,525,254 ($2,344,082) 7.2%
Clothing $5,926,517 $75,706,424 ($69,779,907) 7.8%
Shoes $0 $8,244,594 ($8,244,594) 0.0%
Jewelry, Luggage and Leather Goods $2,219,736 $14,071,252 ($11,851,516) 15.8%
Sporting Goods, Hobbies and Musical Instruments $1,311,561 $14,540,315 ($13,228,754) 9.0%
Books, Periodicals and Music $2,041,631 $10,622,533 ($8,580,902) 19.2%
Department Stores $0 $98,294,737 ($98,294,737) 0.0%
General Merchandise $1,042,099 $70,027,994 ($68,985,895) 1.5%
Used Merchandise $957,197 $1,214,860 ($257,663) 78.8%
Miscellaneous Stores $280,787 $16,721,415 ($16,440,628) 1.7%
Full-Service Restaurants $14,732,183 $202,138,803 ($187,406,620) 7.3%
Total $49,475,147 $753,912,848 ($704,437,701) 6.6%
Source: ESRI Business Solutions, 2010
BBP & Associates LLC 29Market Analysis Glastonbury Center 2020
The growth of households and household income in the SGMA will impact opportunities for retail growth
in the Town Center. The annual growth rate for household income in the SGMA is projected to be 2.63
percent from 2010 to 2015, and the annual growth rate for households, 0.21 percent. Assuming these
growth rates are realized and continue through 2020, SGMA household expenditures (demand) will
increase to nearly $870 million in 2015 and nearly $990 million in 2020.
Exhibit 3.17: SGMA Household Expenditures (Demand), 2010-2020
SGMA Household Expenditures (Demand)
2010 (1/) 2015 (2/) 2020 (2/)
Auto Parts, Accessories and Tire Stores $29,087,655 $33,466,189 $38,100,885
Furniture Stores $47,196,432 $54,300,861 $61,820,929
Home Furnishings Stores $28,067,923 $32,292,958 $36,765,175
Electronics and Appliance Stores $54,526,517 $62,734,336 $71,422,346
Building Materials and Supplies $80,926,140 $93,107,866 $106,002,274
Lawn and Garden Supplies $2,525,254 $2,905,378 $3,307,740
Clothing $75,706,424 $87,102,432 $99,165,154
Shoes $8,244,594 $9,485,644 $10,799,301
Jewelry, Luggage and Leather Goods $14,071,252 $16,189,383 $18,431,433
Sporting Goods, Hobbies and Musical Instruments $14,540,315 $16,729,053 $19,045,842
Books, Periodicals and Music $10,622,533 $12,221,532 $13,914,078
Department Stores $98,294,737 $113,090,940 $128,752,782
General Merchandise $70,027,994 $80,569,234 $91,727,180
Used Merchandise $1,214,860 $1,397,732 $1,591,302
Miscellaneous Stores $16,721,415 $19,238,472 $21,902,787
Full-Service Restaurants $202,138,803 $232,566,543 $264,774,433
Total/Average $753,912,848 $867,398,550 $987,523,641
Source: ESRI Business Solutions, 2010
1/ ESRI Business Solutions, 2010
2/ ESRI Business Solutions - based on CAGR of 2.63 percent between 2010 to 2015 of SGMA household
income, and CAGR of 0.21 percent between 2010 to 2015 of SGMA households
BBP & Associates LLC 30Market Analysis Glastonbury Center 2020
We have identified low- and high- case market scenarios to frame the analysis of opportunities for
shoppers goods development in the Town Center for the next five years (2010 to 2015) and following five
years (2015 to 2020). We have applied the same assumptions used in framing the convenience goods
analysis:
• Low-case market scenario – represents existing capture rates of SGMA expenditures
• High-case market scenario – represents a 20 percent increase over 2010 capture rates, taking
into account strong market conditions and ability of the study areas to capture a larger share of
demand from the trade area.
Depending upon future market conditions, the Glastonbury Town Center could capture between 6.6 to 7.9
percent of the unmet demand of residents within the shoppers goods market area (SGMA).
Exhibit 3.18: Glastonbury Town Center Sales (Supply) vs. SGMA Household Expenditures (Demand) –
Capture Rates (2010-2020)
2015 Capture Rate 2020 Capture Rate
2010 Capture Low (2/) High (3/) Low (2/) High (3/)
Rate (1/)
Auto Parts, Accessories and Tire Stores 0.7% 0.7% 0.9% 0.7% 0.9%
Furniture Stores 2.4% 2.4% 2.9% 2.4% 2.9%
Home Furnishings Stores 3.3% 3.3% 3.9% 3.3% 3.9%
Electronics and Appliance Stores 12.5% 12.5% 15.0% 12.5% 15.0%
Building Materials and Supplies 14.4% 14.4% 17.3% 14.4% 17.3%
Lawn and Garden Supplies 7.2% 7.2% 8.6% 7.2% 8.6%
Clothing 7.8% 7.8% 9.4% 7.8% 9.4%
Shoes 0.0% 0.0% 0.0% 0.0% 0.0%
Jewelry, Luggage and Leather Goods 15.8% 15.8% 18.9% 15.8% 18.9%
Sporting Goods, Hobbies and Musical Instruments 9.0% 9.0% 10.8% 9.0% 10.8%
Books, Periodicals and Music 19.2% 19.2% 23.1% 19.2% 23.1%
Department Stores 0.0% 0.0% 0.0% 0.0% 0.0%
General Merchandise 1.5% 1.5% 1.8% 1.5% 1.8%
Used Merchandise 78.8% 78.8% 94.5% 78.8% 94.5%
Miscellaneous Stores 1.7% 1.7% 2.0% 1.7% 2.0%
Full-Service Restaurants 7.3% 7.3% 8.7% 7.3% 8.7%
Total 6.6% 6.6% 7.9% 6.6% 7.9%
1/ 2010 Glastonbury Town Center Sales / 2010 SGMA Household Expenditures
2/ Low market scenario - maintenance of 2010 capture rate
3/ High market scenario - 20% increase over 2010 capture rate
BBP & Associates LLC 31Market Analysis Glastonbury Center 2020
Applying these low-case and high-case capture rates to the projected 2015 and 2020 SGMA household
expenditures (demand) results in estimates of total Town Center sales in 2015 and 2020. In 2015, the
Town Center could capture 6.6 to 7.9% of the nearly $870 million in demand presented by SGMA
households in that year. This capture would result in nearly $57 to over $68 million in Town Center sales.
Exhibit 3.19: Total Glastonbury Town Center Sales (Supply) - 2015
2015 Capture Rate 2015 Total Town Center
Sales (Supply) (1/)
2015 SGMA Household Low High Low High
Expenditures (Demand)
Auto Parts, Accessories and Tire Stores $33,466,189 0.7% 0.9% $246,902 $296,283
Furniture Stores $54,300,861 2.4% 2.9% $1,313,477 $1,576,173
Home Furnishings Stores $32,292,958 3.3% 3.9% $1,058,122 $1,269,746
Electronics and Appliance Stores $62,734,336 12.5% 15.0% $7,847,696 $9,417,235
Building Materials and Supplies $93,107,866 14.4% 17.3% $13,444,399 $16,133,279
Lawn and Garden Supplies $2,905,378 7.2% 8.6% $208,444 $250,132
Clothing $87,102,432 7.8% 9.4% $6,818,629 $8,182,355
Shoes $9,485,644 0.0% 0.0% $0 $0
Jewelry, Luggage and Leather Goods $16,189,383 15.8% 18.9% $2,553,871 $3,064,645
Sporting Goods, Hobbies and Musical Instruments $16,729,053 9.0% 10.8% $1,508,989 $1,810,787
Books, Periodicals and Music $12,221,532 19.2% 23.1% $2,348,956 $2,818,747
Department Stores $113,090,940 0.0% 0.0% $0 $0
General Merchandise $80,569,234 1.5% 1.8% $1,198,965 $1,438,758
Used Merchandise $1,397,732 78.8% 94.5% $1,101,283 $1,321,539
Miscellaneous Stores $19,238,472 1.7% 2.0% $323,054 $387,664
Full-Service Restaurants $232,566,543 7.3% 8.7% $16,949,803 $20,339,763
Total $867,398,550 6.6% 7.9% $56,922,588 $68,307,106
1/ 2015 SGMA Household Expenditures (Demand) x 2015 Capture Rate
BBP & Associates LLC 32You can also read