Genomic prediction of strawberry resistance to postharvest fruit decay caused by the fungal pathogen Botrytis cinerea
←
→
Page content transcription
If your browser does not render page correctly, please read the page content below

2
                                                                                                                                  G3, 2022, 12(1), jkab378
                                                                                                                 https://doi.org/10.1093/g3journal/jkab378
                                                                                                        Advance Access Publication Date: 13 November 2021
                                                                                                                                             Investigation

Genomic prediction of strawberry resistance to
postharvest fruit decay caused by the fungal pathogen
Botrytis cinerea
Stefan Petrasch, Saskia D. Mesquida-Pesci, Dominique D. A. Pincot     , Mitchell J. Feldmann    , Cindy M. López,

                                                                                                                                                               Downloaded from https://academic.oup.com/g3journal/article/12/1/jkab378/6427547 by guest on 10 January 2022
Randi Famula      , Michael A. Hardigan, Glenn S. Cole, Steven J. Knapp    *, and Barbara Blanco-Ulate    *

Department of Plant Sciences, University of California, Davis, Davis, CA 95616, USA

*Corresponding author: Department of Plant Sciences, University of California, Davis, One Shields Avenue, Davis, CA 95616, USA.
 Email: sjknapp@ucdavis.edu (S.J.K.); bblanco@ucdavis.edu (B.B.U.)

Abstract
Gray mold, a disease of strawberry (Fragaria  ananassa) caused by the ubiquitous necrotroph Botrytis cinerea, renders fruit unmarketable
and causes economic losses in the postharvest supply chain. To explore the feasibility of selecting for increased resistance to gray mold,
we undertook genetic and genomic prediction studies in strawberry populations segregating for fruit quality and shelf life traits hypothe-
sized to pleiotropically affect susceptibility. As predicted, resistance to gray mold was heritable but quantitative and genetically complex.
While every individual was susceptible, the speed of symptom progression and severity differed. Narrow-sense heritability ranged from
0.38 to 0.71 for lesion diameter (LD) and 0.39 to 0.44 for speed of emergence of external mycelium (EM). Even though significant additive
genetic variation was observed for LD and EM, the phenotypic ranges were comparatively narrow and genome-wide analyses did not iden-
tify any large-effect loci. Genomic selection (GS) accuracy ranged from 0.28 to 0.59 for LD and 0.37 to 0.47 for EM. Additive genetic corre-
lations between fruit quality and gray mold resistance traits were consistent with prevailing hypotheses: LD decreased as titratable acidity
increased, whereas EM increased as soluble solid content decreased and firmness increased. We concluded that phenotypic and GS could
be effective for reducing LD and increasing EM, especially in long shelf life populations, but that a significant fraction of the genetic varia-
tion for resistance to gray mold was caused by the pleiotropic effects of fruit quality traits that differ among market and shelf life classes.

Keywords: Fragaria  ananassa; Botrytis cinerea; breeding; necrotroph; genome-wide association study; disease resistance;
whole-genome regression

Introduction
The fleshy fruits produced by strawberry (Fragaria  ananassa), to-                   Consequently, genetic variation for resistance to gray mold tends to
mato (Solanum lycopersicum), and many other horticulturally impor-                    be subtle, limited, and quantitative, which undoubtedly underlies
tant plants are susceptible to postharvest decay by gray mold, a                      the paucity of studies on breeding for resistance to this pathogen
devastating disease caused by the necrotrophic fungal pathogen                        (Finkers et al. 2007a; Williamson et al. 2007; Rowe and Kliebenstein
Botrytis cinerea (Jarvis 1962; van Baarlen et al. 2007; Williamson et al.             2008; Lorang 2019; Zhang et al. 2019; Caseys et al. 2021).
2007; Dean et al. 2012; Elad et al. 2016; Petrasch et al. 2019a). Botrytis               Because natural genetic resistance has been insufficient to
cinerea can infect most organs of the plant but is especially destruc-                prevent postharvest gray mold disease development, preharvest
tive on ripe fruit and senescent tissues of dicotyledonous hosts                      fungicides are often applied to suppress pathogen growth and
(Jarvis 1962; Dewey and Grant-Downton 2016). Gray mold renders                        minimize postharvest losses (Legard et al. 1997, 2005; Leroux
strawberries unmarketable and often causes significant postharvest                    2007; Elad et al. 2016; Cosseboom et al. 2019). Controlling B. cinerea
losses under conditions favorable for pathogen growth (Barritt 1980;                  with fungicides is difficult because the airborne inoculum is pre-
Ries 1995; Dean et al. 2012; Petrasch et al. 2019a). The mechanisms                   sent year round, the host–pathogen interactions are complicated,
of defense against B. cinerea are physiologically and genetically com-                and the pathogen rapidly evolves resistance to fungicides, partic-
plex and markedly differ from the gene-for-gene resistance and pro-                   ularly after repeated applications of specific chemicals (Jarvis
grammed cell death mechanisms commonly triggered by                                   1962; Leroux 2007; Williamson et al. 2007; Cosseboom et al. 2019;
biotrophic pathogens (Elad and Evensen 1995; Glazebrook 2005;                         Zhang et al. 2019; Caseys et al. 2021). Moreover, preharvest foliar
Lorang 2019; Caseys et al. 2021). As with other necrotrophic patho-                   applications of fungicides have not been shown to be effective for
gens, B. cinerea pathogenesis is promoted by fruit ripening and host                  reducing postharvest gray mold incidence in strawberry fruit pos-
cell death (Elad and Evensen 1995; Elad et al. 2016; Lorang 2019).                    sibly because many fruit infections arise from contaminated

Received: June 07, 2021. Accepted: October 08, 2021
C The Author(s) 2021. Published by Oxford University Press on behalf of Genetics Society of America.
V
This is an Open Access article distributed under the terms of the Creative Commons Attribution License (https://creativecommons.org/licenses/by/4.0/), which
permits unrestricted reuse, distribution, and reproduction in any medium, provided the original work is properly cited.
2   |   G3, 2022, Vol. 12, No. 1

flower tissues (van Kan 2006; van Baarlen et al. 2007; Williamson          and achieve genetic gains (Heffner et al. 2010; Jannink et al. 2010;
et al. 2007; Veloso and van Kan 2018; Petrasch et al. 2019a).              Lin et al. 2014; VanRaden 2020). The training populations for our
    The development of gray mold resistant cultivars has been              studies were developed from crosses between firm-fruited long
challenging in strawberry and other hosts because most geno-               shelf life (LSL) cultivars and soft-fruited short shelf life (SSL) culti-
types are highly susceptible, strong sources of natural genetic re-        vars. Although the gray mold resistance phenotypes of the
sistance have not been identified, and resistance mechanisms               parents of these populations were unknown, our hypothesis was
are quantitative (Barritt 1980; van Kan 2006; Finkers et al. 2007a,        that selection for extended shelf life has pleiotropically increased
2007b, 2008; Williamson et al. 2007; Seijo et al. 2008; Lewers et al.      resistance to gray mold in strawberry, primarily because fruit of
2012; Petrasch et al. 2019a; Zhang et al. 2019; Caseys et al. 2021).       LSL cultivars deteriorate more slowly in postharvest storage than
The feasibility of selecting for increased resistance to gray mold         those of SSL cultivars. We describe a highly repeatable artificial
has not been deeply explored in strawberry, a species where lim-           inoculation protocol for gray mold resistance phenotyping devel-
ited studies have been undertaken to shed light on the genetics of         oped for the GS studies described herein. Finally, we discuss the
resistance and assess genetic variation for resistance (Barritt            prospects for increasing genetic gains for resistance to gray mold

                                                                                                                                                       Downloaded from https://academic.oup.com/g3journal/article/12/1/jkab378/6427547 by guest on 10 January 2022
1980; Seijo et al. 2008; Lewers et al. 2012). The problem of breeding      through the application of genomic prediction approaches.
for resistance to gray mold has been most extensively studied in
tomato, albeit without achieving robust or foolproof solutions
(Finkers et al. 2007a, 2007b, 2008). Genetic studies in tomato and
                                                                           Materials and methods
Arabidopsis leaves have identified multiple small-effect quanti-           Plant materials and study design: shelf life
tative trait loci (QTL) that only account for a small fraction of the      assessment of modern LSL cultivars
genetic variation for resistance, seldom translate across genetic          Shelf life studies were conducted with fruit harvested from five
backgrounds, and have not solved the problem of breeding for re-           day-neutral cultivars (“UCD Royal Royce,” “UCD Valiant,” “UCD
sistance to gray mold (Finkers et al. 2007a, 2007b, 2008; Rowe and         Moxie,” “Cabrillo,” and “Monterey”) and three “summer-plant”
Kliebenstein 2008). Although genetic studies of similar depth and          (“UCD Finn,” “UCD Mojo,” and “Portola”) cultivars (the “UCD” pre-
breadth have not been undertaken in strawberry, previous stud-             fixes are hereafter dropped from the cultivar names) grown on
ies have not uncovered strong sources of resistance to gray mold           organic and conventional farms using the standard production
(Barritt 1980; Bestfleisch et al. 2015; Seijo et al. 2008; Lewers et al.   practices of commercial growers in coastal California. The day-
2012).                                                                     neutral cultivars were grown in 20-plant plots on three commer-
    We suspected that selection for increased fruit firmness and           cial farms, one organic and two conventional, in Santa Maria and
other fruit quality traits that extend shelf life pleiotropically in-      Prunedale, California in 2017–2018 with harvests for postharvest
creased resistance (decreased susceptibility) to gray mold in              studies on June 22 and 27, July 30, and August 1, 2018, July 30,
strawberry. While hypotheses can be formulated from insights               2018. The summer-plant cultivars were grown in 20-plant plots
gained from genetic studies in tomato and other hosts (Blanco-             on three commercial farms, one organic and two conventional, in
Ulate et al. 2016a, 2016b; Petrasch et al. 2019b; Zhang et al. 2019;       Oxnard and Santa Maria, CA in 2018–2019 with harvests for post-
Caseys et al. 2021), natural genetic resistance appears to be negli-       harvest studies on September 27 and 30, November 1 and 18, and
gible and quantitative and additive genetic correlations between           December 4, 2019.
gray mold resistance and fruit quality phenotypes are unknown                 To assess shelf life and estimate gray mold incidence, fruit
in strawberry (Jarvis 1962; Rhainds et al. 2002; Chandler et al.           was harvested on two dates at each location and stored in a dark
2006; Seijo et al. 2008; González et al. 2009; Lewers et al. 2012;        walk-in cooler maintained at approximately 4 C and 90–95% rela-
González et al. 2013; Bestfleisch et al. 2015; Petrasch et al. 2019a).    tive humidity for 21 days postharvest (dph). Harvest dates were
The susceptibility of strawberry fruit to B. cinerea increases during      June 22 and 27, July 30, and August 1, 2018, for day-neutral culti-
ripening (Jarvis 1962), which suggests that susceptibility factors         vars and September 27 and 30, November 1, 18, and 21, and
accumulate independent of defense mechanisms during fruit                  December 4, 2019, for summer-plant cultivars. Two 0.45 kg sam-
maturation and senescence, as is typical for this necrotroph               ples of fruit were collected at each harvest and placed in
(Williamson et al. 2007; Zhang et al. 2019; Caseys et al. 2021; Silva      18.4 cm  12.1 cm  6.2 cm vented plastic clamshells, one of
et al. 2021). Changes in fruit firmness and other fruit quality traits     which was stored undisturbed for visual phenotyping and an-
associated with fruit maturation and ripening in tomato have               other of which was used for destructive fruit quality trait meas-
been shown to increase susceptibility to B. cinerea (Blanco-Ulate          urements at three time points for summer-plant experiment (0,
et al. 2016a, 2016b; Silva et al. 2021). Although previous studies         7, and 14 dph) and four time points for the day-neutral experi-
have been somewhat inconclusive in strawberry, firm-fruited                ment (0, 7, 14, and 21 dph). Soluble solid content (SSC;  Brix), fruit
cultivars are predicted to be more resistant to B. cinerea than soft-      firmness (g-force), fruit weight (g/fruit), fungal decay incidence
fruited cultivars (Gooding 1976; Barritt 1980). Moreover, ripening-        (% of clamshell), and marketability were recorded at each time
induced differences in proanthocyanidin and anthocyanin accu-              point. The latter was visually scored on a 1–5 scale, where
mulation have been predicted to affect B. cinerea resistance in to-        1 ¼ very good, 2 ¼ good, 3 ¼ fair, 4 ¼ poor, and 5 ¼ very poor
mato and strawberry (Jersch et al. 1989; Zhang et al. 2013;                (Mitcham et al. 1996; do Nascimento Nunes 2015). Four fruit were
Bassolino et al. 2013).                                                    randomly selected from each clamshell at each time point for
    To more deeply explore the genetics of resistance to gray mold         fruit firmness and SSC measurements. Firmness was measured
and assess the feasibility of applying genomic selection (GS) for          using a handheld penetrometer (QA Supplies Model FT02) with a
increased resistance to gray mold in strawberry, we developed              3 mm probe. SSC ( Brix) was measured in the juice of macerated
and studied training populations segregating for fruit quality             fruit with a digital handheld refractometer (Atago Model PAL-1).
traits predicted to affect shelf life. Genomic prediction                  Statistical analyses of these experiments were separately per-
approaches are particularly attractive for postharvest traits that         formed using the R package lme4 (Bates et al. 2015) with cultivar
are difficult and costly to phenotype in strawberry but still re-          as a fixed effect and with location and cultivar  location interac-
quire sufficient accuracy to complement phenotypic selection               tion as random effects. Estimated marginal means (EMMs) and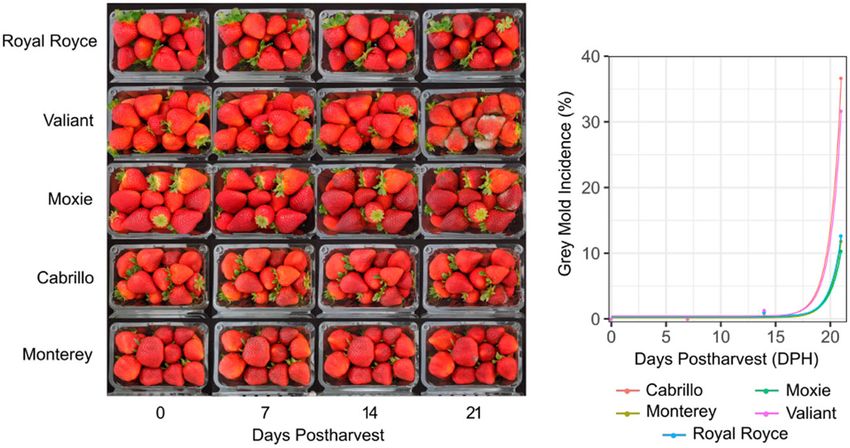
S. Petrasch et al.   |   3

linear contrasts between cultivar EMMs were estimated using the       Gray mold resistance phenotyping
R package emmeans (Lenth 2021).                                       We developed a high-throughput protocol for postharvest pheno-
                                                                      typing of B. cinerea disease progression and symptom develop-
Plant materials and study design: genetics of gray                    ment on ripe fruit. Spore suspensions of the B. cinerea strain
mold resistance                                                       B05.10 (Büttner et al. 1994; Quidde et al. 1998) were produced from
Seeds of five F.  ananassa full-sib families were harvested from     spores grown on potato dextrose agar as described by Petrasch
crosses produced in a greenhouse at UC Davis in the winter of         et al. (2019b). Uniformly ripe fruit were harvested at sunrise,
2018: Royal Royce  Primella (PI551422), Royal Royce  Madame         avoiding fruit that were under- or over-ripe. The fruit were imme-
Moutot (PI551632), Royal Royce  Tangi (PI551481), Royal Royce       diately transferred to cold storage (2.5 C) and inoculated the day
Earlimiss (PI551862), and 05C197P002  16C108P065. These fami-        of harvest. Several incubation temperatures (2.5 C, 5.0 C, 10.0 C,
lies constituted the multifamily training population developed        and 20.0 C) were tested to identify the optimum temperature for
for genomic prediction and other analyses. Seeds were scarified       B. cinerea growth and development with a minimum of contami-

                                                                                                                                                 Downloaded from https://academic.oup.com/g3journal/article/12/1/jkab378/6427547 by guest on 10 January 2022
and germinated the week of June 18–22, 2018. Seedlings were           nation from other postharvest decay pathogens. Fruit were
established and grown in a greenhouse until they were trans-          placed on 30-cell plastic egg hatching trays with dimensions of
planted to the field on October 5, 2018, at the UC Davis Wolfskill    29 cm  29 cm and 4.5 cm  4.5 cm cells. The fruit were punc-
Experiment Orchard (WEO), Winters, CA, USA. The field site was        tured once near the center with a 3 mm sterile pipette tip to an
prepared with a disk-harrow and ring-roller and smoothed with a       approximate depth of 1–2 mm. Ten ll of the B. cinerea conidia sus-
spring-tooth harrow. The soil was fumigated on May 14, 2018,          pension (500 conidia/ll) was placed on the surface of the punc-
                 RV
with Pic-Clor 60 (1, 3-dichloropropene 39% and chloropicrin           ture. The inoculated fruit were incubated in a growth chamber at
59.6%; Cardinal Professional Products, Woodland, CA, USA) at a        10 C and 95% humidity for 14 days. Disease symptoms were
rate of 474.7 kg/ha. Subsequent to fumigation, planting beds were     assessed daily after inoculation by manually measuring lesion di-
mechanically shaped to a height of 30.5 cm, width of 50.8 cm,         ameter (LD) and determining the number of days until external
base of 121.9 cm with center-to-center spacing of 152.4 cm be-        mycelium (EM; white or gray hyphae) was evident on the surface
tween beds, and a furrow width of 30.5 cm. Seedlings were trans-      of the fruit near the wound site. Fruit were phenotyped until my-
planted to planting beds on October 15, 2018, in a single-centered    celia covered the entire surface of the fruit. Spoiled fruit with
row with 55.9 cm between plants within the row. The number of         infections outside of the inoculation site or caused by decay
individuals that produced sufficient fruit for the postharvest        organisms other than B. cinerea were removed from the experi-
study of resistance to gray mold were n ¼ 86 for Royal Royce         ment. Genome-wide association study (GWAS), QTL mapping,
Primella, n ¼ 82 for Royal Royce  Madame Moutot, n ¼ 78 for          and GS analyses were applied to LD at 8 days postinoculation
Royal Royce  Tangi, n ¼ 92 for Royal Royce  Earlimiss, and          (dpi) and EM.
n ¼ 42 for 05C197P002  16C108P065. The parents were planted
                                                                      Fruit quality phenotyping
from bare-root plants produced in a commercial high-elevation
                                                                      Fruit quality phenotypes were measured on one to four fruit
nursery in Dorris, CA, USA. The population was grown through
                                                                      harvested from individuals in the multifamily population at
June 30, 2019, irrigated as needed to prevent water stress, and
                                                                      harvest. The fruit were photographed with a Sony a 6000 camera
hand weeded throughout the growing season. Fruit were har-
                                                                      equipped with an E PZ 16–50 mm F3.5–5.6 OSS lens (SONY,
vested on from May 15 to June 7, 2019. Additional Royal Royce
                                                                      Tokyo, Japan). Photographs were processed with a custom
Tangi full-sib individuals (n ¼ 155) were grown, handled, and phe-
                                                                      macro in Fiji (Schindelin et al. 2012; Rueden et al. 2017) to obtain
notyped in 2019–2020 exactly as described above for the 2018–
                                                                      RGB color metrics (Supplementary File S1). RGB colors were sub-
2019 experiment (phenotypic data were collected for 233 Royal
                                                                      sequently converted into Lab colors using the convertColor()
Royce  Tangi individuals over two years). Fruit were harvested
                                                                      function in R (R Core Team 2021). Fruit firmness (maximum re-
May 8–29, 2020.
                                                                      sistance g-force) and fruit diameter (mm) were assessed on
                                                                      whole fruit using a TA.XT plus Texture Analyzer with a TA-53
DNA isolation and single-nucleotide                                   3 mm puncture probe (Stable Micro Systems Ltd., Goldaming,
polymorphism marker genotyping                                        United Kingdom). Fruit samples were frozen at 20 C in Whirl-
DNA was extracted from 0.2 g of dried young leaf tissue with the          R
                                                                          V
                                                                      Pak Homogenizer Blender Filter Bags (Nasco, Fort Atkinson, WI,
E-Z 96 Plant DNA Kit (Omega Bio-Tek, Norcross, GA, USA) per the       USA) for quantifying titrable acidity (TA; %), SSC ( BRIX), and to-
manufacturer’s instructions, though the protocol was modified         tal anthocyanin concentration (AC; lg/ml). TA percentages were
by adding Proteinase K to the lysis buffer to a final concentration   quantified with a Metrohm Robotic Titrosampler System from 1
of 0.2 mg/ml and extending lysis incubation to 45 min. at 65 C to    to 5 ml of the defrosted homogenized fruit juice (Metrohm AG,
increase the quality and yield of the DNA. Single-nucleotide poly-    Herisau, Switzerland). SSC was measured from approximately
morphisms (SNPs) were genotyped using the 50K Axiom SNP ar-           200 ml of juice on an RX-5000a-Bev Refractometer (ATAGO Co.
ray (Hardigan et al. 2020), and SNP calls were generated using the    Ltd., Tokyo, Japan). Total AC was measured from a 25 ml sample
Affymetrix Axiom Suite (v1.1.1.66). The raw genotypic data were       of juice in 200 ml 1% HCl in methanol by reading absorption at a
filtered to identify polymorphic SNP markers with clear and well      wavelength of 520 nm on a Synergy HTX platereader equipped
separated homozygous and heterozygous genotypic classes and           with Gen5 software (Molecular Devices, San Jose, California,
eliminate individual SNP markers with minor allele frequencies        USA). A standard curve (y ¼ sx þ i) was calculated for quantify-
< 0.05 and any missing data. This process yielded 11,946 SNPs for     ing AC using a dilution series of pelargonidin (Sigma Aldrich, St.
the training population (n ¼ 380) studied in 2019 and 9962 SNPs       Louis, MI, USA) from 0 to 300 mg/ml in 50 mg/ml increments,
for the Royal Royce  Tangi full-sib population (n ¼ 233) studied     where y was absorption readings for the perlagonin dilution se-
in 2019 and 2020.                                                     ries, s was the slope, x was the concentration of perlagonin in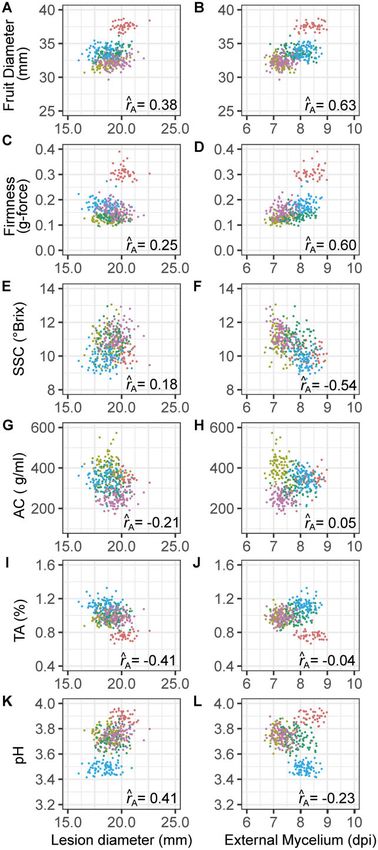
4   |   G3, 2022, Vol. 12, No. 1

the dilution series, and i was the intercept. AC was estimated by       Statistical analyses: estimation of genetic and
ðA  iÞ=s, where A was the absorption reading.                          genomic prediction parameters
                                                                        The repeatability on a progeny mean-basis (R) was estimated for
Statistical analyses: genetic and QTL mapping
                                                                        each trait from multiple subsamples/individual (fruit/individual)
and GWAS
                                                                        by R ¼ r2B =ðr2B þ r2W =s), where r2B is the between-individual vari-
GWAS approaches were applied to search for marker-trait associ-         ance component, r2W is the among subsamples nested in individ-
ations in the multifamily training population and the Royal             uals variance component, s is the harmonic mean number of
Royce  Tangi population. EMMs for LD and EM were estimated             subsamples/individual, and s was 2.4 in the multifamily popula-
from subsamples and biological replications using the R package         tion and 3.6 in the Royal Royce  Tangi population. Variance
emmeans (Lenth 2021). GWAS analyses were applied using the              components were estimated using REML in the R package lme4
GWAS() function in the R package rrBLUP with SNP genotypes              (Bates et al. 2015). Narrow-sense genomic heritability (h2) was es-
(AA, Aa, and aa) coded 1, 0, and 1, respectively (Endelman 2011).      timated for each trait from the mean of 1000 REML estimates of
The genomic relationship matrix was used to correct for popula-

                                                                                                                                                Downloaded from https://academic.oup.com/g3journal/article/12/1/jkab378/6427547 by guest on 10 January 2022
                                                                        the additive genetic and phenotypic variance components from
tion stratification (Endelman 2011). The genomic inflation factor       1000 Markov Chain Monte Carlo (MCMC) samples drawn for
(k) was 0.60 for LD and 0.71 for EM for analyses of the multifamily     cross-validation using G-BLUP (Endelman 2011).
population and 1.09 for LD and 1.00 for EM for analyses of the             Genomic estimated breeding values (GEBVs) were estimated
Royal Royce  Tangi population. The Bonferroni-corrected                for each trait by applying three whole-genome regression meth-
threshold for statistical significance was log10(0.05/k) where k is    ods in both training populations—genomic best linear unbiased
the number of SNPs used in the analysis. The Bonferroni-                prediction (G-BLUP), reproducing kernel Hilbert spaces (RKHS),
corrected threshold was log10(4.2  106) for the multifamily pop-      and support vector machine (SVM). G-BLUP, RKHS, and SVM
ulation and log10(5.0  106) for the Royal Royce  Tangi popula-       mixed model analyses were performed using the kinBLUP() func-
tion.                                                                   tion of rrBLUP (Endelman 2011), the BGLR() function of the R pack-
    Parent-specific genetic maps were developed for each full-sib       age BGLR (Pérez and de Los Campos 2014), and the svm() function
family using a custom PERL script pipeline utilizing the R pack-        of R package e1071 (Meyer et al. 2019), respectively. The kernel for
ages BatchMap and onemap (Schiffthaler et al. 2017; Margarido et al.    RKHS was determined using the multikernel averaging method
2007; Supplementary File S4). This pipeline was used to bin co-         (de Los Campos et al. 2010). Cross-validation analyses were per-
segregating markers, calculate pairwise recombination fractions,        formed for each population  trait  whole-genome regression
assign markers to linkage groups, and estimate linkage disequi-         (WGR) method using 1000 MCMC samples/analysis, where GEBVs
librium (LD) statistics between groups of markers. Specifically,        were estimated from a random sample of 80% of the individuals
initial linkage groups (representing chromosomal fragments or           and predicted for the GEBVs for the other 20% of the individuals
sub-linkage groups) were assembled using a LOD threshold of             in each sample; 100% of the subsamples/individual were used for
10.0 and a maximum recombination fraction of 0.08. These                these analyses. We replicated these cross-validation analyses us-
thresholds typically generate more linkage groups that chromo-          ing a single randomly selected subsample/individual, where
somes. These chromosomal fragments or sub-linkage groups                GEBVs were estimated from a random sample of 80% of the indi-
were then merged manually based on inter-group linkage dis-             viduals (with a single subsample/individual) and predicted the
equilibrium statistics and %-identity against the physical genome       GEBVs for the other 20% of the individuals. GS accuracy was esti-
(Edger et al. 2019). The RECORD algorithm (Van Os et al. 2005) was      mated for each of the nine analyses as the correlation between
used to estimate marker order and genetic distances across a            the phenotypic means (EMMs) and GEBVs (ry;GEBV ) for each trait
sliding window of 25 markers with a window overlap of 18                from 1000 MCMC samples/analysis.
markers.
    QTL analyses were applied to parent-specific genetic maps
within each full-sib family using the scanone() function and            Results and discussion
Haley–Knott regression (Haley and Knott 1992) as implemented            Natural postharvest gray mold infections on fruit
in the R package qtl (Broman et al. 2003). The null hypothesis of       of LSL cultivars
no significant difference between SNP marker genotypes was              Our studies were partly motivated by the observation that gray
tested for each locus using backcross equivalent contrasts; spe-        mold infections were uncommon between 0 and 14 dpi in a series
cifically, y Aa  y aa for SNP markers segregating in the female par-   of postharvest shelf life studies of modern LSL strawberry culti-
ent and y aa  y Aa for SNP markers segregating in the male parent,     vars (Figure 1; Supplementary Figure S1). The fruit for these
where Aa is a heterozygote and aa is a homozygote. The null hy-         studies were harvested from five day-neutral cultivars (“Royal
pothesis of no QTL effect was rejected when the likelihood odds         Royce,” “Valiant” “Moxie” “Cabrillo,” and “Monterey”) and three
(LOD) ratio for the SNP marker effect exceeded the genome-wide          summer-plant cultivars (“Finn,” “Mojo” and “Portola”) grown on
LOD significance threshold empirically estimated by permutation         commercial farms in coastal California (Figure 1; Supplementary
with 1000 randomly drawn samples (Churchill and Doerge 1994).           Figure S1). These studies produced several insights. Gray mold
    We searched the F.  ananassa “Camarosa” reference genome           infections were rarely observed before 14–16 dph on any of the
(Edger et al. 2019) for QTL-associated candidate genes with puta-       cultivars tested (Figure 1; Supplementary Figure S1). Statistically
tive biotic stress or disease resistance gene function annotations.     significant differences in gray mold incidence were not observed
Gene Ontology annotations were filtered to identify candidate           among day-neutral cultivars (P ¼ 0.87) or summer-plant cultivars
genes predicted to be involved in plant–pathogen interactions.          (P ¼ 0.98) or between organically and conventionally produced
Candidate genes were annotated using the KEGG Automated                 fruit (P ¼ 0.27 for day-neutral and P ¼ 0.68 for summer-plant culti-
Annotation Server (KAAS; Moriya et al. 2007) pipeline and filtered      vars). Cultivar  location interactions were nonexistent—REML
pathways. The iTAK pipeline was used to predict the presence of         estimates of the cultivar  environment interaction variance
transcription factors and protein kinases (Zheng et al. 2016).          component were zero in both studies (P ¼ 1).
S. Petrasch et al.   |     5

                                                                                                                                                               Downloaded from https://academic.oup.com/g3journal/article/12/1/jkab378/6427547 by guest on 10 January 2022
Figure 1 Postharvest visual appearance of cold stored fruit of LSL day-neutral cultivars grown in coastal California. Fruit of “Royal Royce,” “Valiant,”
“Moxie,” “Cabrillo,” and “Monterey” were harvested June 22 and 27, July 30, and August 1, 2018 from commercial farms in Santa Maria and Prunedale,
California, immediately cooled, stored undisturbed in 0.45 kg clamshells at 4 C and 90–95% relative humidity for 21 dph, and photographed and
phenotyped 0, 7, 14, and 21 dph (lefthand panel). EMMs for gray mold incidence (%) were estimated and plotted and exponential regressions were fit to
the original phenotypic observations (right panel). R2 estimates for goodness-of-fit of the exponential functions were 0.59 for Cabrillo, 0.22 for
Monterey, 0.25 for Moxie, 0.25 for Royal Royce, and 0.50 for Valiant.

    Gray mold incidence ranged from 0.0% to 2.7% among culti-                  parents with differences in fruit firmness and AC
vars at 14 dph, a typical postharvest storage duration for LSL cul-            (05C197P002  16C108P065). These full-sib families were pheno-
tivars. The five day-neutral cultivars were screened out to 21 dph             typed for resistance to gray mold using an artificial inoculation
to develop insights into the postharvest storage limits for modern             protocol and genotyped with a 50K Axiom SNP array (Hardigan
LSL cultivars (Figure 1). Although the fruit were still marketable             et al. 2020).
at 14 dph, they became marginally marketable or unmarketable
by 17–18 dph (Figure 1). We observed an exponential increase in
gray mold incidence beyond 17–18 dph for every cultivar with                   Development of a highly repeatable protocol for
means ranging from 10.3% to 36.7% among day-neutral cultivars                  gray mold resistance phenotyping in strawberry
at 21 dph. These studies showed that gray mold was ubiquitous                  Natural infections are too inconsistent and unreliable for analy-
and eventually rendered the fruit unmarketable but that the nat-               ses of the genetics of resistance to gray mold in strawberry. To
ural incidence of gray mold was negligible on fruit of LSL culti-              overcome this problem, we developed a highly repeatable artifi-
vars grown in coastal California within the 14 dph storage                     cial inoculation protocol for gray mold resistance phenotyping
window (Figure 1; Supplementary File S2).
                                                                               that involved puncturing fruit with a 3-mm probe, propagating
    From common knowledge and earlier surveys of phenotypic
                                                                               spores of a single B. cinerea strain (B05.10), introducing a known
diversity for resistance to gray mold (Gooding 1976; Barritt 1980;
                                                                               concentration of spores into the wound site, and monitoring dis-
Lewers et al. 2012), we hypothesized that the low incidence of
                                                                               ease development on individual fruit stored undisturbed under
gray mold on commercially produced fruit of LSL cultivars might
                                                                               high humidity (Figure 3). Two quantitative B. cinerea disease
be genetically correlated with fruit firmness and other fruit qual-
                                                                               symptoms were recorded on multiple fruits harvested from train-
ity traits affecting shelf life (Figure 2). Although phenotypic cor-
                                                                               ing population individuals: water-soaked LD in mm and the num-
relations have been reported (Barritt 1980), genetic correlations
                                                                               ber of dpi when EM was observed on the surface of the fruit. We
have not. The fruit of LSL cultivars are typically much firmer
                                                                               found that incubating artificially inoculated fruit at 10 C and 95%
than the fruit of SSL cultivars commonly grown for local or
direct-market consumption, as exemplified by Earlimiss,                        humidity in the dark yielded highly repeatable results with mini-
Madame Moutot, and Primella in the present study (Figure 2).                   mal contamination from other postharvest decay pathogens. LD
The latter are sweeter, softer, and perish more rapidly than                   and EM were recorded daily from 1 to 14 dpi (Figures 3 and 4).
“Royal Royce” and other LSL cultivars under normal postharvest                 This protocol produced highly reproducible results with repeat-
storage conditions (Figure 2). To explore how these phenotypic                 ability estimates in the 0.66–0.83 range for LD and 0.68–0.71 range
differences affect resistance to gray mold, we developed a train-              for EM (Table 1). Although critical for maximizing repeatability,
ing population (n ¼ 380) for GS studies by crossing “Royal Royce,”             this protocol produced more severe disease symptoms than those
one of the LSL cultivars assessed for natural infections (Figure 1),           commonly observed from natural infection, especially on non-
with four SSL cultivars (“Earlimiss,” “Madame Moutot,”                         wounded fruit of firm-fruited LSL cultivars (Jarvis 1962; Petrasch
“Primella,” and “Tangi”), in addition to crossing a pair of LSL                et al. 2019a; Figures 1 and 3; Supplementary Figure S1).
6 | G3, 2022, Vol. 12, No. 1
Figure 2 Fruit phenotypes for training population parents. Fruit of the parents of Royal Royce Primella, Royal Royce Madame Moutot, Royal Royce
Downloaded from https://academic.oup.com/g3journal/article/12/1/jkab378/6427547 by guest on 10 January 2022
Tangi, Royal Royce Earlimiss, and 05C197P002 16C108P065 full-sib families. The countries and years of origin are shown for each parent. The fruit
firmness categories were soft (0.30 kg/cm2). The total soluble solids categories were low ( < 9:0%),
medium (9.0–11.0%), and high (> 11:0%). Titratable acid (TA) concentration (%) categories were low ( < 0:7%), medium (0.7–1.0%), and high (> 1:0%).
External color intensity (L) categories were light (L > 41.0), medium (25.0–40.0 L), and dark (S. Petrasch et al. | 7
A 60 B 60
Lesion Diameter
Lesion Diameter
40 40
(mm)
(mm)
20 20
0 0
4 6 8 10 12 14 4 6 8 10 12 14
Timepoint (dpi) Timepoint (dpi)
C 0.15 D 0.15
Density
Density
0.10 0.10
Downloaded from https://academic.oup.com/g3journal/article/12/1/jkab378/6427547 by guest on 10 January 2022
0.05 0.05
0.00 0.00
0 10 20 30 40 0 10 20 30 40
Lesion Diameter (mm) Lesion Diameter (mm)
E 0.6 F 0.6
Density
Density
0.4 0.4
0.2 0.2
0.0 0.0
2 6 10 14 2 6 10 14
External Mycelium (dpi) External Mycelium (dpi)
Figure 4 Distributions for gray mold resistance phenotypes. Fruit of individuals from a multifamily population (n ¼ 380 individuals and s ¼ 1, 520 fruit)
and the Royal Royce Tangi population (n ¼ 233 individuals and s ¼ 1, 386 fruit) were artificially inoculated with B. cinerea and phenotyped 0–14 dpi for
LD (mm) and the speed of emergence of EM on the surface of the fruit (dpi). (A) The EMMs for LD are shown for 0–14 dpi among 380 individuals in the
multifamily population (21,280 phenotypic observations). (B) The EMMs for LD are shown for 0–14 dpi among 233 individuals in the Royal Royce Tangi
population (9797 phenotypic observations). The disease progression curves for individuals were plotted with different colors according to their EMM
ranks for LD at 8 dpi. (C, E) Phenotypic distributions for LD at 8 dpi and EM in the multifamily population. (D, F) Phenotypic distributions for LD at 8 dpi
and EM in the Royal Royce Tangi population.
Table 1 Repeatability (r) and narrow-sense genomic heritability and thus that resistance to gray mold can be enhanced by artifi-
(h2) estimates for gray mold LD and speed of emergence of EM cial selection (Table 1).
2 LDs were plotted for every individual to visualize phenotypic
Population Trait ^r h^
changes in disease symptoms over time (Figure 4, A and B). The
Complete Single heatmap colors of the individual curves were determined from
subsamples subsample the LD EMM ranks at 8 dpi. These plots show that the speed of le-
Multifamily LD 0.66 0.38 0.13
sion development differed among individuals, that cross-over in-
EM 0.68 0.39 0.16 dividual time interactions were negligible, and that the
Royal Royce Tangi LD 0.83 0.71 0.32 phenotypic changes among individuals were approximately par-
EM 0.71 0.44 0.13 allel over time, all of which increased confidence in the heritabil-
Statistics were estimated for n ¼ 380 individuals and s ¼ 1, 520 subsamples in a ity of the phenotypic differences we observed (Table 1).
multifamily population and n ¼ 233 individuals and s ¼ 1, 386 subsamples in Genome-wide searches failed to identify large-effect loci for
the Royal Royce Tangi population. The full-sib families in the multifamily
population were Royal Royce Earlimiss, Royal Royce Madame Moutot, LD or EM (Figure 5; Table 2). These searches included GWAS in
Royal Royce Primella, Royal Royce Tangi, and 05C197P002 16C108P06. the training populations and QTL mapping in individual full-sib
Narrow-sense genomic heritability was estimated for 100% of the subsamples
(s ¼ 2:9) and for a single randomly selected subsample/individual (s ¼ 1:0) in families. Nine family-specific QTL with small effects were identi-
both populations, where s is the harmonic mean number of subsamples/
fied, eight for LD and one for EM (Table 2). None had effects large
individual.
enough to warrant targeting by marker-assisted selection or in-
clusion as fixed effects in genomic prediction models. Although
34.0 mm at 8 dpi in the Royal Royce Tangi population (Figure 4; the QTL effects were small and family specific (Table 2), a few in-
Supplementary Figure S2). Similarly, the speed of appearance of teresting candidate gene associations were identified when short
mycelium on the surface of the fruit (EM) was approximately nor- QTL-associated haploblocks were searched in the reference ge-
mally distributed and ranged from 4.0 to 12.5 dpi in the multifam- nome for genes with biotic stress and disease resistance annota-
ily population and 5.5 to 12.5 dpi in the Royal Royce Tangi tions (Supplementary File S6). A cluster of 11 tandemly
population (fruit were phenotyped out to 14 dpi). The repeatabil- duplicated genes encoding pathogenesis-related (PR) proteins
ities for LD and EM among individuals in these populations sug- were found in close proximity to the most significant SNP (AX-
gested that two-thirds or more of the phenotypic variation 184469645) associated with a QTL on chromosome 4A (Table 2).
observed for gray mold resistance was genetically caused These genes share sequence homology to FcPR10, an Fragaria chi-
(Table 1). Narrow-sense genomic heritability estimates ranged loensis ribonuclease encoding gene previously predicted to reduce
from 0.38 to 0.71 for LD and 0.39 to 0.44 for EM, which suggested the severity of gray mold disease in strawberry (González et al.
that a significant fraction of the genetic variation was additive 2009, 2013). The other QTL-associated candidate genes that8 | G3, 2022, Vol. 12, No. 1
Downloaded from https://academic.oup.com/g3journal/article/12/1/jkab378/6427547 by guest on 10 January 2022
Figure 5 GWAS of gray mold resistance. Manhattan plots are shown for genome-wide scans for marker-trait associations for LD at 8 dpi in the
multifamily (A), LD at 8 dpi in the Royal Royce Tangi (B), speed of emergence of EM on the surface of the fruit in the multifamily (C), and EM in the
Royal Royce Tangi (D) populations. The individuals in both populations were genotyped with a 50K Axiom SNP array. The analyses were done using
the “Camarosa” reference genome (Edger et al. 2019) with physical positions of SNP markers ascertained by (Hardigan et al. 2020) using the chromosome
nomenclature of (Hardigan et al. 2021). Horizontal dashed lines identify the genome-wide Bonferroni significance threshold.
might warrant further study encode peroxidases (chromosome increased as LD decreased and EM increased). Royal Royce was
7D; Mb 576-2709) reported to modulate reactive oxygen species the more resistant parent for both traits in the four full-sib fami-
levels and inhibit fungal growth during B. cinerea infections lies with that parent (Figure 2; Supplementary Figure S2). For the
(Cantu et al. 2008, 2009; Tomas-Grau et al. 2018) and transcription 05C197P002 16C108P065 full-sib family, 05C197P002 was more
factors reported to signal pathogen-triggered immunity, e.g., resistant than 16C108P065 for LD and vice versa for EM. The LD
WRKY and AP2/ERF (chromosome 3B; Mb 13,870–15,400; and EM differences were highly significant (P 0:01) with indi-
Gutterson and Reuber 2004; Bigeard et al. 2015), that might target viduals transgressing the phenotypic ranges of the parents
pathogenicity factors, e.g., chitinases (van Schie and Takken (Supplementary Figure S2). Transgressive segregation was pri-
2014) and protease inhibitors (Hermosa et al. 2006; Billon-Grand marily bidirectional for both traits; however, the EM distributions
et al. 2012). While these genes are worthwhile candidates for fur- for Royal Royce Tangi and 05C197P002 16C108P065 were
ther study (González et al. 2009, 2013; Petrasch et al. 2019a), the right-skewed toward more resistance (slower EM emergence) and
effects of the associated QTL were too small and insignificant for lacked individuals in the lower tails distal to the more susceptible
direct selection (Table 2). This was, nevertheless, a first attempt parent (Supplementary Figure S2). These results suggested that
to identify loci underlying resistance to B. cinerea in strawberry favorable alleles were transmitted by both parents for both traits
through a genome-wide search for genotype-to-phenotype asso- and that favorable alleles for different loci segregated in most of
ciations in the octoploid genome (Supplementary File S6). the families.
Royal Royce, the firm-fruited LSL parent, was more resistant
to gray mold than the soft-fruited SSL parents (phenotypic distri- Genomic prediction accuracies varied between
butions and parent EMMs for each full-sib family are shown in populations and symptoms
Supplementary Figure S2). Lesions were smaller and mycelium Genomic prediction accuracies for different WGR methods
appeared later in Royal Royce than the other parents (resistance ranged from 0.28 to 0.47 for LD and 0.37 to 0.59 for EM whenS. Petrasch et al. | 9
Table 2 Summary statistics for QTL affecting gray mold resistancea in strawberry
Population SNP markerb Chromosomec Position (Mb)d Contraste Effect LODf Alleleg
LD (mm)
05C197P002 16C108P065 AX-184345814 7D 0.0 AA–AB 3.48 4.03 05C197P002
Royal Royce Primella AX-184496623 3B 105.0 BB–AB 2.49 3.61 Royal Royce
Royal Royce Primella AX-184685020 5C 88.7 AA–AB 0.87 3.70 Royal Royce
Royal Royce Earlimiss AX-184026159 3C 24.2 AA–AB 2.79 5.36 Royal Royce
Royal Royce Earlimiss AX-184469645 4A 101.6 AA–AB 2.52 4.26 Earlimiss
Royal Royce Tangi AX-184718804 3C 52.8 BB–AB 1.92 4.21 Royal Royce
Royal Royce Tangi AX-184031508 5A 0.0 BB–AB 1.92 4.56 Royal Royce
Royal Royce Tangi AX-184266150 7C 21.7 AA–AB 1.82 3.70 Tangi
EM (dpi)
Royal Royce Tangi AX-184857528 5C 93.1 BB–AB 0.48 4.03 Tangi
Downloaded from https://academic.oup.com/g3journal/article/12/1/jkab378/6427547 by guest on 10 January 2022
a
LD and the speed of emergence of EM on the surface of the fruit were recorded daily from 0 to 14 dpi. QTL statistics are shown for LD at 8 dpi, the last day that
none of the fruit had perished.
b
Alphanumeric names for SNP markers on the 50K Axiom SNP array Hardigan et al. (2020) with the largest effects (largest LOD score) for a particular QTL.
c
Chromosome numbers follow the nomenclature proposed by Hardigan et al. (2021) with letters designating subgenomes (A–D) and numbers designating
homoeologous chromosomes (1–7).
d
The physical positions of SNP markers were ascertained by Hardigan et al. (2020) from alignments of SNP probe sequences to the F. ananassa “Camarosa”
reference genome (Edger et al. 2019).
e
SNP marker genotypes were coded AA, AB, and BB where A is the allele transmitted by the parent shown on the left in the pedigree and B is the allele
transmitted by the parent shown on the right in the pedigree. Contrasts were estimated for each SNP marker as the difference between EMMs for genotypes. The
AA–AB contrast compared EMMs between AA homozygotes and AB heterozygotes, whereas the BB–AB contrast compared EMMs between BB homozygotes and AB
heterozygotes.
f
Logarithm of the odds (LOD) scores for SNP marker-QTL associations that exceeded statistical thresholds estimated by permutation.
g
The parent that transmitted the favorable allele. The favorable allele for LD decreased the EMM, whereas the favorable allele for EM increased the EMM.
Table 3 Genomic prediction accuracy for gray mold resistance
Populationa WGR methodb Genomic prediction accuracy
Complete subsample cross-validationc Single subsample cross-validationd
LD (mm)
Multifamily G-BLUP 0.33 0.17
RKHS 0.33 0.19
SVM 0.28 0.17
Royal Royce Tangi GBLUP 0.52 0.56
RKHS 0.59 0.57
SVM 0.59 0.58
EM (dpi)
Multifamily G-BLUP 0.47 0.35
RKHS 0.47 0.34
SVM 0.44 0.40
Royal Royce Tangi G-BLUP 0.37 0.36
RKHS 0.42 0.34
SVM 0.40 0.35
a
Statistics were estimated from analyses of n ¼ 380 individuals and s ¼ 1, 520 subsamples in a multifamily population and n ¼ 233 individuals and s ¼ 1, 386
subsamples in the Royal Royce Tangi population. The full-sib families in the multifamily population were Royal Royce Earlimiss, Royal Royce Madame
Moutot, Royal Royce Primella, Royal Royce Tangi, and 05C197P002 16C108P06.
b
GEBVs were estimated using G-BLUP, RKHS regression, and SVM.
c
GEBVs and genomic prediction accuracies were estimated from 100% of the subsamples/individual by cross-validation with 1000 permutations using 80% of
the individuals for training and 20% of the individuals for prediction, where the harmonic mean number of subsamples/individual (s) ¼ 2.9.
d
Genomic prediction accuracy was estimated from a single randomly selected subsample/individual by cross-validation with 1000 permutations using 80% of
the individuals for training and 20% of the individuals for prediction.
estimated by cross-validation from 100% of the subsamples multifamily and Royal Royce Tangi populations. The GEBV
(Table 3; Supplementary Figure S3). The differences in accuracy range for LD in the multifamily population was half as wide
among WGR methods for each trait-population combination (15.5–22.8) and the kernel density was flatter and more vertical
ranged from 0.00 to 0.07. RKHS produced the highest accuracy for than that observed in the Royal Royce Tangi population
two of the trait-population combinations and was equal in accu- (13.3–27.4; Supplementary Figure S3). Notably, the LD phenotypes
racy to G-BLUP for the other two trait-population combinations. of the most resistant individuals in the RR Tangi population
SVM often perfomed intermediate to both G-BLUP and RKHS. The (those with the smallest LD means) were well predicted. Their EM
prediction accuracy was greater for LD than EM in the Royal phenotypes, however, were not as well predicted—the GEBV
Royce Tangi population, whereas the reverse was observed in range for EM (6.8–9.2) was half that of the phenotypic range
the multifamily population. Using cross-validation with 100% of (5.5–10.7) and the kernel density distribution was flatter and
the subsamples, clear differences in prediction accuracy and more vertical (Supplementary Figure S3).
shrinkage were observed between disease symptoms within and One of the challenges of breeding for resistance to gray mold
between populations (Table 3; Supplementary Figure S3). The and other postharvest traits is phenotyping throughput.
prediction accuracy for LD was markedly different between the Collectively, 2563 fruit were harvested and individually stored,10 | G3, 2022, Vol. 12, No. 1
tracked, and phenotyped in our study (Figure 4). Our expectation
was that multiple fruit/individual was needed to more accurately
estimate EMMs and GEBVs and nominally increase heritability.
To assess the effect of subsamples on prediction accuracy and
explore the feasibility of applying selection for resistance to gray
mold from a single subsample/individual, GEBVs and prediction
accuracies were estimated from a single randomly selected sub-
sample/individual. We observed a significant decrease in narrow-
sense genomic heritability for LD and EM in the single subsample
^ 2 decreased from 0.38 to 0.13 for LD and 0.39 to
analyses, e.g., h
0.16 for EM in the multifamily population (Table 1). Naturally,
prediction accuracies plummeted in the single subsample analy-
ses too (Table 3; Supplementary Figure S3). This is clearly illus-
Downloaded from https://academic.oup.com/g3journal/article/12/1/jkab378/6427547 by guest on 10 January 2022
trated by the kernel density distributions for GS accuracy
estimated for G-BLUP, RKHS, and SVM by cross-validation with a
single subsample/individual (Supplementary Figure S3). GEBV
ranges were narrower and kernel density distributions were flat-
ter and more vertical for the single subsample vs multiple sub-
sample analyses for LD and EM in both populations
(Supplementary Figure S3). Hence, we concluded that breeding
values cannot be accurately predicted without subsampling fruit.
Gray mold resistance traits were genetically
correlated with shelf life-associated fruit quality
traits
One of our working hypotheses was that selection for increased
fruit firmness and other shelf life-associated fruit quality traits
pleiotropically decreased susceptibility to gray mold in straw-
berry. The additive genetic correlations support this hypothesis
and highlight between family differences driven by breeding his-
tory, the phenotypic diversity of the parents, and transgressive
segregation (Figures 3 and 6; Supplementary Figure S2). The pair-
wise breeding value distributions further highlight the family
structure and phenotypic diversity within and among families.
The fruit size, firmness, and TA by LD and EM breeding value dis-
tributions for the only elite elite family in our study
(05C197P002 16C108P065) were distinct from the four elite
exotic families (Figure 6, A–D and I and J).
LD and EM were weakly negatively genetically correlated
(^r A ¼ 0:21) and weakly to strongly genetically correlated with
fruit quality traits in directions predicted by our hypotheses.
Because gray mold resistance increases as LD decreases and EM
increases, signs of the additive genetic correlations have different
interpretations for LD and EM and can be antagonistic or syner-
gistic. The interpretation depends on the specific phenotypes tar-
geted for a particular market, e.g., SSL vs LSL. LD was negatively
genetic correlated with titratable acidity (^r A ¼ 0:41) and posi-
tively genetically correlated with pH (^r A ¼ 0:41); hence, LD in-
creased as titratable acidity decreased and pH increased Figure 6 Additive genetic correlations (^r A ). Scatter plots are shown for
(Figure 6, I and J). The effect of titratable acidity on resistance G-BLUP estimates of GEBVs for gray mold resistance and fruit quality
phenotypes was the motivation for screening additional individu- traits among 380 individuals in a multifamily training population. The
individual families are Royal Royce Primella (olive), Royal Royce
als from the Royal Royce Tangi family, which had a significant
Madame Moutot (green), Royal Royce Tangi (blue), Royal Royce
genetic variation for TA and yielded more accurate genomic pre- Earlimiss (magenta), and 05C197P002 16C108P065 (coral). The
dictions for LD than were observed in the multifamily population abbreviations for fruit quality traits are SSC, soluble solids content; AC,
(Supplementary Figure S3). EM was more strongly positively ge- anthocyanin content; TA, titratable acidity.
netically correlated with fruit size and firmness than LD and neg-
atively genetically correlated with total soluble solids (Figure 6). firmer, less sweet, and larger fruit, as is typical of Royal Royce
EM increased (disease resistance increased) as BRIX decreased and other modern LSL cultivars (Figures 1 and 2).
and fruit size and firmness increased. Hence, we found that my- Finally, LD was weakly negatively genetically correlated with
celium developed faster on softer, sweeter, and smaller fruit than AC, whereas EM was uncorrelated with AC (Figure 6, G and H).S. Petrasch et al. | 11
Although the additive genetic correlation we observed between increased titratable acidity and firmness and decreased sugars
LD and AC was in the direction predicted by previous studies in but these phenotypes profoundly affect flavor and cannot be ma-
strawberry and tomato (Jersch et al. 1989; Hébert et al. 2002; nipulated in a vacuum (Zorrilla-Fontanesi et al. 2011; Diamanti
Bassolino et al. 2013; Zhang et al. 2013), LD only slightly decreased et al. 2012; Lerceteau-Köhler et al. 2012; Verma et al. 2017).
as AC increased (Figure 6). Without more extensive germplasm screening, the data needed
to guide the selection of parents for future genetic studies are
Breeding for enhanced resistance to gray mold in lacking.
strawberry Third, the natural incidence of gray mold was only explored in
Breeding for resistance to necrotrophic pathogens has been chal- the present study for LSL cultivars commercially grown in
lenging in plants (Finkers et al. 2007a, 2007b; Williamson et al. California (Figure 1). Highly perishable short- and medium-shelf
2007; Petrasch et al. 2019a; Lorang 2019; Delplace et al. 2020). The life cultivars, as typified by the heirloom cultivars (parents) we
mechanisms of resistance to necrotrophic pathogens are more screened (Figure 2), are challenging to grow and phenotype in
subtle, quantitative, and complex than those commonly ob- such studies because they typically have low yields, are easily
Downloaded from https://academic.oup.com/g3journal/article/12/1/jkab378/6427547 by guest on 10 January 2022
served for biotrophic pathogens that trigger pathogen-associated bruised and wounded, and cannot be harvested and handled
molecular pattern-triggered-immunity and effector-triggered im- with the same robustness as commercially important LSL culti-
munity (Glazebrook 2005; Jones and Dangl 2006; Jones et al. 2016; vars. Nevertheless, a study of the natural incidence of gray mold
Saijo et al. 2018; Lorang 2019; Zhang et al. 2019; Caseys et al. 2021). among individuals spanning the shelf life spectrum could shed
Our findings were well aligned with previous findings in other further light on genetic correlations between fruit quality and
B. cinerea hosts and shed light on the genetic complexity of resis- gray mold resistance phenotypes and possibly identify sources of
tance to gray mold in strawberry. Where do we go from here? We favorable alleles underlying intrinsic resistance that are uncorre-
are skeptical that significant genetic gains can be achieved for lated with fruit quality traits, e.g., biochemical phenotypes trig-
gray mold resistance across the complete shelf life spectrum in gered by defense mechanisms (Diaz et al. 2002; Glazebrook 2005;
strawberry but are confident that postharvest gray mold inci- van Kan 2006; Williamson et al. 2007; Veloso and van Kan 2018;
dence can be minimized but obviously not eliminated in LSL pop- Lorang 2019; Petrasch et al. 2019a). Because gray mold disease
ulations. This conclusion seems well aligned with previous symptoms from artificial inoculation protocols are typically
findings in strawberry and other hosts of this pathogen (Finkers harsher than those observed from natural infections of non-
et al. 2007a, 2007b; Rowe and Kliebenstein 2008; Lewers et al. wounded fruit (Figures 1 and 3), a deeper exploration of the natu-
2012). Because several fruit quality traits pleiotropically affect ral incidence of gray mold seems warranted in strawberry,
gray mold resistance in strawberry, the challenge is exponentially perhaps by simulating rainfall in field experiments through over-
greater when breeding for markets where softer fruits with ele- head irrigation or other practices to increase the uniformity and
vated sugars are preferred and LSL phenotypes are neither neces- incidence of natural infection.
sary nor preferred (Figures 1, 2 and 6). However, for markets Our results suggest that phenotypic or GS could be effective
where LSL cultivars are essential, direct selection for the requisite for gray mold resistance but only in certain populations and only
fruit quality traits seems to confer sufficient resistance to gray when selection for genetically correlated traits does not antago-
mold to ensure marketability under normal postharvest storage nistically reduce genetic gains for gray mold resistance pheno-
conditions and timelines, especially for fruit produced in coastal types (Table 3; Supplementary Figure S3). Genetic gains for gray
California and other arid and semi-arid environments with low mold resistance are affected by shelf life-related traits through
humidity and rainfall (Figure 1; Supplementary Figure S1). additive genetic correlations and could be reversed by simulta-
Although we only sampled 12 coastal California environments neous selection for fruit quality and shelf life traits that antago-
(six locations two harvests/location) to estimate the natural in- nistically pleiotropically affect gray mold resistance phenotypes
cidence of B. cinerea among eight LSL cultivars, we suspect that (Figure 6). Genetic variation for fruit quality traits strongly af-
deeper sampling will confirm our findings. fected the phenotypic differences we observed for LD and EM.
There are open questions to be addressed and were limitations Most importantly, the fruit quality traits associated with en-
to our study. First, we did not screen diverse germplasm to iden- hanced flavor were antagonistically genetically correlated with
tify sources of resistance to gray mold. As our study and others gray mold resistance phenotypes (Figure 6).
have shown, strong sources of resistance to this pathogen may Cross-validation of genomic predictions in the present study
not exist (Chandler et al. 2006; Seijo et al. 2008; Lewers et al. 2012; shed light on the complexity of genetic mechanisms underlying
Bestfleisch et al. 2015). The narrow-sense heritability estimates gray mold resistance phentoypes and highlighted the challenges
and genomic prediction results for LD and EM in the present inherent in breeding for increased resistance to gray mold in
study suggest that a deeper exploration of genetic diversity, while strawberry (Table 3; Supplementary Figure S3). The three WGR
challenging, seems worthwhile (Table 1; Supplementary Figure methods we applied to the prediction problem strongly shrunk
S3). The association between resistance and titratable acidity breeding values to the population mean for LD in the multifamily
seems to be particularly promising and worthy of further study and EM in the Royal Royce Tangi populations. Such shrinkage
(Figure 6), particularly if increased acidity is offset by increased is typical for moderately heritable complex diseases in plants
sugars to achieve a palatable sugar: acid balance. (Rutkoski et al. 2011, 2014; Poland and Rutkoski 2016).
Second, the parents for this study were selected to assess the The prospects for identifying superior genotypes through GS
effects of fruit quality and shelf life-associated traits on gray were greater for LD in the Royal Royce Tangi population and
mold disease development (Figure 2), not for known intrinsic dif- EM in the multifamily population than vice versa. Whether ap-
ferences in gray mold resistance that are genetically uncorrelated plying phenotypic or GS, the probability of selecting superior gen-
with fruit quality and shelf life phenotypes. The pleiotropic otypes can be exceedingly low when breeding for resistance to
effects of shelf life-associated fruit quality traits on gray mold genetically complex diseases in plants (Poland and Rutkoski
susceptibility appear to be inescapable (Figure 6). Our results 2016; Crossa et al. 2017; Voss-Fels et al. 2019). Nevertheless, with
suggest that resistance can be increased by selecting for cost-effective genome-wide genotyping, GS has the potential toYou can also read