GENERATION Z: Portrait of a New Generation of Young Canadians and How They Compare to Older Canadians A report commissioned by Elections Canada ...
←
→
Page content transcription
If your browser does not render page correctly, please read the page content below
GENERATION Z:
Portrait of a New Generation of Young Canadians and
How They Compare to Older Canadians

A report commissioned by Elections Canada

Produced by
Valérie-Anne Mahéo, PhD
and
Éric Bélanger, PhD

January 2021

                                                  1
Table of Contents
List of Figures.............................................................................................................. 4
List of Tables ............................................................................................................... 5
Note to the Reader...................................................................................................... 6
Executive Summary ..................................................................................................... 7
Key Findings.............................................................................................................. 10
Introduction .............................................................................................................. 14
Survey and Data ....................................................................................................... 17
Social and Political Orientations ................................................................................ 20
   1.        Social attitudes ........................................................................................................ 20
        a.      Trust toward others ................................................................................................................... 20
        b.      Materialism ............................................................................................................................... 21
   2.        Political attitudes ..................................................................................................... 23
        a.      Political trust ............................................................................................................................. 23
        b.      Political cynicism ....................................................................................................................... 24
        c.      Satisfaction with democracy ..................................................................................................... 26
        d.      Who should make policy decisions in democracy? ................................................................... 26
        e.      Partisanship ............................................................................................................................... 27

Political Engagement ................................................................................................ 29
   1.        Political resources .................................................................................................... 29
        a.      Political knowledge.................................................................................................................... 29
        b.      Feelings of political competency ............................................................................................... 32
        c.      Political interest ......................................................................................................................... 33
   2.        Media consumption ................................................................................................. 36
        a.      Frequency of news consumption .............................................................................................. 36
        b.      News sources ............................................................................................................................. 36
        c.      Trust in news sources ................................................................................................................ 38
   3.        Social resources ....................................................................................................... 38
        a.      Social networks: Political discussions ........................................................................................ 39
        b.      School: Civics courses and mock elections ................................................................................ 39
        c.      Political parties .......................................................................................................................... 40

Political Participation ................................................................................................ 42
   1.        Attitudes towards the electoral process ................................................................... 42
        a.      Duty to vote ............................................................................................................................... 42
        b.      Trust in Elections Canada .......................................................................................................... 42
        c.      Interest in working at a poll....................................................................................................... 43
        d.      Youth registration ...................................................................................................................... 43
        e.      Ease of voting in a federal election ........................................................................................... 45
        f.      Lowering the voting age ............................................................................................................ 46
   2.        Political and civic behaviours.................................................................................... 47
        a.      Climate action............................................................................................................................ 47

                                                                                                                                                             2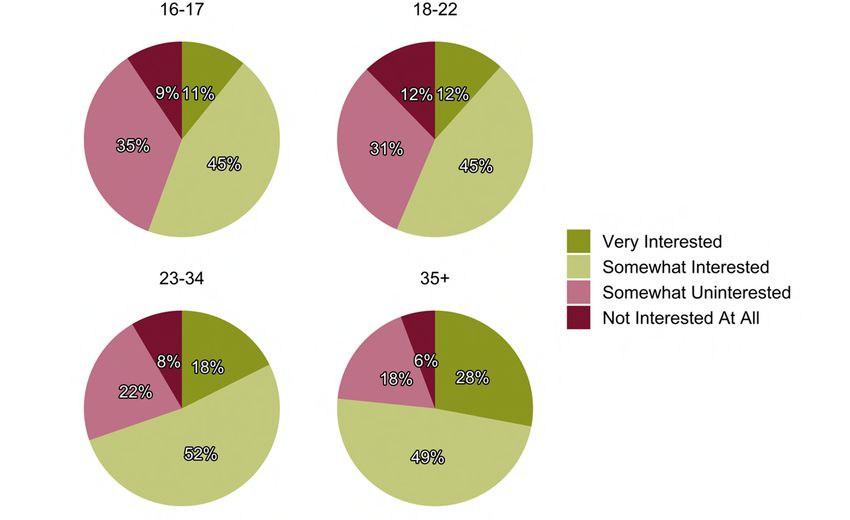
b.      Turnout ...................................................................................................................................... 49
        c.      Electoral campaign activities ..................................................................................................... 55
        d.      Other non-electoral forms of participation ............................................................................... 56

Conclusion ................................................................................................................ 59
Recommendations .................................................................................................... 61
   Political socialization and democratic education ............................................................... 61
   Disseminating information and communication strategies ................................................ 63
   Access to the electoral process ......................................................................................... 65
   Other initiatives promoting engagement in Canadian democracy ...................................... 65
References ................................................................................................................ 67
Appendix 1: Survey Respondent Profiles and Regressions .......................................... 71
Appendix 2: Survey Questions ................................................................................... 77
   1.        Demographics .......................................................................................................... 77
   2.        Issues ...................................................................................................................... 78
   3.        Political knowledge .................................................................................................. 78
   4.        Voter turnout .......................................................................................................... 79
   5.        Political feelings and opinions .................................................................................. 79
        a.      Political ideology, interest and news ......................................................................................... 79
        b.      Campaign activities.................................................................................................................... 81
        c.      Participation frequency in past 12 months ............................................................................... 81
        d.      Climate activity .......................................................................................................................... 82
   6.        Attitudes ................................................................................................................. 82
        a.      Political attitudes ....................................................................................................................... 82
        b.      Materialism ............................................................................................................................... 83
        c.      Trust levels ................................................................................................................................ 84
        d.      Party identification .................................................................................................................... 85
        e.      Youth question .......................................................................................................................... 85
        f.      News sources ............................................................................................................................. 86

                                                                                                                                                              3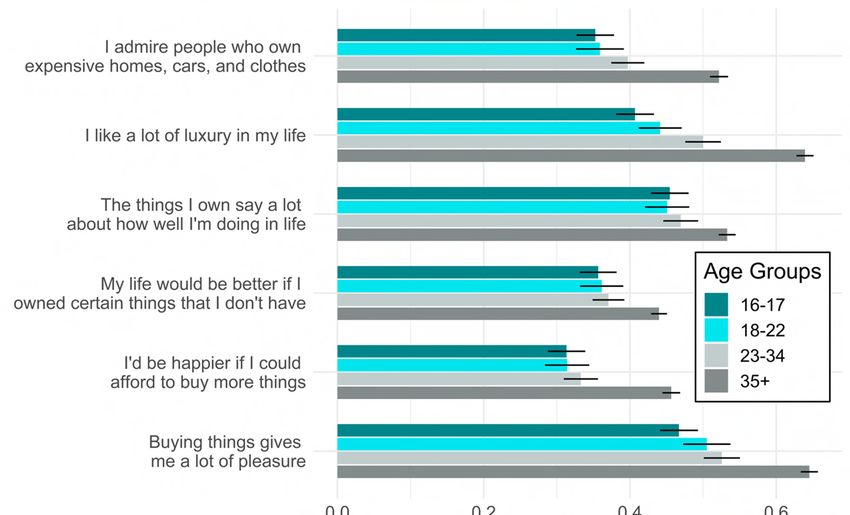
List of Figures
Figure 1: Socio-demographic characteristics of three generations of Canadians (with 95%
confidence intervals)......................................................................................................... 19
Figure 2: Levels of generalized trust, by age group (with 95% confidence intervals) ...... 20
Figure 3: Respondents' reported levels of materialism, by age group (with 95% confidence
intervals) ........................................................................................................................... 22
Figure 4: Preferences for state goals included in the post-materialist scale, by age group
(with 95% confidence intervals) ....................................................................................... 23
Figure 5: Levels of trust in three institutions, by age group (with 95% confidence intervals)
........................................................................................................................................... 24
Figure 6: Levels of cynicism expressed about political parties and institutions, by age
group (with 95% confidence intervals) ............................................................................. 26
Figure 7: Proportions of respondents with or without a partisan identity, by age group
(with 95% confidence intervals) ....................................................................................... 28
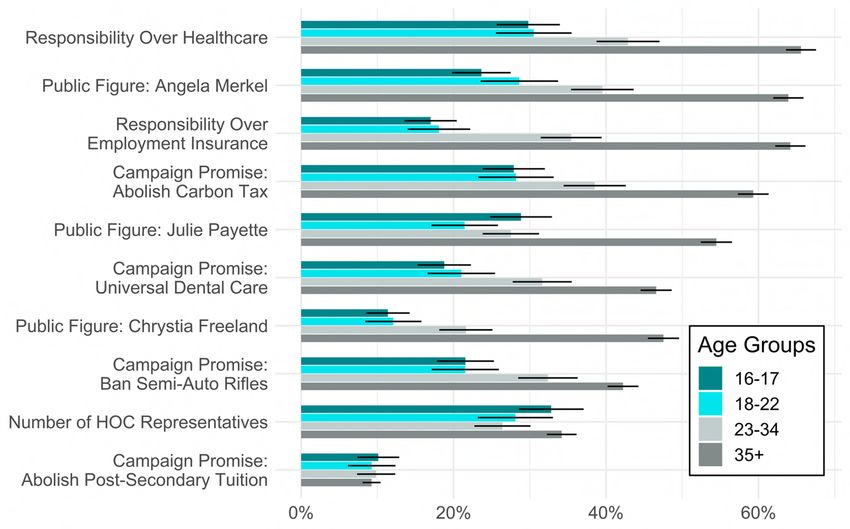
Figure 8: Average number of correct answers to 10 political knowledge questions, by age
group (with 95% confidence intervals) ............................................................................. 30
Figure 9: Proportions of correct answers to 10 political knowledge questions, by age group
(with 95% confidence intervals) ....................................................................................... 31
Figure 10: Average agreement with statement about politics being too complicated, by
age group (with 95% confidence intervals) ...................................................................... 33
Figure 11: Levels of political interest, by age group ......................................................... 34
Figure 12: Predicted levels of political interest (with 95% confidence intervals) ............ 35
Figure 13: Visualization of preferred news media sources for respondents aged 16–17 (left
panel) and those aged 35 and older (right panel) ............................................................ 37
Figure 14: Percentage of respondents aged 16 to 22 who reported taking civics courses
and participating in mock elections, by age group (with 95% confidence intervals) ....... 40
Figure 15: Percentage of respondents who reported being contacted by a political party,
by age group (with 95% confidence intervals) ................................................................. 41
Figure 16: Level of trust in Elections Canada, by age group (with 95% confidence intervals)
........................................................................................................................................... 43
Figure 17: Average levels of preference for different modes of registration before turning
18, among those aged 16–18 (with 95% confidence intervals)........................................ 44
Figure 18: Levels of agreement and disagreement with the statement “voting is easy,” by
age group .......................................................................................................................... 46
Figure 19: Levels of agreement and disagreement with the idea of a reform to lower the
voting age, by age group ................................................................................................... 47
Figure 20: Average number of environmental actions, by age group (with 95% confidence
intervals) ........................................................................................................................... 48
Figure 21: Frequency of taking some actions to fight climate change, by age group (with
95% confidence intervals) ................................................................................................. 49
Figure 22: Reported intended turnout for those aged 16 and 17 and reported turnout for
other age groups (with 95% confidence intervals) ........................................................... 50
4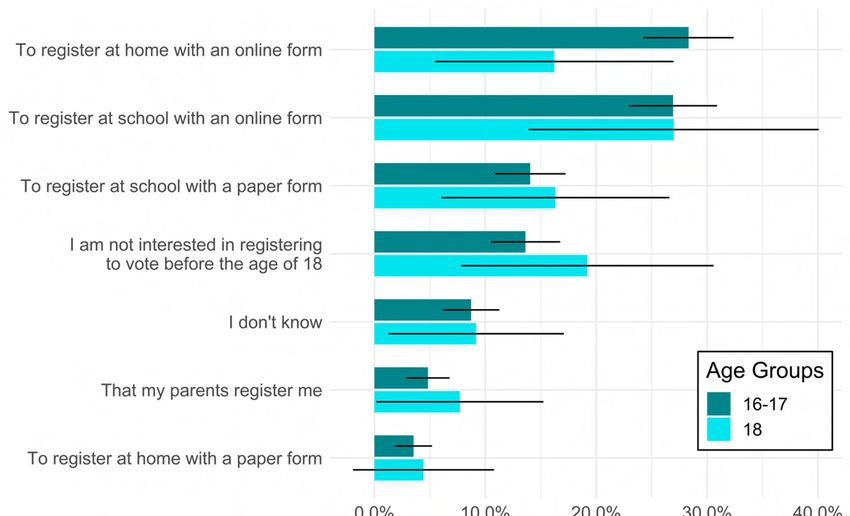
Figure 23: Predicted levels of intended or actual turnout of those aged 16–17 and 18–22,
based on their visible minority status............................................................................... 51
Figure 24: Predicted levels of intended or actual turnout of those aged 16–17 and 18–22,
based on their levels of political discussions with friends and teachers .......................... 52
Figure 25: Predicted levels of intended or actual turnout of those aged 16–17 and 18–22,
based on their information searches ................................................................................ 53
Figure 26: Predicted levels of intended or actual turnout of those aged 16–17 and 18–22,
based on their levels of civic duty..................................................................................... 54
Figure 27: Predicted levels of intended or actual turnout of those aged 16–17 and 18–22,
based on their levels of political interest ......................................................................... 54
Figure 28: Predicted levels of intended or actual turnout of those aged 16–17 and 18–22,
based on their perceptions of the ease of voting............................................................. 55
Figure 29: Average number of political actions in the past 12 months, by age group (with
95% confidence intervals) ................................................................................................. 57
Figure 30: Average frequency of participation in different non-electoral activities in the
past 12 months, by age group (with 95% confidence intervals) ...................................... 58

List of Tables

Table 1: Profile of survey respondents ............................................................................. 71
Table 2: OLS regressions explaining levels of political interest of those aged 16 to 22... 73
Table 3: Logistic regressions explaining intended turnout (for those aged 16–17) and
actual turnout levels (for those aged 18–22) ................................................................... 75

                                                                                                                            5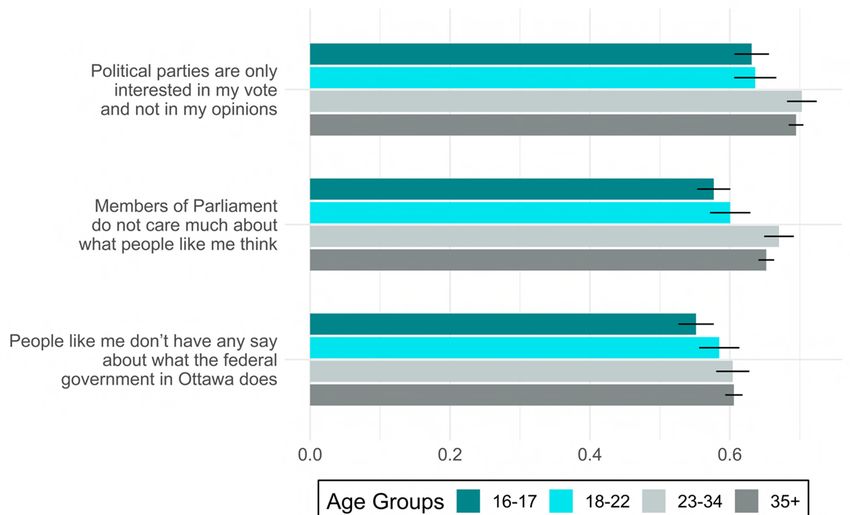
Note to the Reader
This research paper was prepared for Elections Canada by Valérie-Anne Mahéo, Assistant
Professor, Department of Political Science at Université Laval and member of the Centre
for the Study of Democratic Citizenship, and Éric Bélanger, Professor, Department of
Political Science at McGill University and member of the Centre for the Study of
Democratic Citizenship, with the help of Marie Foster and Tim Roy.

The observations and conclusions are those of the authors and do not necessarily reflect
the opinions of Elections Canada.

                                                                                      6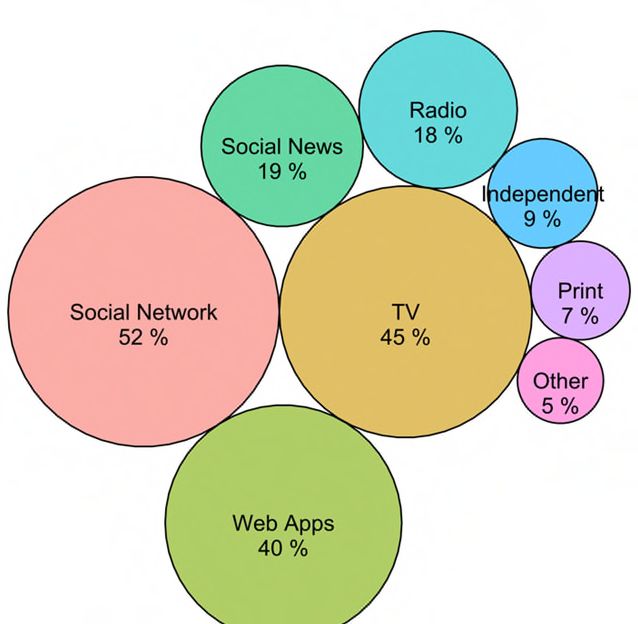
Executive Summary
This report was commissioned by Elections Canada to examine the types and levels of
knowledge, experiences, perceptions, opinions and attitudes of Canadians aged 16 and
17 in relation to electoral matters, and how they compare with older age groups in
Canada.

Our report offers a portrait of a new generation of young Canadians born after 1997:
Generation Z (or Gen Z). We focus on the social and political orientations of members of
Generation Z who were eligible to vote for the first time in 2019 (youth aged 18 to 22)
and those who will soon be of voting age (those aged 16 and 17). While looking at
Generation Z on its own is interesting, comparisons of their positions, values and
behaviours with those of older Canadians—members of the Millennial, Generation X and
Baby Boomer generations—are particularly informative. Today’s youth will grow older,
occupy a more important place in society, and ultimately replace older cohorts of
Canadians. So knowing how much the members of Generation Z are similar to or different
from previous cohorts of Canadians can inform a variety of actors, including social,
political and institutional actors, about how they need to pursue their work with Canadian
youth and with citizens more broadly in the years to come, so that they are politically
engaged and participate in the electoral process.

 In 2019, a new generation of Canadians became enfranchised: Generation Z. Members
of this generation—those born after 1997—were eligible to vote for the first time during
the 2019 federal election. As this new generation is bound to occupy a more prominent
place in Canadian society and politics in the coming years, and as more members of
Generation Z become eligible to vote throughout the next decade, we may wonder: Who
are Generation Z’s members? What do they believe in? How do they get involved in
society? And how do these youth compare with older Canadians?

As Generation Z is just coming of age, studies on this generation and its characteristics
are still scarce, and the few published studies mostly examine American youth. More
research is needed to learn about Generation Z, notably in Canada. Such research would
be especially useful for Elections Canada, to inform evidence-based decision-making
about the administration and development of civic education programs, outreach
initiatives, pre-registration of youth, and information campaigns. It could help Elections
Canada tailor their programs and information to the needs and preferences of
contemporary youth, thereby increasing their potential effectiveness. This report aims to
offer a portrait of Generation Z in Canada, also referred to by some as the “iGeneration.”

                                                                                        7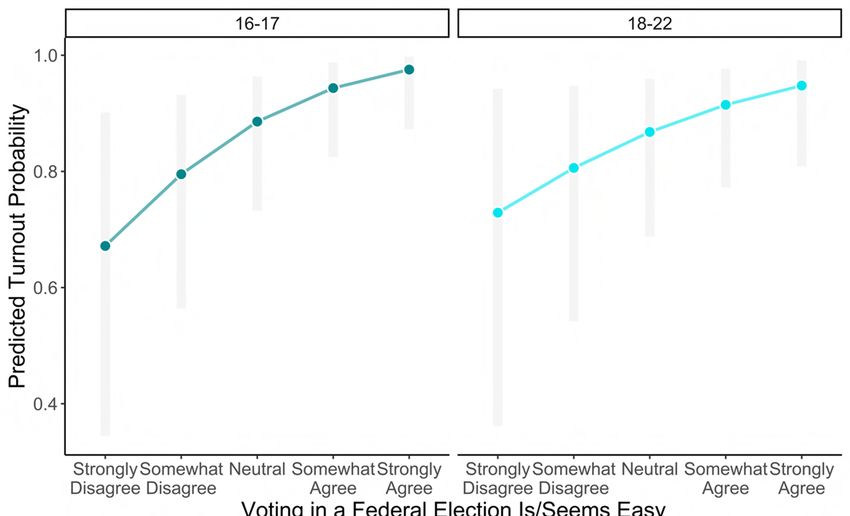
Survey and data
To provide an in-depth portrait of Generation Z’s political attitudes and behaviours and
compare them with those of older generations of Canadian voters, we conducted an
opinion survey during the weeks following the 2019 federal election, which took place on
October 21.
The survey was completed online between November 13, 2019, and January 16, 2020,
via the Qualtrics platform.
The total number of survey respondents was 4,287, including an oversampling of
youth aged 16 to 19.
In our analysis, we divide the survey’s sample into four groups (or cohorts):
1. Underage Gen Z: respondents born in 2002 and 2003 (16 or 17 years old at the time
of the survey, N=500). They were not eligible to vote in the 2019 federal election.
2. Adult Gen Z: respondents born between 1997 and 2001 (18–22 years old at the time
of the survey, N=610). They were eligible to vote in the 2019 federal election.
3. Millennials: respondents born between 1985 and 1996 (23–34 years old at the time
of the survey, N=591).
4. Generation X and Baby Boomers: individuals born before 1985 (aged 35 and older at
the time of the survey, N=2,586).
Overview of findings
Overall, Generation Z are mostly distinct from Generation X and the Baby Boomers, but
share some orientations with Millennials. Our research also indicates that Gen Z is not
homogeneous. Various particularities of those aged 16–17 are shown in this research.
In terms of their socio-demographic background, Generation Z is more ethnoculturally
diverse than previous generations, which explains in part why they are more open to
diversity. In terms of values and social orientations, they are less materialist and a little
less trusting of people in general.
When it comes to politics, members of Generation Z are quite distinct. They are more
trusting of governments, less cynical about politics, and more positive towards Canadian
democracy, while they identify less with political parties compared with older groups of
Canadians, which could be partly related to their more limited experience with politics.
The youngest Canadians are also less engaged with politics: They are less knowledgeable
about politics, less politically interested, they follow the news less frequently, and they
are less confident—as are Millennials—about their ability to understand politics.
Generation Z’s news consumption patterns are also quite similar to those of Millennials.
Compared with Gen Xers and Boomers, these two groups are more likely to consume
news online (especially on social networks) and much less through print media or the
radio. However, Gen Zers are distinct in that they tend to trust news published by
professional journalists and news posted on social media equally, compared with all older
groups of Canadians, who trust professional journalism more.
8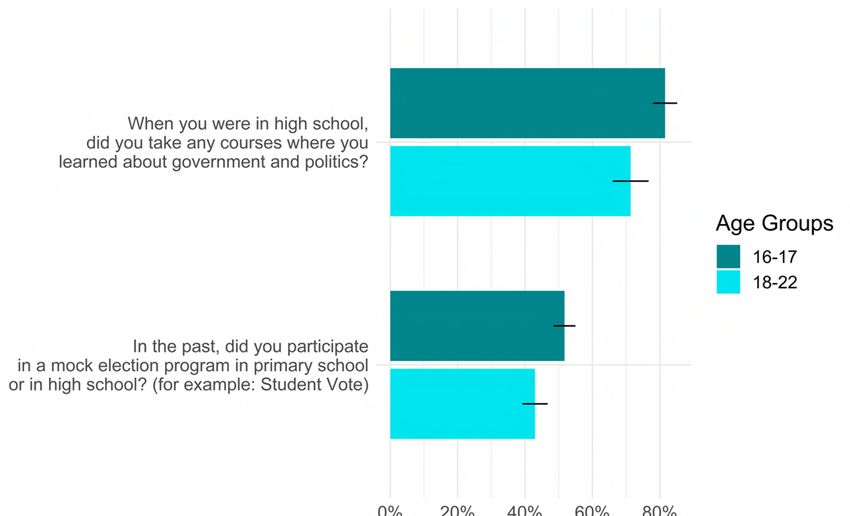
With regard to civic and political participation outside of elections, young Canadians are
as active or more active overall than older Canadians, and in different ways. Younger
Canadians tend to lead the way in the use of public transit and raising awareness in their
social networks to fight climate change, and they are also more likely to share information
about the environment online, as are Millennials. During the 2019 electoral campaign,
Gen Zers and Millennials were also more likely to have used the Vote Compass to find
information related to the election. Generation Z reported higher levels of engagement
in their community through volunteering, donations, and political and environmental
protests. Like Millennials, they were more likely to sign petitions, boycott or buycott
products, and share political information online, and less likely to contact public officials.

But, as expected, and consistent with past research, older Canadians still turn out at
higher rates in elections. Gen Zers were the least likely to turn out in the last election,
although the underage Gen Zers who were 16 and 17 years old at the time of the election
still display high intentions of voting. Several factors may help to explain the age
differences in turnout, such as the fact that Millennials and Generation Z are less likely to
believe that voting is a duty; they are less likely to perceive voting as easy; and they are
less likely to be mobilized by political parties and candidates.

While we have proposed several hypotheses in this report to explain some of the
differences or similarities found between the generational groups, these remain
hypotheses only. In fact, panel data would be required to clearly identify which findings
are due to cohort differences, to aging, or to period effects.

                                                                                            9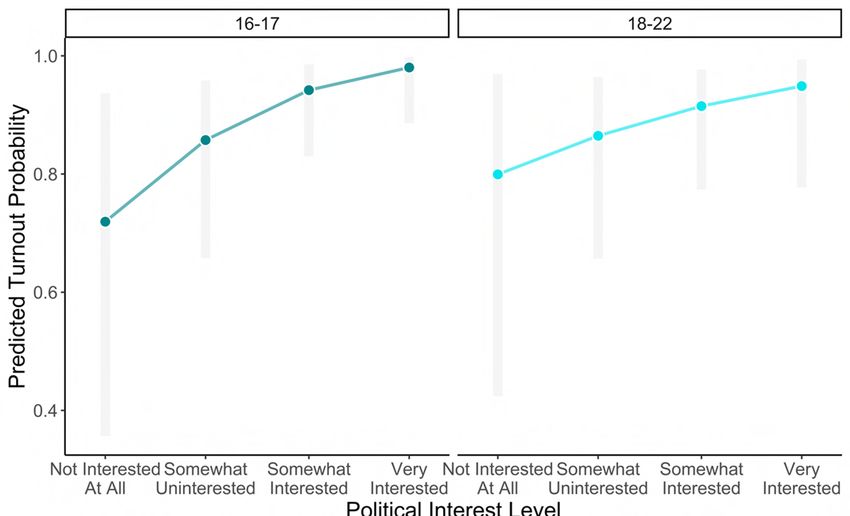
Key Findings
Socio-demographic background
Generation Z (Gen Z) is more ethnoculturally diverse than previous generations.
Members of Gen Z are more likely to be born outside of Canada, to speak a language
other than English and French, and to be members of a visible minority, compared
with members of older generations.
Social and political orientations
Generation Z shares many characteristics with Millennials, Generation X, and Baby
Boomers; however, there are also notable differences:
Trust: Members of Gen Z are as trusting of people, in general, as Millennials, but less
trusting than Gen Xers and Baby Boomers (who are the most trusting group).
However, the difference between the youngest and oldest Canadians is moderate
(less than 10 percentage points).
Materialism: Gen Zers are the least materialistic of all generations of Canadians, while
those 35 years and older are the most materialistic. The differences between Gen Zers
and Millennials are minimal.
When it comes to politics, members of Gen Z are quite distinct:
Cynicism: Gen Zers are less cynical about politics compared with Millennials, Gen Xers,
and Baby Boomers.
Satisfaction with democracy: Gen Zers are more satisfied with the way democracy
works in Canada than Millennials, Gen Xers, and Baby Boomers.
Partisan identification: The youngest Canadians identify less with political parties
compared with older groups of Canadians, which could be partly related to their more
limited experience with politics. While close to 80% of Canadians aged 35 years or
older report identifying with a federal political party, less than 70% of those aged 18–
22 and less than 60% of those aged 16–17 say they identify with a federal political
party. Among those reporting a partisan identity, those aged
16–17 report weaker partisan attachment compared with the three other age groups.
Political engagement and participation
Political resources
Gen Zers are generally less engaged with politics:
Knowledge: On average, Canadians aged 16–22 have the least political knowledge,
compared with the two oldest age groups. On average, they answered two of
10 political questions correctly, while Gen Xers and Baby Boomers answered five of
10 questions correctly.
Political interest: Gen Zers report more frequently they are not interested at all or
somewhat uninterested in politics and public affairs (43%), compared with those aged
23–34 (30%) and 35 and over (24%).
10 Feeling of political competency: Young Canadians feel less politically competent.
Gen Zers and Millennials have relatively equal levels of political confidence and tend
to agree somewhat with the statement “politics and government seem so
complicated that a person like me can’t understand what’s going on,” while Canadians
aged 35 and over are less likely to agree with this statement.
Media consumption
Gen Z tend to have distinct news consumption patterns compared with older Canadians:
Canadians aged 16 to 22 follow the news much less frequently than older Canadians.
For example, roughly 25% of them report that they never check the news, and close
to half of them only check the news once or twice a week.
The most-used media consumption outlet for younger Canadians is social networking
applications (52%), followed by television and web apps on mobile devices. For older
Canadians, television is the number one source of information (69%), followed by—
relatively equally—print media, radio, web apps on mobile devices, and information
found on social networks.
Gen Z—the first generation to have grown up with smartphones—displays relatively
equal levels of trust in traditional journalism and news posted on social media, unlike
the two older age groups, who trust traditional journalism more.
Social resources
The first two points of this section only compare underage and adult Gen Zers:
Political discussion in social networks: The only difference between the two youth
groups is that those aged 16–17 discuss politics more frequently with their teachers
than those aged 18–22 do.
Civics courses and mock elections: Respondents aged 16–17 were significantly more
likely to report having participated in a mock election at school (52%), compared with
those aged 18–22 (43%). Those aged 16–17 were also significantly more likely to
report having taken civics courses in high school (81%), compared with those aged
18–22 (71%).
Contacts with political parties: There is a substantial and significant gap in the
mobilization of Canadians. Less than 30% of young Canadians under the age of
35 reported having been in touch with political parties or candidates during the
2019 campaign, while about 40% of Canadians aged over 35 said they had been in
touch with a party or a candidate.
Attitudes towards the electoral process
Duty to vote: Canadians aged 35 and over agreed with the statement that voting is a
duty 60% of the time, while Millennials and Generation Z agreed just half the time
that voting is a duty, rather than a choice.
Trust in Elections Canada: The survey reveals that Elections Canada is one of the most
trusted institutions by Canadians. Gen Xers and Boomers display the highest level of
11trust in Elections Canada (with a trust score of 0.65), compared with Millennials and
Gen Zers (with trust scores of 0.55 and 0.56 respectively).
Interest in working at a poll: 34% of those aged 16–17 and 39% of those aged 18–22
were somewhat interested in working at a poll, and 36% and 31% of them,
respectively, were very interested.
Youth registration: 50% of Gen Z would prefer to use an online form, either at school
or at home, to register before they are 18. Another 15% of them would register at
school using a paper form. However, close to one-quarter of Gen Zers are not
interested in registering to vote.
Ease of voting in a federal election: The oldest age group of Canadians—those who
are the most likely to vote—are also the most likely to agree with the statement that
“voting is easy.” By contrast, only 33% of Millennials and adult Gen Zers agree
somewhat that voting is easy, and just 22% agree strongly. Underage Generation Z
youth are unsure about the ease of voting: 40% are undecided as to whether voting
seems easy or not.
Lowering the voting age to 16: 50% of Canadians aged 16–17 support lowering the
voting age, while less than 25% of Canadians aged 35 and over support this idea.
Political and civic behaviours
Climate actions: Canadians of all ages engage in an average of three actions to protect
the environment. Gen Zers and Millennials are more likely to share information online
about the environment and, to a certain extent, to reduce their meat consumption,
compared with Gen Xers and Boomers.
Turnout: Canadians aged 35 years or older report voting at rates substantially and
significantly higher (80%) than those aged 23–34 (62%) and 18–22 (52%). Underage
Gen Zers (who were 16 and 17 years old at the time of the election) displayed high
intentions of voting in 2019: 70% said they were certain they would have voted had
they been eligible.
A regression analysis explaining intentions of electoral participation by those
aged 16 to 17 and self-reported participation for those aged 18 to 22 reveals the
importance of several explanatory factors:
– Visible minority status: For adult youth, the predicted probability of electoral
participation of non-white respondents was lower than that of white respondents.
– Political discussions: More frequent discussions with friends has a positive effect
on intended turnout for underage youth. Increased political discussions with
teachers has a negative association with predicted turnout for adult youth;
however, the association is positive for underage youth.
– Information search: Searching for political information during the electoral
campaign has a positive association with turnout for adult youth.
– Civic duty, political interest, perception of the ease of voting: The belief that voting
is a duty, one’s level of political interest, and the perception that voting in a
federal election is easy are all positively associated with predicted probabilities of
intended and self-reported turnout for the two youth groups. However, these
12associations are always larger and more statistically significant for underage
youth.
Campaign activities: The differences in campaign engagement between the four
different age groups are not very stark. For example, approximately 45% of all age
groups watched at least one of the leaders’ debates, and 10 to 15% of youth said they
attended a political debate organized at their school or university. However, the
oldest age group was still more likely to search for information about parties and
candidates (roughly 40% of those aged 35 or more, compared with 10–20% of the
three younger age groups). However, Gen Z and Millennials were more likely to use
the Vote Compass and to attend an information session on the election.
Non-electoral forms of participation:
– Young Canadians are more active than older Canadians: The 16–17 and
18–22 age groups reported having done, on average, 3.5 of 9 non-electoral
political actions in the past year, compared with an average of 2.8 actions for
those aged 23–34 and 2.3 actions for Canadians aged 35 or older.
– The patterns of activism were different across age groups. For example, youth
aged 16–22 are significantly more likely to raise or donate money for a cause, to
volunteer for organizations, and to have taken part in both environmental and
political protests or marches, compared with the two older groups. Generally,
youth between 16 and 34 were more likely to sign petitions, to boycott or buycott
products, and to share political information online. The only form of political
participation in which Canadians aged 35 and over were most active is in
contacting public or governmental officials.
13Introduction
In 2019, a new generation of Canadians became enfranchised: Generation Z. Members of
this generation—those born after 1997—were eligible to vote for the first time during the
2019 federal election. As this new generation is bound to occupy a more prominent place
in Canadian society and politics in the coming years, and as more members of Generation
Z become eligible to vote throughout the next decade, we may wonder: Who are
Generation Z’s members? What do they believe in? How do they get involved in society?
And how do these youth compare with older Canadians?
As Generation Z is just coming of age, studies on this generation and its characteristics
are still scarce (Kaplan 2020; Montigny and Cardinal 2019), and the few published studies
mostly examine American youth (Dimock 2019; Parker, Graf and Igielnik 2019; Igielnik and
Parker 2020). Thus, more research is needed to learn about Generation Z, notably in
Canada, and particularly as it relates to their political engagement and participation,
including electoral participation.
In this context, we undertook a research project on generations and the impacts of
generational change on the political dynamics in Canada. We specifically looked at two
groups within Generation Z (aged 16– 17 and 18–22) and how they compared with older
generations. This research is funded by the Social Sciences and Humanities Research
Council. As part of this research, we conducted a survey of Canadians after the 2019
federal general election, related to their political engagement and voter participation.
As part of its mandate, Elections Canada commissioned this report to examine the types
and levels of knowledge, experience, perceptions, opinions and attitudes of Canadians
aged 16 to 17 in relation to electoral matters and how they compare with older age groups
in Canada. Electoral matters of interest to Elections Canada included civic education,
registration of youth, communications services, innovation, outreach and stakeholder
engagement, election administrator recruitment, and digital and elector information
services.
Based on our Canadian survey, fielded just after the 2019 federal election, this report
offers a perspective on Generation Z, also referred to by some as the “iGeneration”
(Dimock 2019; Austin, Clark and Sigmar 2018; Fenton 2020; Linnes and Metcalf 2017), in
comparison with members of different generations. These include Millennials (aged 23 to
34) as well as Generation X and Baby Boomers (both comprising those aged over 35). By
comparing these groups, we assess whether Generation Z is distinct in terms of beliefs,
values, engagement and participation, or if it resembles older generations of Canadians.
This report also looks at two groups of Generation Z: those who were eligible to vote for
the first time in 2019—young adults aged 18 to 22—and those who will soon be eligible
to vote, youth aged 16 and 17. While these two groups of youth are still in their formative
14years and their political orientations may evolve, they may nonetheless display
distinctive, long-lasting characteristics that are representative of the context in which
they grew up. Members of Generation Z experienced the financial crisis of 2008 (even if
indirectly through their parents’ financial difficulties); they faced the rise of the platform
economy; they were the first to grow up with mobile technologies; and they were raised
in a world increasingly accepting of the LGBTQ2 community (Reinikainen, Kari and Luoma-
aho 2020). All of these events and societal experiences may be key to shaping Gen Z’s
worldview and relationship to politics. Getting to know these two groups of Generation Z
and their characteristics may help us envision the types of citizens and the views that will
be part of Canadian society and politics in the coming years and decades.
Better knowledge about the difference or resemblance between younger and older
generations, and within Generation Z, can help everyone involved with the political
engagement and participation of youth to tailor their programs and information to the
needs and preferences of contemporary youth, thereby increasing their potential
effectiveness.
The objective of this report is mainly descriptive: We present and describe some of the
attitudinal orientations and patterns of Generation Z’s political participation and compare
them with those of older age groups. We hypothesize about why certain differences or
similarities between generational groups are observed, based on the literature on
generational replacement and the life cycle approach. Ascertaining the differences
between generations would require longitudinal data (with surveys following members
of the different generations over several years). In the absence of such data, we must
remain cautious about the interpretation of differences or similarities between age
groups and their implications for Canadian society.
First, we present a section on the social and political orientations of Generation Z (or
Gen Z), starting with observations about their levels of trust in people and their attitudes
towards materialism. We continue with a presentation of Gen Z’s political attitudes,
including their levels of trust toward various institutions, political cynicism, satisfaction
with democracy, how they envision decision-making in a democracy and their partisan
identity.
In the second section, we focus on Gen Z’s political engagement. We present both
descriptive information and some explanatory models of their involvement with politics,
the political resources they have, the influence of different socialization agents in their
lives, and how they consume news.
The third section presents descriptive information and some explanatory models about
how youth engage with the electoral process, as well as the forms of civic and political
behaviours they engage with.
15We conclude with a summary of the results and discussion, and close with a set of
recommendations for Elections Canada and for public institutions, such as political
parties, schools, and civil society organizations who work on civic and voter engagement,
especially those who work with and for youth.
16Survey and Data
To provide an in-depth portrait of Generation Z’s political attitudes and behaviours and
compare them with those of older generations of Canadian voters, we conducted an
opinion survey in the weeks following the 2019 federal election, which took place on
October 21. The aim of this survey was to document Canadians’ values and attitudes on
multiple political issues, as well as the extent to which they participate in politics. The
survey was completed online via the Qualtrics platform, with data collection running from
November 13, 2019, to January 16, 2020. The median completion time was 21 minutes.
The survey questions can be found in this report’s appendix.
The total number of survey respondents was 4,287, including an oversampling of youth
aged 16 to 19. Qualtrics recruited the panel respondents. By using a non-probabilistic
sample with sampling weights, we are able to achieve a better representation of the
Canadian population. Our weights were calculated using the 2016 Canadian Census data
regarding age, gender, education, and province of residence, and are applied to all our
data analyses herein.
In our analysis, we divide the survey’s sample into four age groups (or cohorts).
Respondents from Gen Z who were not eligible to vote in the 2019 federal election are
treated separately from those who were eligible. Hence, the first two cohorts include
respondents born between 1997 and 2001 (aged 18–22 at the time of the survey and
eligible to vote, N=610) and those born in 2002 and 2003 (aged 16–17 and not yet eligible,
N=500). The third cohort comprises respondents aged 23 to 34. These individuals were
born between 1985 and 1996 and belong to the Millennial generation (N=591). The
remainder of the sample—individuals born before 1985 (aged 35 and over)—constitutes
the fourth and final cohort. This group is made up of some older Millennials, but mostly
members of Generation X and the Baby Boomer generation (N=2,586). Combining the
two older generations allows us to focus more on Gen Z and on the difference between
the youngest voters and everyone else. Having only four age groups makes the
comparisons between them, and the graphical representation of these comparisons,
simpler and clearer.
The analytical strategy we use in this report primarily involves describing political
attitudes and behaviours across the various cohorts.1 Most of the time, we compare three
cohorts (Gen Z, Millennials, and Gen X together with Boomers) since our report mainly
focuses on Generation Z as a whole and how it differs from the two older cohorts. That
said, at some points in the report it is useful to differentiate, within Generation Z, between
youth who will soon be eligible to vote (aged 16–17) and youth who are newly eligible to
1
These analyses include both citizens and non-citizens. The great majority of survey respondents are
citizens, as can be seen in Figure 1 (more than 97% among respondents aged 35 and over, and 92%
among those aged 16–22 and 23–34).
17vote (aged 18–22). Beyond descriptive statistics, we also rely on multiple regression
analyses to examine relevant correlates of political interest and electoral participation.
Before delving into a descriptive portrait of Gen Z’s social and political attitudes, it is
useful to look at the ethnocultural makeup of the sample. Previous research has found
that Millennials tend to be more ethnoculturally diverse than Gen Xers and Boomers,
which is indeed what we found in a previous study of ours conducted in Quebec (Mahéo
and Bélanger 2018). Figure 1 provides a summary of the three cohorts’ origins and
language.2 Generation Z proves to be more diverse than Millennials, continuing the trend
towards greater ethnocultural diversity over time among Canada’s population. Those
aged 16–22 are significantly less likely to be born in Canada, as compared with those aged
35 years or more. Together with those aged 23–34, they are also less likely to hold
Canadian citizenship and more likely to be a visible minority.
With regard to language, members of Gen Z are significantly more likely than the two
older cohorts to have a mother tongue other than English or French, and to speak a
language other than English or French at home. They are also slightly less likely than
Gen Xers and Boomers to have French as their mother tongue or as their language of use
at home. These results are important to keep in mind because they suggest that some of
the generational differences we find in this report (e.g. more openness to diversity among
Gen Z) are partly explained by the sociodemographic composition of the newest
generations.3
2
The bars displayed in Figure 1, as well as in many of the other figures found in this report, include black
lines at their tip that depict the 95% confidence interval. The black line thus shows the interval (or range)
within which we can be 95% certain that the group average, as estimated from our sample and
represented by the bar, corresponds statistically to the actual value found in the population.
3
More information on the profile of the survey respondents can be found in Table 1 of Appendix 1.
18Figure 1: Socio-demographic characteristics of three generations of Canadians (with 95%
confidence intervals)
19Social and Political Orientations
This first section presents the social and political orientations of Generation Z and how
they compare with those of Millennials, Gen Xers and Boomers.
1. Social attitudes
a. Trust toward others
A standard survey item measures respondents’ general trust in other individuals. It reads:
“Generally speaking, would you say that most people can be trusted, or that you need to
be very careful when dealing with people?” The answers reveal a relatively low level of
generalized trust, with a mean score of 0.46 on a scale where 0 corresponds to the belief
that we need to be careful with people and 1 indicates the belief that most people can be
trusted.
Responses to this question vary significantly by generational cohort (Figure 2). Those
35 years and older report higher generalized trust levels than the three other age groups.
The gap in trust scores between those born before 1985 and the other groups is slightly
under 10 percentage points. Older cohorts in the sample show more trust in people, in
general; however, it is unclear whether this finding is due to a life-cycle effect or a genuine
generational effect.
Figure 2: Levels of generalized trust, by age group (with 95% confidence intervals)
20b. Materialism
Beliefs associated with the accumulation of goods and wealth are a value dimension
where generational differences may be observed. Baby Boomers are often depicted as
being less materialistic in their outlook, whereas newer generations are often expected
to have developed views more sympathetic to materialism, either due to the more
difficult economic context in which they grew up (compared with Baby Boomers) or as a
reaction to the values held by their elders.
We rely on a six-item measure of materialism to examine differences in materialist values.
These items relate to materialism’s centrality to one’s life, the happiness that materialism
brings to one, and the equation one makes between materialism and success in life
(Richins 2004). Figure 3 presents the average scores, by cohort, on these measures. Scores
increase from one age group to the other: Canadians aged 16–17 are the least
materialistic, while those 35 years and older are the most materialistic. The differences
across cohorts are neither very large nor statistically significant between those aged 16–
17, 18–22, and 23–34. Overall, these results suggest an explanation of the development
of materialist values that relates more to the life cycle: Older citizens have more material
comfort and can enjoy it, compared with younger citizens who are often students,
employed part-time or in precarious jobs, and who have not yet accumulated wealth, and
thus tend to focus less on material goods.
21Figure 3: Respondents' reported levels of materialism, by age group (with 95% confidence
intervals)
A similar pattern exists within our sample on the post-materialism scale. This measure
comes from the work of Inglehart (2008) and determines the priority that individuals give
to four different goals to be pursued by their nation. Two of these goals are deemed to
be materialist in nature (fighting rising prices and maintaining order in the nation) and the
other two are considered post-materialist (protecting freedom of speech and giving
people more say in important political decisions). Figure 4 displays the percentage of
respondents who give priority to different state goals. It shows that post-materialist
attitudes are more prevalent among those aged 16–17 and 18–22 (with no statistical
difference between these two groups), significantly less prevalent among those aged 23–
34 and especially among those aged 35 and older (with no statistical difference between
these two). This result is in line with Inglehart’s post-materialism thesis, according to
which each new generation is more post-materialist than the previous one.
22Figure 4: Preferences for state goals included in the post-materialist scale, by age group
(with 95% confidence intervals)
2. Political attitudes
a. Political trust
We asked all respondents how much they trusted different institutions central to
Canadian society: the police, the federal government, and their provincial government.
Responses range from 0, meaning the respondent does “not trust at all,” to 1, where the
respondent “trusts a lot” in the institution.
Overall, trust in the police was highest, with a mean of 0.64. By contrast, average levels
of trust are relatively low for political institutions within the Canadian population. Both
the federal government and the provincial government obtain trust scores below the
midpoint of 0.5, with scores of roughly 0.48 and 0.49, respectively. We also asked
Canadians whether they agreed or not with the following statement: “The federal
government can be trusted to protect the personal information of Canadians.” Canadians
are, on average, relatively neutral, neither trusting nor distrusting the federal government
to protect citizens’ personal information (and there are no differences in this type of trust
between the four age groups).
Figure 5 presents the average trust level by age group for each of the three institutions.
Again, we observe significant differences between the age groups. The main finding is
23that those aged 16–17 and 18–22 are more trusting of the federal and provincial
government than the two older age groups. Most of these age differences are statistically
significant; however, there is no significant difference in the levels of political trust
between those aged 16–17 and 18–22. For the police, the oldest cohort is the most
trusting (with a trust score of about 0.66), followed by the two Gen Z groups (with scores
of 0.62 and 0.64) and, finally, the Millennials (with a score of roughly 0.55).
Figure 5: Levels of trust in three institutions, by age group (with 95% confidence intervals)
b. Political cynicism
We examine cynicism through several questions related to external efficacy (i.e. the belief
that political actors are in tune or not with citizens). We asked respondents to tell us how
much they agreed or disagreed with the following three statements: “Members of
Parliament don’t care much about what people like me think,” “People like me don’t have
a say in government affairs,” and “Political parties are only interested in people’s votes,
not their opinions.” Levels of agreement were measured on a scale ranging from 0, or
“strongly disagree,” to 0.5, “neither agree nor disagree,” to 1, “strongly agree.”
Across the sample, Canadians tend to agree somewhat with these statements. However,
we find clear distinctions between Gen Z and older Canadians: Young Canadians are
less cynical.
As shown in Figure 6, there are no significant differences between the two age groups of
Generation Z, even if those aged 16–17 tend to be less cynical than those aged 18–22.
24Indeed, the main difference is found between Gen Zers and older Canadians, who are
slightly but significantly more likely to say that they agree somewhat that “members of
Parliament don’t care much about what people like me think” and that “political parties
are only interested in people’s votes, not their opinions.” For these two statements, we
observe a difference of approximately 5 percentage points between the two younger age
groups and the two older age groups.
For the final statement, “people like me don’t have a say in government affairs,” all age
groups are generally closer to a neutral position (i.e. neither agree nor disagree) and
differences between age groups are not all statistically significant. However, those aged
16 to 17 remain the less cynical group, especially when compared to those aged
35 and older.
Even if some scholars have talked about the rise of critical citizens, with younger
generations being less deferential to politicians and more critical of political actors (Norris
1999; Dalton 2008), the results presented here tend to support the findings of prior
research, where young Canadians are not the most politically cynical group of citizens
(Mahéo and Vissers 2016). The generational explanation may point to the fact that overall
and over time, citizens become more cynical, but the age difference found among
Canadians in 2019 may point to a life cycle explanation. Eighteen-to-22-year-olds, and
especially 16-to-17-year-olds, have less experience with political institutions than older
Canadians, and thus have had fewer opportunities to be disappointed by political actors
and their actions.
This does not negate the possibility of today’s youngest voters being less deferential to
politicians and more critical of political actors than the young voters of prior decades.
Having access to panel data and being able to re-interview the same respondents over
the years would allow us to examine whether citizens become more cynical and
disenchanted as they grow older and as they have more interactions with political
powers, and to compare generations at the same point in their life cycles.
25Figure 6: Levels of cynicism expressed about political parties and institutions, by age
group (with 95% confidence intervals)
c. Satisfaction with democracy
While in the previous section we found mild feelings of cynicism, Canadians are
nonetheless somewhat satisfied with the way democracy works in Canada. In fact,
Canadians rank their level of satisfaction with democracy above the mid-point (on a scale
from 0 for “not satisfied at all” to 1 for “very satisfied”), at roughly 0.6. Here again, we
find that Gen Z is slightly more positive towards politics than the two older age groups,
with an average satisfaction level of 0.65 compared with 0.58 and 0.59 for Millennials and
GenX/Boomers (the differences between age groups are statistically significant). As in the
previous section, the life cycle explanation, linked to the youngest generation’s lack of
political experience, might explain why today’s youth evaluate Canadian democracy more
positively.
d. Who should make policy decisions in democracy?
While in the previous section we assessed citizens’ satisfaction with the current state of
Canadian democracy, we also wanted to know whether citizens would like democratic
affairs to be conducted in a different way. So we asked Canadians whether they thought
citizens should be more involved in decision-making processes or if policy decisions
should be left to politicians.
26You can also read