Gas Market Report Q1-2021 - NET
←
→
Page content transcription
If your browser does not render page correctly, please read the page content below
Gas Market Report Q1-2021
Gas Market Report, Q1-2021                                                                Abstract

Abstract
Global gas demand fell by an estimated 2.5% or 100 billion cubic metres
(bcm) in 2020 – its largest drop on record. Amid this slowdown, gas
demand for power generation remained resilient owing to fuel switching,
while the whole supply chain showed strong flexibility in adjusting to
demand variations. Gas trade globalisation progressed with increasing
liquidity, while prices experienced historical lows and extreme volatility.
The Covid-19 crisis and a well-supplied market put investment on hold,
whereas gas market reforms and clean gas policy initiatives gained
momentum in major consuming markets.
2021 opens with price rallies in Asia and Europe as rising winter demand
tightened supply, but the price spikes are not expected to last beyond the
short-term cold snaps given that market fundamentals for 2021 remain
fragile. Global gas demand is expected to recover its 2019 level but with
uncertainties regarding the recovery trajectory of fast-growing markets
compared with more mature regions. Sectoral demand, on the other
hand, is subject to a variety of risk factors including fuel switching, slow
industrial rebound or milder weather.
This new quarterly report offers a detailed analysis of recent
developments in global gas markets and the near-term outlook, and
includes an overview of the main market highlights for 2020.

                                                                                                     IEA. All rights reserved.
                                                                               PAGE | 2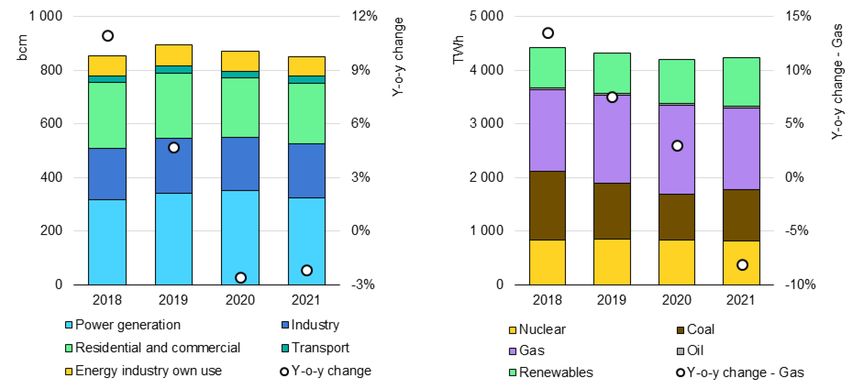
Gas Market Report, Q1-2021                                                                                                     Table of contents

Table of contents
Gas market highlights 2020 ........................................................................ 5
Gas market update and short-term forecast ............................................ 18
Annex ........................................................................................................ 44

                                                                                                                                                   IEA. All rights reserved.
                                                                                                                    PAGE | 3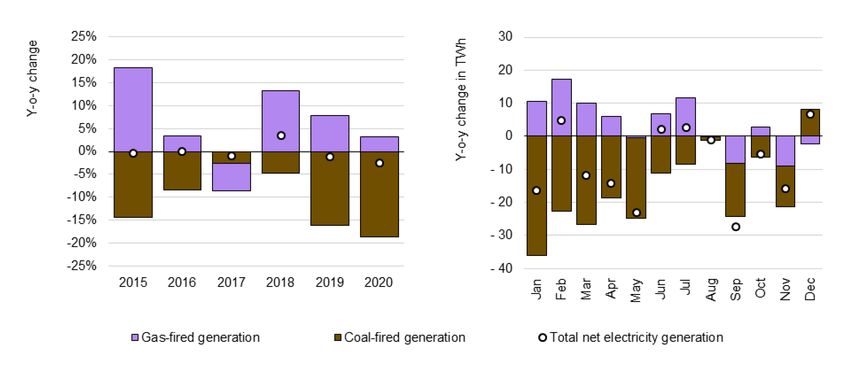
Gas Market Report, Q1-2021 Introduction
Winter has come, yet gas demand recovery remains fragile for 2021
After an unprecedented drop in natural gas demand 2020 closed with a liquefaction plants, which increased the call on more remote suppliers.
rapid recovery in gas prices as a rise in winter demand tightened supply. Longer voyages and congestion at the Panama Canal spiked spot charter
A similar pattern held in the first weeks of 2021 with cold snaps bumping rates to historical highs of more than USD 230 000/day – reportedly one
gas prices in Europe to their high winter levels and spot LNG prices in prompt vessel was contracted at USD 350 000/day.These price spikes
Asia broke historical records. This tight market episode was driven by are not expected to last beyond the short-term cold wave, as market
short-term factors, whereas the fundamentals remain uncertain and fundamentals for 2021 remain fragile.
potentially challenging for global gas demand recovery in 2021.
Under pressure
Global gas markets experienced their largest recorded drop in 2020,
with an estimated 2.5% year-on-year (y-o-y) decrease in consumption This forecast expects global natural gas demand to grow 2.8% in 2021
(about 100 bcm).This was triggered by exceptionally mild weather in the (about 110 bcm), slightly above the 2020 decline, thus enabling a
early months and the onslaught of the Covid-19 panademic; impacts were recovery to the 2019 level. This is a far cry from the 7.5% y-o-y post-2009
concentrated in the first-half of the year which saw a 4% y-o-y decline in financial crisis rebound observed in 2010. This projection comes with two
global gas demand. Progressive recovery was observed in Q3 as main caveats:
lockdown measures eased, seasonal electricity demand pushed up All regions are not equal when it comes to gas market recovery. Mature
demand along with competitive gas prices. However, the beginning of markets bore the brunt of demand drop in 2020, while emerging
the heating season in the northern hemisphere was less supportive with markets will be the main drivers of demand growth in 2021. Fast-
very mild temperatures in Europe and North America in October and growing markets in Africa, Asia, Central and South America and the
November. Middle East are projected to account for about 70% of global demand
growth in 2021. Mature markets are likely to see a more gradual recovery
A cold open to 2021 though some may remain below their 2019 demand levels.
Colder temperatures in December 2020 marked the start of a gas price The sectoral pillars of growth are all subject to major uncertainties. Gas
rally amid tightening LNG supply. Spot LNG prices in Asia more than burn in power generation is expected to be hampered by slow
tripled to above USD 30/MBtu by the start of January 2021, with some electricity demand growth and increasing inter-fuel competition as gas
prices recover from their 2020 lows. Gas consumption in the industry is
cargoes reportedly awarded close to USD 40/MBtu; breaking the record
strongly dependent on economic recovery, especially for Asia’s export-
price levels in the aftermath of the Fukushima nuclear accident in 2011.
driven industries. Residential demand received support from cold
Rather than a single event, the recent spike reflects a combination of
temperatures so far, but would be negatively impacted in case of a
supply and demand factors. LNG demand in northeast Asia increased 10%
return to milder weather conditions.
y-o-y between mid-December 2020 and early January 2021 due to colder
than average winter temperatures, exacerbated by lower nuclear Global gas demand recovery in 2021 is uncertain. Demand is subject to a
availability in Japan and limits on coal-fired generation in Korea. The rise variety of risk factors including fuel switching, slow industrial rebound
and mild weather which can moderate consumption.
IEA. All rights reserved.
in LNG demand in Asia coincided with a number of outages at regional
PAGE | 4
Gas Market Report, Q1-2021              Gas market highlights 2020

Gas market highlights 2020

                                                                     IEA. All rights reserved.
                             PAGE | 5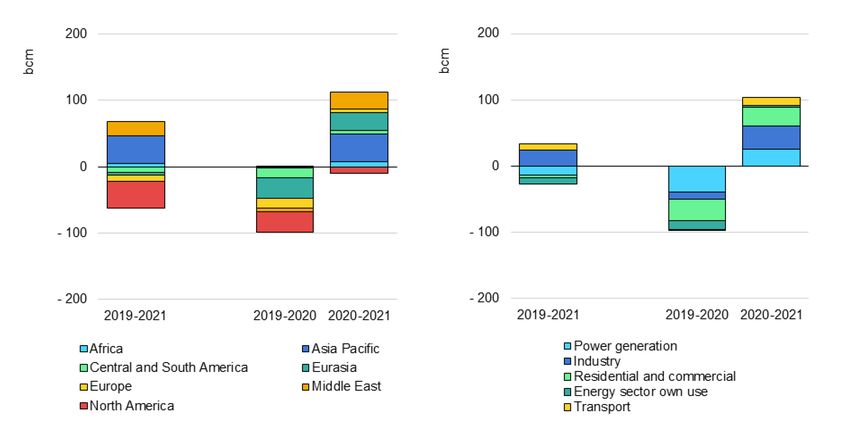
Gas Market Report, Q1-2021                                                                                                                  GasGas Executive
                                                                                                                                                   market
                                                                                                                                                market         summary
                                                                                                                                                          highlights
                                                                                                                                                        highlights   2020
                                                                                                                                                                    2020

Gas demand for power generation was resilient thanks to fuel switching
Natural gas use in power generation fell an estimated 2% y-o-y worldwide                      sector. Coal-to-gas switching continued throughout the year in Korea, with
in 2020. This is in line with total electricity demand and despite that output                record gas burn in September.
from renewables was up 6.6%. Cheap and abundant supply favoured gas in                        In the Russian Federation (hereafter “Russia”), thermal power generation fell
the merit order at the expense of coal in several markets.                                    10% y-o-y in the January-October period, squeezed by a 3.7% drop in
Abundant US production supported an increase in gas-fired power                               electricity demand and a 12% increase in hydropower output. Coal-fired
generation in North America. In the United States, gas-fired generation                       power generation fell more than 13%, while gas-fired power generation
increased 3% in 2020 while overall electricity output was down 2% and                         decreased approximately 10%.
coal’s share plummeted by 19%. In late July, gas reached a record share of                    Thermal generation also fell in South America on favourable hydro
45% of electricity generation in the United States. In Mexico, total electricity              conditions combined with lower electricity demand. Gas-fired generation
output was lower than in 2019 for the first three-quarters of 2020, but gas-                  dropped 11% y-o-y in Brazil and 6% in Argentina over the first eight months
fired generation increased slightly at the expense of liquid fuels and coal.                  of 2020.
In Europe, gas-fired power generation rose through the second-half of                         In the Middle East, the squeeze on associated gas availability resulting from
2020. Following a steep decline of more than 10% in the first-half, gas-fired                 oil production cuts coincided with peak electricity demand in the northern
power generation rose by over 4% y-o-y in the third-quarter (Q3), despite a                   hemisphere summer. This led to a resurgence of oil use in power generation
4% fall in electricity consumption. This was partly driven by lower nuclear                   in some key oil and gas-producing countries.
availability due to plant retirements, maintenance work, unexpected
outages amid low river levels (for cooling purposes) and optimisation of fuel                 Limited prospects for increased gas-fired power
usage. Gas benefited from the combination of low prices and a sharp
recovery in carbon prices through Q3 2020, while coal-fired generation fell
                                                                                              generation in 2021, but policy measures provide
by more than 8% in Q3. Despite the recovery in gas prices to above 2019                       longer term support in emerging Asian markets
levels, gas-fired power generation rose 2.5% y-o-y in Q4, while power output
                                                                                              Prospects for increased use of gas in power generation may be limited in
from coal- and lignite-fired plants fell by close to 7%. This was primarily
                                                                                              2021 in some regions, particularly in mature markets. This reflects the
driven by Turkey, where gas-fired power generation increased 50% due to
                                                                                              expanding contribution of renewables to the power mix. As well, fuel price
depressed hydro availability and environmental restrictions on lignite-fired
                                                                                              projections suggest less competitiveness for natural gas and consequently a
plants.
                                                                                              potential rebound of coal in electricity generation in the United States.
Fuel switching trends are more mixed in other regions. In Asia, the People’s
                                                                                              Prospects for more use of gas in power generation are favourable in Asia.
Republic of China (hereafter “China”) saw a 2% y-o-y increase in gas-fired
                                                                                              They are fuelled by policies that support gas and LNG in power programmes
generation for the first eleven months of 2020, while electricity demand was
                                                                                              and that limit development of coal-fired generation, principally in South
up 2% and coal declined slightly. Gas-fired generation in India increased 9%
                                                                                              Asian and Southeast Asian economies. Recent announcements are noted in
in 2020 thanks to cheap LNG spot prices, while coal declined 5%. Falling oil-
                                                                                              Bangladesh, Viet Nam, Thailand, Myanmar and the Philippines.

                                                                                                                                                                              IEA. All rights reserved.
linked LNG prices provided tougher competition for coal in Japan's power

                                                                                   PAGE | 6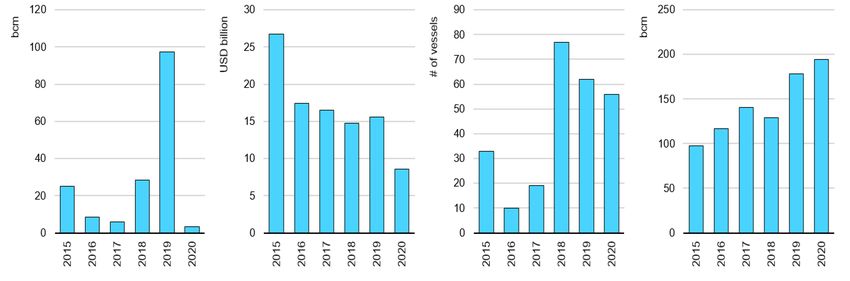
Gas Market Report, Q1-2021                                                                                            GasGas Executive
                                                                                                                             market
                                                                                                                          market         summary
                                                                                                                                    highlights
                                                                                                                                  highlights   2020
                                                                                                                                              2020

Gas-fired generation in the United States rose as total electricity demand fell and coal-fired
generation plummeted in 2020
               Annual electricity generation in the United States,                   Monthly electricity generation in the United States, 2020
                                 2015-2020

                                                                                                                            IEA. All rights reserved.

                                                                                                                                                        IEA. All rights reserved.
Sources: IEA analysis based on EIA (2020), Electric Power Monthly, US Electric System Operating Data.

                                                                          PAGE | 7
Gas Market Report, Q1-2021
                                                                                                                                         GasGas Executive
                                                                                                                                                market
                                                                                                                                             market         summary
                                                                                                                                                       highlights
                                                                                                                                                     highlights   2020
                                                                                                                                                                 2020

Gas value chain demonstrated strong supply flexibility
Long-distance and inter-regional gas pipeline trade bore the brunt of the                    Between June and December, global LNG supply increased by 25%. US
supply adjustment in the face of lower demand with an estimated 15%                          LNG output fully recovered and ran at record levels by the end of 2020,
(40 bcm) y-o-y contraction in trade flows. A steep fall in pipeline exports                  but the rest of the world – led by Russia, Australia, Malaysia, Egypt and
moderated as from June, supported by increased demand and lower LNG                          Oman – also posted strong gains, together accounting for half of the net
inflow. North African flows rose 8% through the second-half of 2020,                         increase in LNG exports over the June to December period.
while Russian flows returned to 2019 levels in Q4.
Pipeline imports to Europe decreased by 13% (30 bcm), primarily due to                       LNG tanker fleet helped balance a heavily
lower inflows from Russia and North Africa. This compares with a decline
of 13% (28 bcm) in 2009, when European gas demand was depressed by                           oversupplied market
the financial crisis. Pipeline flows fell 22% y-o-y in the first five months of
                                                                                             LNG floating storage volumes remained at elevated levels during the first
2020, at a time when flexible LNG was increasingly diverted to Europe
                                                                                             three-quarters of 2020, and, at times, absorbed more than 10% of
amid subdued demand in Asia. This highlights the crucial balancing role
                                                                                             monthly LNG trade in Q2. In Q4, LNG floating storage levels were
of Europe in the global gas market.
                                                                                             relatively subdued and below the average of the previous year. The shift
In Asia, China decreased its import flows from Central Asia by 14%                           reflects the simultaneous tightening of global gas and LNG shipping
(6 bcm) y-o-y in the first eleven months of 2020, with Turkmenistan                          markets from September. As demand picked up in Asia, regional price
accounting for three-quarters of the reduction.This supported China’s                        spreads widened and long-distance trade expanded quickly. US cargo
strategy to increase spot LNG purchases and accommodate the gradual                          cancellations, which previously kept the LNG shipping market relatively
ramp up of the Power of Siberia pipeline (reaching 4.1 bcm in 2020).                         loose, all but disappeared by the end of 2020. Daily spot LNG charter
Global LNG supply proved its flexibility in the face of market oversupply,                   rates rose above the USD 100 000 mark by the end of October and
which hit its peak during the summer months of 2020. Global LNG                              approached USD 200 000 as the year drew to a close. The monthly cost
exports fell by 22% between January and June 2020 – much steeper than                        of floating LNG storage increased more than fivefold between June and
the 5-7% seasonal swing normally observed during this period. The United                     December 2020 from less than USD 0.3/MBtu to more than
States, which emerged as the world’s largest swing supplier of LNG in                        USD 1.3/MBtu. The steep tightening of inter-month price spreads
2020, accounted for a third of the downward adjustment in global LNG                         diminished the economic incentive to keep LNG on the water for longer
exports. A wide range of other producers – including Malaysia, Oman,                         than necessary during much of Q4.
Trinidad, Egypt and Indonesia – also responded to the pandemic-induced
drop in demand with supply curtailments. The second-half of 2020 saw a
sharp recovery as LNG export volumes gained momentum in Q4.

                                                                                                                                                                         IEA. All rights reserved.
                                                                                  PAGE | 8
Gas Market Report, Q1-2021
                                                                                                                             GasGas Executive
                                                                                                                                    market
                                                                                                                                 market         summary
                                                                                                                                           highlights
                                                                                                                                         highlights   2020
                                                                                                                                                     2020

Supply flexibility at play during the Covid-19 crisis
                                             Inter-regional natural gas trade, 2020 relative to 2019

                      Q1

                      Q2

                      Q3

                      Q4

                         - 20       - 15           - 10           -5                 0          5             10             15             20
                                                                                                                      Y-o-y change (bcm)

                                    Pipeline imports - Europe       LNG imports - global        Pipeline imports - China

                                                                                                                                   IEA. All rights reserved.
Sources: IEA analysis based on ENTSOG (2021), Transparency Platform; Eurostat (2021), Imports of natural gas by partner country - monthly data; China
Customs Office (2021), General Administration of Customs of People’s Republic of China (2021), Customs Statistics; ICIS (2021), ICIS LNG Edge.

                                                                                                                                                               IEA. All rights reserved.
                                                                          PAGE | 9
Gas Market Report, Q1-2021                                                                                                            GasGas Executive
                                                                                                                                             market
                                                                                                                                          market         summary
                                                                                                                                                    highlights
                                                                                                                                                  highlights   2020
                                                                                                                                                              2020

An increasingly liquid global gas market is emerging…
The global gas market continued to gain in depth and liquidity in 2020                  In the United States, volumes traded on the Henry Hub in 2020 rose by
despite shrinking demand. This reflects expanding volumes of LNG traded                 more than 15% y-o-y.
on the spot market and a substantial rise in volumes traded on regional                 In Europe, gas traded on the region’s major hubs expanded 13% y-o-y in
gas hubs.                                                                               the first eleven months of 2020, largely driven by the 19% volume
LNG volumes traded on spot and short-term basis continued to rise in                    increase on the TTF hub in the Netherlands. TTF’s share in total European
2020. Preliminary shipping data suggest an increase close to 8% to                      gas trade rose from 66% to over 70%, further cementing its position as
account for 37% of global LNG trade – its highest share on record. Short-               Europe’s leading gas hub. Yet, volumes traded on the TTF are more than
term volumes were driven up by higher net selling positions of portfolio                ten-fold lower than the US Henry Hub volumes traded on the NYMEX.
players and uncontracted commission cargoes. In contrast, the share of                  Another important development in Europe has been the increasing share
volumes traded under long-term contracts has been declining and was                     of volume traded on exchanges, from one-third in 2019 to 38% in 2020,
further depressed due to cargo cancellations through the third-quarter.                 which typically offer more standardised products, rather than via
The United States continued to be the largest source of flexible LNG,                   brokerages.
with a 20% share of spot and short-term volumes, which account for over                 In Asia, trading in ICE JKM derivatives continued to increase in 2020,
half of incremental supply of spot and short-term LNG. This is largely                  jumping almost 60% y-o-y.This shows growing interest from market
driven by the ramp up of new liquefaction facilities, including Cameron                 participants to diversify price risk management strategies along the
Train 2 and 3, and Elba Island.                                                         continued trend of LNG commoditisation.
China and India remained the world’s largest buyers of short-term and                   Marketing strategies of traditional players may evolve towards increased
spot LNG, with respective market shares of 20% and 11%. Buyers in China                 focus on the short-term, amid the expanding liquidity of global and
were particularly keen to benefit from the low spot prices through 2020                 regional gas markets. Gazprom sales via auctions (for intra-annual
and increased purchases more than 50% y-o-y under short-term contracts                  deliveries) increased by 30% in 2020 compared to 2019, representing
and spot LNG, which offset more expensive sources of supply, including                  more than 10% of its exports to Europe. In November 2020, Qatar
piped imports from Central Asia. China alone accounted for 40% of gross                 Petroleum announced the establishment of its trading arm, QP Trading,
growth in spot and short-term LNG trading.                                              with a mandate to build a globally diversified portfolio and manage price
In Europe, Turkey increased purchases of short-term and spot LNG more                   risk exposure via physical and derivatives trading.
than 50%, largely at the expense of piped imports from Iran and Russia,                 Carbon-neutral LNG continued to gain traction, with at least seven carbon-
especially during the first-half of 2020.                                               offset cargoes delivered in 2020. Singapore’s Pavilion held the world’s first
Traded volumes on all major regional gas hubs increased. This highlights                LNG tender that included a bidder’s obligation to quantify greenhouse gas
the increased appetite of market players to hedge positions along the                   emissions associated with each LNG cargo.The tender was won by QP
forward curve.                                                                          Trading, which signed a ten-year production sharing agreement in

                                                                                                                                                                        IEA. All rights reserved.
                                                                                        November 2020.

                                                                            PAGE | 10
Gas Market Report, Q1-2021 GasGas Executive
market
market summary
highlights
highlights 2020
2020
…with LNG traded on spot and short-term basis reaching new highs
Spot and short-term LNG volumes in total trade, 2015-2020 Traded volumes on Henry Hub and TTF, 2019-2020
600 60%
Share of spot and short-term volumes
bcm
6 000 600
Henry Hub (bcm)
TTF (bcm)
50%
5 000 500
400 40%
4 000 400
30%
3 000 300
200 20%
2 000 200
10%
1 000 100
0 0%
0 0
2015
2016
2017
2018
2019
2020
Nov-19
Nov-20
May-19
Jul-19
Sep-19
May-20
Jul-20
Sep-20
Jan-19
Mar-19
Jan-20
Mar-20
Spot and short-term volumes
Long-term contracts
Share of spot and short-term contracts
Henry Hub TTF
IEA. All rights reserved.
Sources: IEA analysis based on ICIS (2021), ICIS LNG Edge; GTS (2021), TTF Development; CME (2021), NYMEX/COMEX Exchange ADV Report – Monthly
Report.
IEA. All rights reserved.
PAGE | 11Gas Market Report, Q1-2021 GasGas Executive
market
market summary
highlights
highlights 2020
2020
Gas price roller coaster: historical lows, steep recovery and high volatility…
It was a roller coaster ride for regional gas benchmark prices in 2020. 40% y-o-y between September and November to an average of
Prices collapsed in all major gas consuming regions in the face of sharp USD 5.6/MBtu, despite strong gains in spot prices.
drops in demand. By late May, day-ahead prices on the TTF hub fell below Rising volumes of LNG supplies that are destination flexible increase
USD 1/MBtu and LNG spot prices in Asia dropped below USD 2/MBtu, liquidity of the global gas market and are underpinned by increased
both historic lows. In the United States, trades on the Henry Hub affiliation with regional gas hubs. This means that gas prices in a given
averaged USD 1.8/MBtu over the first-half of 2020 – the lowest price for market are becoming increasingly sensitive (and responsive) to the
this period since 1995. supply-demand fundamentals prevailing in regions beyond their
Conversely, gas benchmarks recorded strong gains through the third- immediate geographical reach.
quarter. Prices rose to above 2019 levels by the start of the heating The correlation between TTF and Asian LNG spot prices increased from
season. Increases in demand and supply adjustments along the gas value 0.86 in 2019 to close to 0.95 in 2020 – the highest annual level on
chain drove the recovery. TTF prices almost quadrupled through Q3 and record.The correlation was particularly strong through the second-half of
traded almost 25% higher y-o-y in Q4. LNG spot prices in Asia followed a 2020 driven by improving market conditions both in Asia and Europe, and
similar price trajectory, climbing above last year’s levels in Q4. Despite more active competition for LNG cargoes. Most importantly, the
the recovery, the annual average of TTF (USD 3.2/MBtu) and Asian (USD correlation between Henry Hub and TTF, and Henry Hub and Asian spot
4.2/MBtu) spot prices were historic lows. Price gains at Henry Hub were prices continued to increase to reach 0.81 and 0.76 respectively from
largely driven by rising LNG exports and lower production through the relatively low levels just two years ago. The rapid ramp up of US LNG
last quarter 2020, allowing the North American benchmark to return to exports – rising more than threefold since 2017 – underscores the
2019 price levels. Henry Hub prices averaged USD 2/MBtu in 2020, the increasing linkages between Henry Hub and other regional indices.
lowest price level since 1995.
In contrast, the correlation between oil and natural gas prices stayed well
Large price swings had wide seasonal spreads and high volatility below the 0.6-0.7 annual averages experienced between 2012 and 2016,
reflecting unprecedented market uncertainty that prevailed through the when oil prices had a stronger influence on Asian and European spot
year. Month-ahead volatility on both Henry Hub and TTF averaged 65% – prices.
the second-highest level for both since 2008.
The high correlation between regional natural gas prices in 2020 could be
Oil-indexed LNG prices recorded heavy losses through the second-half diminished by tightening of the global gas market or unexpected regional
of 2020, unlike the spot indices. The oil-premium (i.e. the estimated supply-demand shocks. However, the mechanisms underpinning the
difference between oil-indexed and spot prices) started to gradually rising liquidity of global gas trade – flexible LNG volumes and marketing
disappear after reaching a high of USD 7/MBtu in May and effectively strategies evolving toward optionality – are likely to be sustained and
turned negative by October – for the first time since September 2018. continue to support the expanding influence of regional gas hubs over
Oil-indexed LNG pricing dominates in the Asia Pacific market, where the time.
average LNG import price in China, Japan and Korea fell by close to
IEA. All rights reserved.
PAGE | 12Gas Market Report, Q1-2021
GasGas Executive
market
market summary
highlights
highlights 2020
2020
… hides the strengthening linkages of regional gas benchmarks
Natural gas spot prices, 2020 Correlation of key regional gas prices, 2018-2020
14 1.0
USD/MBtu
12
0.8
Correlation coefficient
10
0.6
8
6
0.4
4
0.2
2
0 0.0
Jan
Jun
Jul
Feb
Aug
Sep
Apr
Oct
Nov
Dec
May
Mar
2018 2019 2020
HH TTF Asian spot (EAX) EAX-TTF TTF-HH HH-EAX
IEA. All rights reserved.
Note: HH = Henry Hub; TTF = Title Transfer Facility; EAX = East Asia Index.
Source: IEA analysis based on ICIS (2021), ICIS LNG Edge.
IEA. All rights reserved.
PAGE | 13Gas Market Report, Q1-2021 GasGas Executive
market
market summary
highlights
highlights 2020
2020
Covid-related market uncertainty puts LNG supply investment on ice while investment in
shipping and receiving capacity is robust
The demand uncertainty related to the global pandemic and a historic oil in gas exploration is a structural trend, which has been fuelled by
market downturn put the brakes on new investment in liquefaction abundant unconventional resources (especially in the United States),
capacity and upstream gas exploration in 2020. However, LNG vessel concerns about stranded asset risk and monetisation challenges in a
orders and investment in LNG regasification projects continued at a crowded marketplace for pre-FID LNG projects. Exploration capex for
healthy clip. prospective gas plays in 2020 hit the lowest level in at least two decades.
Investment in new liquefaction projects stalled in 2020. After a record Orders for LNG carrier vessels held up relatively well. After a lacklustre
year for new final investment decisions (FIDs) in 2019, when nearly period in Q1-Q3 2020, order activity rebounded sharply in Q4 as the LNG
100 bcm of new liquefaction capacity was approved, new FIDs in 2020 shipping market tightened and spot charter rates skyrocketed. Fleet
were limited to a single train development (the 3.4 bcm Energía Costa operators ordered more than 50 new LNG carriers in 2020, about 40%
Azul project in Mexico).This marks the biggest annual drop in liquefaction more than the global five-year average, but well below the levels seen in
project approvals in LNG market history. This investment standstill was the bumper years of 2018 (77 orders) and 2019 (69 orders). The order
due to a combination of excess supply and low global gas price book could soon receive another boost as Qatar Petroleum recently
benchmarks, widespread capex cuts by the major national and announced that it had booked more than 100 slots at one Chinese and
international oil companies, uncertainty about future LNG demand related several Korean shipyards to meet the vessel requirements of its LNG
to the economic impacts of the pandemic, and a lack of buyer appetite expansion project. If fully executed, the plan would be the largest
for long-term LNG contracts. The collapse of investment activity raises shipbuilding programme in the history of LNG.
concerns about long-term supply availability. Investment in new LNG import capacity remained relatively strong in
Key development milestones, though not a FID, were reached in 2020 for 2020. At the end of 2020, about 194 bcm of regasification capacity was
Qatar Petroleum’s 64 bcm LNG expansion project, which could delay under construction, a 9% increase from the end of 2019. FIDs on as many
concerns of a post-2025 market tightening by several years. Nonetheless, as eight new regasification projects sustained a robust project pipeline
LNG capacity outages in 2020 indicate that supply availability cannot be throughout 2020. However, construction delays due to Covid-19 and
taken for granted even in a seemingly well-supplied market. For a brief project-specific issues pushed some anticipated project completions to
period in Q3 2020, for example, as much as 10% of global liquefaction 2021, which also contributed to the high level of under construction
capacity went offline due to unplanned outages (while another 3% of total capacity in 2020. Nearly two-thirds of new regasification capacity under
capacity was offline for planned maintenance), which contributed to a development is located in growth markets in Asia, where new
sudden LNG market tightening in the second-half of 2020. infrastructure is required to accommodate increasing gas demand.
Spending on gas exploration declined in 2020 amid fresh uncertainties
related to the global pandemic and its economic repercussions. The drop
IEA. All rights reserved.
PAGE | 14Gas Market Report, Q1-2021
GasGas Executive
market
market summary
highlights
highlights 2020
2020
Investment activity indicators
Liquefaction FIDs Exploration CAPEX LNG vessel newbuild orders Regasification capacity
under construction
IEA. All rights reserved.
Sources: IEA analysis based on Rystad Energy (2021), Gas Market Analytics; ICIS (2021), ICIS LNG Edge; GIIGNL (2021), Annual Report.
IEA. All rights reserved.
PAGE | 15Gas Market Report, Q1-2021 GasGas Executive
market
market summary
highlights
highlights 2020
2020
Gas market reforms and clean gas policy initiatives take off in 2020
Reforms to open gas markets gained momentum in 2020. This progress represents a significant step towards transparent market-based gas pricing,
can deliver benefits to economies as they recover from the pandemic and although traded volumes were negligible in the second-half of 2020. The
its economic consequences. The development of liquid wholesale gas national government enacted reforms to rationalise gas pipeline tariffs (by
markets typically fosters competition among suppliers, improves transitioning to a unified tariff structure from the previous distance-based
allocation efficiency and ensures transparent price discovery. system) and eased rules to set up LNG fuelling stations. It also approved
In Brazil, the Novo Mercado de Gas programme was officially launched in the creation of an electronic bidding platform where producers will be able
July 2019 to establish an open and competitive gas market. Petrobras, the to offer their output at market-based prices. India’s gas market regulator
country’s formerly vertically integrated oil and gas company, reached a extended third-party access to city gas distribution pipelines as exclusivity
settlement agreement with the anti-trust regulator, CADE, to fully divest periods (which run for a minimum of five years) expire. However, CNG
its participation in gas pipeline networks and to guarantee effective third- stations were excluded from third-party access provisions.
party access to its infrastructure, including LNG regasification terminals
and import pipelines. In August 2020, a proposed new law to further Clean gas policy initiatives
solidify the foundations of a competitive gas market with an entry-exit
Low-carbon hydrogen is garnering increased attention and a number of
system, full third-party access to gas infrastructure and a prohibition on
countries have announced related targets and strategies. Japan and Korea
vertical integration was approved by the lower house of Brazil’s
establised hydrogen roadmaps in 2019. The European Union’s hydrogen
parliament. In December 2020, the upper house rescinded the bill with
strategy set out in July 2020 aims to produce 1 Mt of green hydrogen by
amendments to the lower house for final approval.
2024 and 10 Mt by 2030. France, Germany, Spain and Netherlands have
China launched its new national pipeline company, PipeChina, on also launched hydrogen strategies. In Canada, Alberta’s Natural Gas Vision
30 September 2020. It marks a significant step towards improved third- foresees large-scale hydrogen production from natural gas with carbon
party access, better network integration and lower transmission tariffs. capture, utilisation and storage by 2030. Canada’s federal government
The reform may increase market competition, stimulate investment hydrogen strategy set out in December 2020 highlights the potential of
across the natural gas value chain and reduce the cost of gas to end- clean hydrogen to meet 6% of the country’s energy end-use by 2030 and
users. PipeChina has consolidated most of the long-distance gas to expand to 30% by 2050. Chile’s hydrogen strategy targets 5 GW of
pipelines as well as six regasification terminals and three underground electrolysers by 2025.
storage sites that were previously controlled by China’s three state-
The European Commission put forward a methane strategy in October
owned energy majors (PetroChina, Sinopec and CNOOC). The formation
2020. It focuses both on reducing methane emissions in the European
of PipeChina follows earlier reforms in July 2019, which removed the
Union and addressing methane emissions associated with supply chains
remaining ownership restrictions for foreign investors in China’s upstream
linked to the European Union. Legislative proposals including on
and downstream gas sector.
measurement, reporting and verification for all energy-related methane
India launched the Indian Gas Exchange (IGX) in June 2020, which is emissions are planned for 2021.
authorised to operate as a regulated gas exchange for 25 years. This
PAGE | 16Gas Market Report, Q1-2021 Gas market highlights 2020
Timelines for gas market reform are accelerating
IEA. All rights reserved.
IEA. All rights reserved.
PAGE | 17Gas Market Report, Q1-2021 Gas market update and short-term forecast
Gas market update and short-term forecast
IEA. All rights reserved.
PAGE | 18Gas Market Report, Q1-2021 Gas market update and short-term forecast
Gas demand faces uncertainty
Global natural gas demand is expected to recover in 2021 from an Heading towards an asymmetric (and fragile)
unprecedented drop in 2020. Yet the prospect of a prolonged economic
impact related to the Covid-19 pandemic heightens uncertainty about the recovery
pace and trajectory of growth.
Global natural gas demand is projected to increase by 2.8% in 2021 (about
The largest ever recorded drop in gas consumption occurred in 2020, 110 bcm), thus reaching slightly above its 2019 level. However, this masks
about 2.5% (an estimated 100 bcm) lower than in 2019. This compares differences in the pace of growth among regions, sectors and markets.
with a decline of about 65 bcm in 2009 from 2008 related to the financial Fast-growing markets in Asia, Africa and the Middle East are projected to
crisis. Close to 85% of the decline in 2020 is from mature markets across see increased gas demand in 2021 while mature markets may experience a
Europe, Eurasia, North America and Asia. Contributing factors include: more gradual recovery, and some may not reach their 2019 level in 2021.
exceptionally mild temperatures in Q1 affecting heating needs; lockdowns
Industrial sector demand is expected to take the lead with close to
in Q2 related to the pandemic that curbed gas use for power generation
40 bcm (3.9%) y-o-y growth, principally driven by markets in Asia, as
and in the commercial sector; slow economic recovery in the second-half
global output and trade volumes recover in 2021. (The IMF’s World
of the year and a resurgent wave of Covid-related restrictions in the last
Economic Outlook in October 2020 projects growth of 5.2% in global
months of 2020.
output and 8.3% in trade volume in 2021.)
Power generation was the most significantly affected sector in 2020. It
Residential and commercial gas demand is assumed to regain around
accounted for almost half of the y-o-y decline in gas demand with an
30 bcm (3.6%) based on a return to average seasonal temperatures, as
estimated drop of over 40 bcm, even though coal-to-gas switching for
forecast in the seasonal outlooks of the US National Weather Service
power generation occurred in the United States and Europe, and
(NWS) and the European Centre for Medium-Range Weather Forecasts.
marginally in Asia. Gas demand in the residential and commercial sector
was principally impacted by above-average temperatures in the early Gas demand in the power generation sector is projected to only partially
months of the year across the northern hemisphere dampening heating recover in 2021 with a 30 bcm (1.7%) increase, owing to a combination of
requirements.This resulted in an estimated y-o-y decline of over 30 bcm, low electricity demand growth and tougher competition in mature
about a third of the global demand decline. Gas use by industrial markets related to the expansion of renewables, the prospect of an
customers and the energy sector appear to have been less impacted, with increase in coal use in the United States and nuclear resarts in Japan.
each dropping by close to 15 bcm over the year. Global gas demand recovery therefore is fragile. It is subject to a range
of uncertainties and risks from delayed industrial rebound, mild
temperatures and stronger fuel competition in power generation that
could lead to lower demand for natural gas in 2021.
IEA. All rights reserved.
PAGE | 19Gas Market Report, Q1-2021 Gas market update and short-term forecast
Global gas demand is expected to recover in 2021, yet with notable variations
Gas demand growth by region, 2019-2021 Gas demand growth by sector, 2019-2021
IEA. All rights reserved.
IEA. All rights reserved.
PAGE | 20Gas Market Report, Q1-2021 Gas market update and short-term forecast
Gas demand in the United States is projected to decline in 2021 as gas-fired power generation
faces increased competition from expanding renewables and cheaper coal
Natural gas consumption in the United States declined by an estimated reported by the Secretaría de Energía decreased by almost 2% y-o-y from
2.6% in 2020. While demand had been on a recovery path from June to January to October, while pipeline imports from the United States
October 2020, an exceptionally mild November erased these gains, increased by 6% over the same period, at the expense of both domestic
followed by lower demand in December compared with 2019. Natural gas production and LNG imports, which fell by 65%.
demand rose slightly over Q3 (increasing 0.2% y-o-y), mainly due to a
3.5% y-o-y increase in July with a strong increase in gas-fired power
generation (close to 8%) related to high temperatures and cooling Flick of the switch: gas-fired power generation in the
demand, whereas consumption was down in both August and September United States loses ground in 2021
(-1.4% and -2% y-o-y respectively). Q4 started on a rising trend for
demand, with a 2.4% y-o-y increase in October, principally driven by the Abundant and cheap domestic production remained a key driver behind
residential and power generation sectors. November was particularly mild the US natural gas demand resilience throughout 2020. It enabled gas-
and ranked as the fourth-warmest ever recorded by the NWS. This fired power generation to increase an estimated 3% in spite of lower
precipitated in a drop in natural gas demand for the residential sector electricity demand. Yet, a progressive decline in US gas production
(preliminary weekly data show a 25% y-o-y decline) as well as for power pushed prices up.This is likely to put pressure on the competitiveness of
generation, where the combination of lower electricity demand and an gas in power generation in 2021.The IEA Electricity Market Report
increase in wind and solar output led to a 9% y-o-y drop in gas use. This highlights that the combination of limited electricity demand growth and
resulted in an estimated 13% y-o-y decline for November. The return of ongoing expansion of renewables capacity put a ceiling on thermal
colder temperatures in the first days of December resulted in an increase generation. As well, at the current forward prices, coal could make a
in gas heating demand, partly compensated by a decline in gas use for comeback in 2021 at the expense of gas in the United States, preliminary
power generation due to increasing competition with coal. data show that it increased 8 Twh y-o-y in December 2020.
In Canada gas demand decreased by 6% y-o-y in the first three-quarters US gas consumption is projected to decline by 2% y-o-y in 2021 as
of 2020. This reflects lower than usual heating demand, reduced demand for power generation falls (-8%) and offsets modest increases in
industrial activity and less gas-fired power generation. Pipeline imports other sectors. Residential and commercial demand is projected to partly
decreased by 4.3% y-o-y during the first three-quarters of 2020, totalling recover from the 2019/20 warm winter with a 3% y-o-y increase (after an
almost 19 bcm, while pipeline exports to the United States decreased by 8% fall in 2020) as the NWS forecasts a combination of cooler than
close to 5 bcm over the same period, a 8.3% reduction from 2019. average temperatures in the north and milder than average in the south
for Q1 2021. Gas demand from the industry sector is expected to rise a
Mexico’s apparent natural gas consumption fell by an estimated 2% y-o-y
modest 1% in 2021 after a 2% decline in 2020.
during the first ten months of 2020.This reflects lower industrial activity
IEA. All rights reserved.
and decreased electricity consumption. Domestic gas production
PAGE | 21Gas Market Report, Q1-2021 Gas market update and short-term forecast
Natural gas consumption in the United States declined by an estimated 2.6% in 2020
Gas consumption by month in the United States, 2019 and 2020 Gas consumption by sector in the
United States, 2020 relative to 2019
IEA. All rights reserved.
Note: bcf/d = billion cubic feet per day.
Sources: IEA analysis based on EIA (2021), Natural Gas Consumption; Natural gas weekly update; US Electric System Operating Data.
IEA. All rights reserved.
PAGE | 22Gas Market Report, Q1-2021 Gas market update and short-term forecast
Gas demand in the United States is projected to decline 2% in 2021 as it loses share in the
power mix on higher prices and increasing renewables
Natural gas demand by sector in the United States, 2018-2021 Power generation by source in the United States, 2018-2021
IEA. All rights reserved.
Sources: IEA analysis based on EIA (2021), Natural Gas Consumption; Natural gas weekly update; US Electric System Operating Data; IEA (2020), Electricity
IEA. All rights reserved.
Market Report.
PAGE | 23Gas Market Report, Q1-2021 Gas market update and short-term forecast
Gas demand in Europe: towards a fragile recovery
Gas demand in Europe proved to be rather resilient in the wake of the Gas demand for power generation in Europe rose 2.5% in Q4.This was
unprecedented macroeconomic shock related to the Covid-induced primarily driven by a 50% increase in gas-fired power generation in
lockdowns. Estimates suggest that gas demand in Europe fell by close to Turkey reflecting lower hydro availability and environmental restrictions
3% in 2020. imposed on lignite-fired power plants. In contrast, demand for gas for
Gas markets in Europe faced a perfect storm through the first-half of power generation in the European Union and the United Kingdom fell by
2020 with gas consumption plummeting by over 7% y-o-y, due to a 3%.This reflects a combination of higher renewables output, restarts of
combination of mild winter temperatures in Q1 and pandemic-related nuclear power capacity and reduced cost-competitiveness of gas-fired
lockdowns through Q2. European gas demand started to recover in June power plants (due to a sharp recovery in gas prices through the second-
and rose by 2% y-o-y in Q3 driven by increased coal-to-gas switching in half of 2020).
the power sector. Preliminary data suggest that gas demand in industries in some markets
European gas consumption rose by an estimated 3% y-o-y in Q4 2020 has been less affected, e.g. up 2% in Italy, flat in France and down 1.5% in
despite restrictive measures imposed amid another wave of the Spain.
pandemic. Several factors explain the resilience of natural gas demand
and why it was not impacted similarly as during the lockdowns in Q2: Prospects for 2021: a fragile recovery
The confinement measures imposed across Europe in Q4 were less
restrictive and disruptive for economic and industrial activities. Gas demand in Europe is projected to increase by 2% in 2021, though not
to reach pre-pandemic levels. Forecast for a return to average heating
Companies were able to adapt more quickly and smoothly to the (re)-
requirements through the winter season and a gradual recovery of
introduction of regulatory measures related to social distancing and industrial and commercial activity drive the expected uptick in gas
teleworking. demand.
The bulk of natural gas is consumed during Q4 for space heating in the Gas-fired power generation in Europe is projected to decline by 1% in
residential and commercial sector is typically more sensitive to 2021. Electricity demand is expected to increase and to be met by a 5%
weather conditions and depends less on economic activity. increase in nuclear generation and a 4% boost in output from
Heating degree days in Q4 2020 edged 3% above 2019 levels across renewables.This implies that the portion of the generation mix from fossil
Europe’s main gas consuming regions.This pushed higher space heating fuel sources (gas, coal, lignite) is projected to shrink by 1%. A projected
demand requirements in the residential sector and outpaced some of the sharp recovery in gas prices, increasing by twofold y-o-y (per forward
demand lost due to the temporary closure of commercial establishments. curves at the beginning of 2021) would diminish the competitive
Overall, gas distribution network consumption rose by an estimated advantage of gas-fired power plants vis-à-vis coal-fired generation.
4% y-o-y in Q4.
IEA. All rights reserved.
PAGE | 24Gas Market Report, Q1-2021 Gas market update and short-term forecast
Overall gas demand in Europe was down 3% in 2020 with huge drops in the first-half moderated
by increased demand in the second-half
Gas demand by region in Europe, 2020 relative to 2019 Gas demand by sector in Europe, 2020 relative to 2019
6 4%
Y-o-y change (bcm)
4 2%
2 Q1
0%
0
-2%
-2 Q2
-4%
-4
-6%
-6
-8% Q3
-8
- 10 -10%
- 12 -12% Q4
- 14 -14%
Q1 Q2 Q3 Q4 - 12 -8 -4 0 4
bcm
NWEU SEU CEE Y-o-y change (%)
Distribution Power Industry
IEA. All rights reserved.
Notes: NWEU = Northwest Europe; SEU = South Europe, CEE = Central and Eastern Europe. Distribution represents demand from consumers connected to a
distribution network.
Sources: IEA analysis based on ENTSOE (2021), Transparency Platform; ENTSOG (2021), Transparency Platform; Gaspool (2021), Consumption Data; NCG
(2021), Consumption Data; EPIAS (2021), Transparency Platform.
IEA. All rights reserved.
PAGE | 25Gas Market Report, Q1-2021 Gas market update and short-term forecast
Gas demand in Europe in 2021 is expected to remain below pre-crisis levels
Gas demand by sector in Europe, 2018-2021 Power generation by source in Europe, 2018-2021
600 3%
bcm
4 000 8%
Y-o-y change - (Gas)
TWh
500 2%
3 500 6%
1% 3 000 4%
400
0% 2 500 2%
300
2 000 0%
-1%
200 1 500 -2%
-2%
1 000 -4%
100 -3%
500 -6%
0 -4% 0 -8%
2018 2019 2020 2021 2018 2019 2020 2021
Losses Energy industry own use Nuclear Coal
Gas Oil
Transport Residential and commercial Renewables Y-o-y change - (Gas)
Industry Power generation
Y-o-y change (%)
IEA. All rights reserved.
Sources: IEA analysis based on ENTSOE (2021), Transparency Platform; ENTSOG (2021), Transparency Platform; Gaspool (2021), Consumption Data; NCG
(2021), Consumption Data; EPIAS (2021), Transparency Platform; IEA (2020), Electricity Market Report.
IEA. All rights reserved.
PAGE | 26Gas Market Report, Q1-2021 Gas market update and short-term forecast
Gas demand in Asia picked up in the second-half of 2020 with an expected rebound in 2021
Gas demand in Asia saw steep declines in the first-half of 2020. Demand zero emissions target by 2060, which will be favourable to gas demand
rallied in the second-half with year-on-year rates increasing in most Asian growth in the medium term.
economies. Colder than average winter temperatures and a host of India’s economy was hit hard by a prolonged Covid-19 epidemic in 2020.
country-specific factors boosted Asian gas demand further in Q4 2020. With a strict nationwide lockdown in the early phase, gas demand
Gas demand in 2021 is projected to see a strong rebound in most of the dropped a massive 27% y-o-y in April and was lacklustre in Q2-Q3
key growth markets in Asia. reflecting slow economic recovery and delays in key gas infrastructure
Gas demand in China is estimated to have risen 5% in 2020, though the projects. Gas demand picked up in October with a 4% y-o-y increase, but
trend was not consistent over the year. China was the first country to slowed again in November rising only 1% y-o-y. In the January-October
emerge from a Covid-19-induced gas demand drop in the early spring period gas consumption was down 1.1% y-o-y.
with gradual recovery in Q2 that accelerated in the second-half of 2020. India’s refining and fertiliser sub-sectors remained relatively unscathed
For the January-October period, the National Development and Reform during the pandemic and registered healthy gas consumption growth
Commission reported a 5% y-o-y increase in consumption while market rates over most of the year. Gas demand for power generation picked up
sources estimated 3% for that period. from Q3, but turned negative again in November. In the January to
City gas distribution was the principal driver of gas demand growth November period, negative y-o-y growth rates for gas demand were
throughout the year, due in part to new residential connections. In the reported in the city gas sector (i.e. gas-based transport, small industries,
second-half of 2020, gas demand was also up in the power generation, and residential and commercial users), power generation and
industrial and chemical sectors. An early onset of winter in October and a petrochemicals. The pace of recovery in Q4 indicated that overall gas
cold spell in December accelerated gas demand in the residential and demand growth in 2020 is expected to be slightly negative.
commercial sector. In Q4 industrial production and trade were stronger India’s gas demand is projected to rebound sharply and increase by 10%
than expected and pushed up gas consumption even further. in 2021, driven by strong economic recovery and new infrastructure
Gas demand in China is projected to increase by more than 8% in 2021 on projects. However, further project delays, lower than forecast GDP
the back of strong economic recovery. In addition, this outlook is growth and a challenging outlook for domestic gas production present
supported by ongoing expansion of natural gas use by residential and significant downside risks to the outlook for 2021.
commercial consumers and market reforms that will increase market Total gas demand in Japan is estimated to decline 5% y-o-y for 2020. In
competition and lower end-user prices. May it reached a low point with a decline of 11% y-o-y as Covid-induced
These reforms showed early indications of bearing fruit in the second-half impacts hit commercial and industrial activity particularly hard.
of 2020. PipeChina, the new national pipeline company, established a The impacts of the Covid-19 pandemic have been prolonged in Japan;
central booking platform and offered access to its infrastructure assets to total gas consumption was down 5% y-o-y in the first ten months of 2020.
third-parties just days after its formal launch on 30 September. Also Volumes of city gas sales plummeted 27% for commercial use and 16% for
notable in the second-half of 2020 was China’s announcement of a net-
IEA. All rights reserved.
industrial use in Q2, though the y-o-y consumption decline in both sectors
PAGE | 27Gas Market Report, Q1-2021 Gas market update and short-term forecast
moderated to 10% in Q3 according to the Ministry of Economy, Trade and Total gas demand in Bangladesh is estimated to be broadly flat for 2020.
Industry. In Q3-Q4, gas use for power generation increased due to the Gas consumption fell by a third compared to pre-Covid levels in April due
shutdown of several nuclear reactors for periodic inspections. Colder than to the effects of a nationwide lockdown, but demand recovered gradually
average winter temperatures likely boosted residential and power sector to pre-pandemic levels by September.
gas demand in Q4. In 2021, total gas demand in Bangladesh is projected to increase 6% y-o-y.
In 2021, total gas demand in Japan is projected to decrease by 4% y-o-y. A This increase is underpinned by a sharp rebound in economic activity and
boost in gas demand from a gradual economic recovery will be more than the recent debottlenecking of LNG import terminals. Bangladesh
offset by lower demand in the power sector as nuclear capacity is purchased its first spot LNG cargo in September 2020, having previously
restarted. Notable policy developments that affect the long-term outlook relied exclusively on deliveries from Qatar and Oman under long-term
for gas demand include Japan’s announcement of a net-zero emissions contracts.
target by 2050 and that its sixth Strategic Energy Plan is due to be Gas demand in Thailand registered a sharp 18% y-o-y decline in May 2020
finalised in fiscal year 2021; it will shape the LNG strategy of the world’s due to Covid-related impacts. While a gradual recovery trend started in
largest LNG importer in the decade ahead. June, total gas consumption in the January-October period decreased
Total gas demand in Korea is estimated to have increased 1% y-o-y in about 7% y-o-y. Total gas consumption is not expected to recover to pre-
2020. Demand fell sharply in Q2 related to the pandemic, but thanks to Covid levels before the second-half of 2021.
rapid containment of the virus spread, gas consumption expanded by 1% Gas demand in Indonesia dropped 18% y-o-y in June 2020 due to the
y-o-y in the first ten months of 2020. economic fallout from Covid-19. Indonesia’s economy lapsed into
From January to September, consumption in Korea's city gas segment recession in Q3 for the first time since the late 1990s. Total gas
decreased by 6.6% y-o-y while gas demand for power generation consumption in the January-October period decreased about 5% y-o-y.
increased 2.6% y-o-y, which mitigated the overall decline. Gas use for Demand picked up into Q4 albeit at a slow pace. In 2021, total gas
power rose in Q3 as some nuclear plants were offline due to typhoons, as consumption is projected to increase 3% y-o-y, mainly driven by gas-fired
well as some coal-to-gas switching. Some nuclear capacity restarted in power generation.
Q4 but cold winter weather and a government mandated shutdown of Gas demand in the Philippines decreased 12% y-o-y during the first-half of
some 16 coal-fired power plants from December underpinned increased 2020 and is expected to decline by 10% for the year as a whole due to
gas consumption in Q4. pandemic-induced impacts. In 2021, total gas consumption is projected
In 2021, total gas consumption in Korea is projected to increase by to increase 9% y-o-y as the economy gradually recovers.
2% y-o-y, mainly driven by economic recovery and continued coal-to-gas
switching in power generation.
IEA. All rights reserved.
PAGE | 28Gas Market Report, Q1-2021 Gas market update and short-term forecast
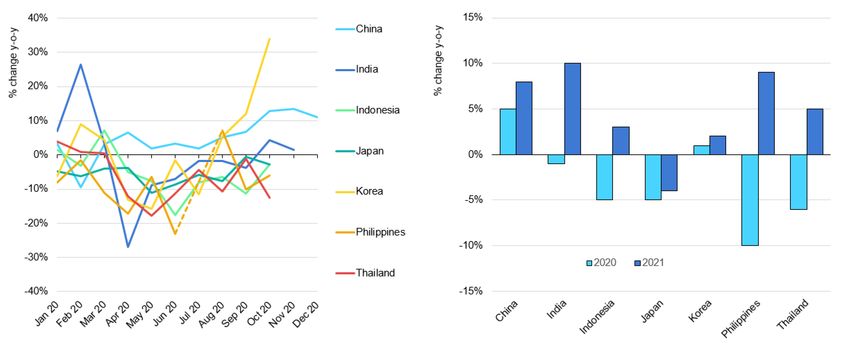
Gas demand in most Asian economies show positive growth in the second-half of 2020 or in
2021
Monthly gas demand in selected Asian countries, 2020 Gas demand in selected Asian countries, 2020 and 2021
IEA. All rights reserved.
Note: Dashed line indicates unavailable data for the Philippines.
Sources: IEA analysis based on CQPGX (2021), Nanbin Observation; IEA (2021), Monthly Gas Data Service; JODI (2021), Gas World Database; PPAC (2021),
Gas Consumption; EPPO (2021), Energy Statistics.
IEA. All rights reserved.
PAGE | 29Gas Market Report, Q1-2021 Gas market update and short-term forecast
Natural gas production in the United States slows in 2020 and 2021 – a first for two consecutive
years since the mid-2000s
Natural gas production in the United States registered its lowest monthly Production reached record highs in the last months of the year in the
level of 75.5 bcm in June 2020. It showed some gains in July and August, Appalachian Basin – the largest contributor to dry shale gas production.
but dropped to 76.3 bcm in September.This reflects a combination of lower This production level was sustained even with reduced drilling activity
electricity demand and curtailment of LNG exports due to hurricanes in the thanks to productivity improvements and the completion of previously
Gulf of Mexico. US monthly natural gas output was flat at around 78 bcm drilled but uncompleted wells with a monthly average of 61 new wells
during Q4 in spite of lower domestic demand, as well as net pipeline drilled for 70 completed over the year’s second-half.The Haynesville play
imports from Canada which stabilised over Q4, and increased in the last also experienced limited decline even with lower drilling activity, with a
weeks of December, after a 8.3% decline y-o-y during the first nine months monthly average of 35 new wells drilled and 33 completed.
of 2020. Exports provided support to US gas production in the last months
of 2020, especially LNG output which at 8.5 bcm in December broke
February’s record 7.3 bcm and more than doubled from September’s Prospects for US gas production in 2021 are
output (3.4 bcm). In addition, pipeline flows to Mexico increased 4% y-o-y in intertwined with oil production
Q4. While exports increased in late 2020, US gas production in Q4 was
slightly below its average of the first nine months, resulting in negative Dry shale gas production in the United States increased an estimated 2% in
growth estimated at - 2.2% for 2020 y-o-y. 2020. For 2021, production is projected to continue on this trend as a
steady rate of drilled but uncompleted wells in the Appalachian Basin
Associated gas output from oil-driven shale basins, which dropped 13% in
underpins gas output in spite of low drilling activity. If natural gas prices
January-June due to oil production declines, were stable over the second-
recover in the coming months, it could spur new drilling activity.The IEA’s
half 2020. The Permian Basin – one of the largest sources of associated gas
Oil Market Report projects US crude oil output to decline from 11.3 mb/d in
and accounting for close to 15% of gas production in the United States –
2020 to 11.1 mb/d in 2021. Lower light tight oil output results in a
produced on average 10.3 bcm per month over the second-half of 2020,
proportional decline in associated shale gas production. Natural gas output
close to its record of 10.5 bcm in March 2020. But short-term output was
from conventional fields (both dry and associated) is also likely to decline
extremely variable, especially in November with strong changes in weather
on a combination of the oil production adjustment and continuing
conditions. This led to high price volatility on the Permian’s Waha Hub,
depletion for the most mature assets. The expected growth from dry shale
which fell negative briefly in early November and traded at close price parity
gas basins is not sufficient to offset declines from other sources, resulting
to Henry Hub in December. Lower oil production also impacted gas output
in an estimated 2% decline in gas production in the United States in 2021.
from conventional fields.This basin, which accounted for about a quarter of
This would be the first time US output declines for two consecutive years
total US gas production in 2019, declined by close to 13% y-o-y in 2020.
since 2005 which marked the take-off of its wide-scale development of
Dry shale gas plays have recovered to pre-pandemic production levels, shale gas production.
with monthly averages of almost 40 bcm over the second-half of 2020.
IEA. All rights reserved.
PAGE | 30You can also read