Full Year 2017 Results - 14 March 2018 - Gem Diamonds
←
→
Page content transcription
If your browser does not render page correctly, please read the page content below
Full Year 2017 Results
14 March 2018
                         The 910 carat Lesotho Legend recovered at Letšeng mine in
                                                                     January 2018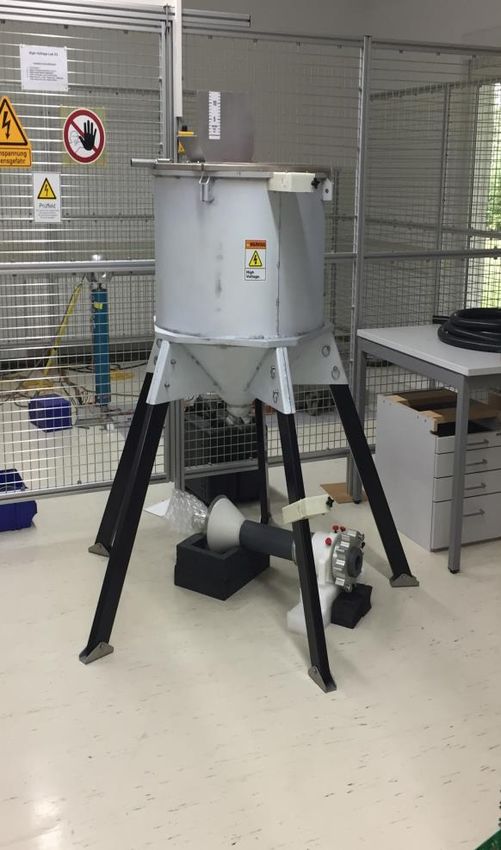
Disclaimer

The following presentations are confidential and are being made only to, and are only directed at, persons to whom such presentations
may lawfully be communicated (“relevant persons”). Any person who is not a relevant person should not act or rely on these
presentations or any of their contents. Information in the following presentation relating to the price at which relevant investments have
been bought or sold in the past or the yield on such investments cannot be relied upon as a guide to the future performance of such
investments. This presentation does not constitute an offering of securities or otherwise constitute an invitation or inducement to any
person to underwrite, subscribe for or otherwise acquire securities in any company within the Group. Neither this documentation nor
the fact of its distribution nor the making of the presentation constitutes a recommendation regarding any securities. This presentation
is for information purposes only.
The presentation contains forward-looking statements which are subject to risk and uncertainties because they relate to future events.
These forward-looking statements include, without limitation, statements in relation to the Group’s projected growth opportunities.
Some of the factors which may cause actual results to differ from these forward-looking statements are discussed in certain slides of the
presentation and others can be found by referring to the information contained under the heading “Principal risks and uncertainties” in
“The Strategic Report” in our Annual Report for the year ended 2017. The Annual Report can be found on our website
(www.gemdiamonds.com).
No statement in this presentation is intended as a profit forecast or profit estimate and no statement in the presentation should be
interpreted to mean that earnings per share for the current or future financial years would necessarily match or exceed the historical
published earnings. The presentation also contains certain non-IFRS financial information. The Group’s management believes these
measures provide valuable additional information in understanding the performance of the Group or the Group’s businesses because
they provide measures used by the Group to assess performance. However, this additional information presented is not uniformly
defined by all companies, including those in the Group’s industry. Accordingly, it may not be comparable with similarly titled measures
and disclosures by other companies. Additionally, although these measures are important in the management of the business, they
should not be viewed in isolation or as replacements for or alternatives to, but rather as complementary to, the comparable IFRS
measures such as revenue and other items reported in the consolidated financial statements. The distribution of this presentation or any
information contained in it may be restricted by law in certain jurisdictions, and any person into whose possession any document
containing this presentation or any part of it should inform themselves about, and observe such restrictions on information in this
presentation.
The information contained herein is correct as at 13 March 2018.

                                                                                                                                             2
Description of
                          picture here

Clifford Elphick
Chief Executive Officer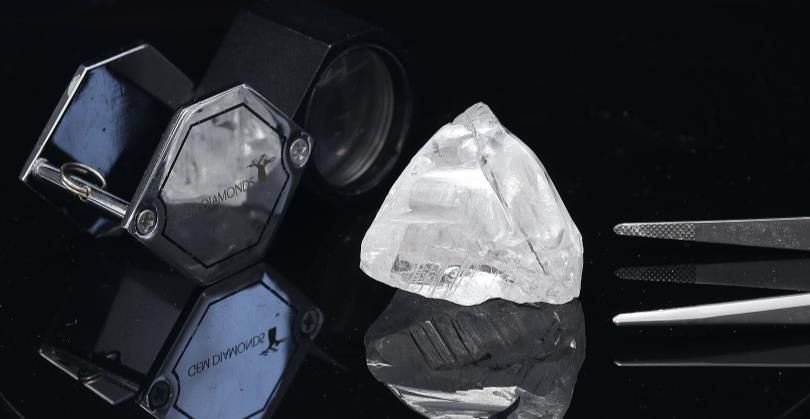
Our strategy – our key priorities…

Extracting maximum value          Working responsibly and         Preparing for our future
     from operations              maintaining social licence

Business transformation –        Promoting a culture of zero     Advancing innovative
driving business optimisation    harm and responsible care       technologies to enhance
by enhancing the efficiency of                                   revenues and reduce costs
the Group through:                                               through reducing diamond
                                 Building long-term,             damage in the plant
   ➢ improving operational
                                 transparent and mutually
     performance;
                                 beneficial relationships with
   ➢ stringent cost control;     stakeholders and communities    Extending mining lease tenure
   ➢ capital discipline; and                                     at Letšeng
   ➢ sale of non-core assets
                                 Complying with regulatory and
                                 operating environment           Assessing growth opportunities
Building balance sheet                                           against strict investment
strength                                                         criteria
                                 Prioritising organisational
                                 health
Adding new sales avenues to
maximise value
                                                                                                  4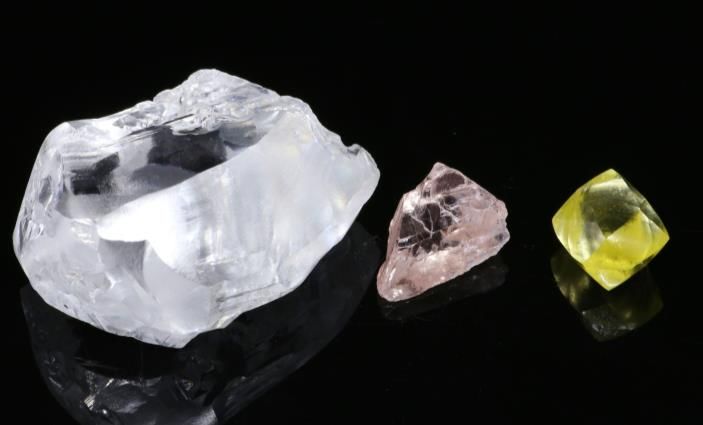
… and what we achieved in 2017
Extracting maximum value          Working responsibly and            Preparing for our future
     from operations              maintaining social licence

Revenue: $214 million            Zero fatalities                   Technical due diligence
                                                                   completed on early detection
Underlying EBITDA: $49 million
                                                                   of diamonds within kimberlite
Net cash position at year end    Zero major or significant         (PET)
                                 community or environmental
                                 incidents
Business Transformation                                            Initial testing completed of
targeting cumulative cost                                          non-mechanical crushing
savings of $100 million by end   Zero major or significant         prototype
2021                             incidents of health, safety and
                                 environmental legal non-
                                 compliance                        Mining lease renewal
Ghaghoo placed on care and                                         underway
maintenance with sale process
underway                         Organisational health surveys
                                 conducted, priority practices
                                 identified and implementation
Tender viewings commenced        underway
in Tel Aviv, Israel
                                                                                                   5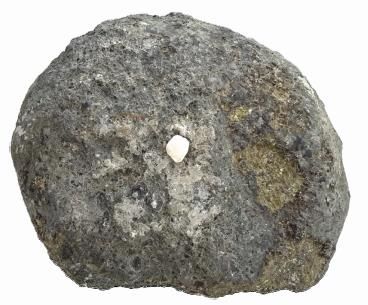
Our market

Global economic backdrop        Diamond market in 2017          Gem Diamonds’ market
         in 2017                                                      position

Continued growth of the        Continued good demand in       Improvement in the size and
Chinese economy                China                          quality of Letšeng’s production

Reasonable growth in the US    Continued US recovery          Prices remain robust for
economy
                                                              Letšeng goods
                               Low end commercial goods
Increase in retail demand in   under pressure
India                                                         Remained highest $ per carat
                                                              producer
                               High end goods prices remain
Continued improvement in       robust
commodities markets                                           Letšeng achieved average of
                                                              $1 930 per carat (up 14% YoY)
Improved macro-economic
outlook

                                                                                                6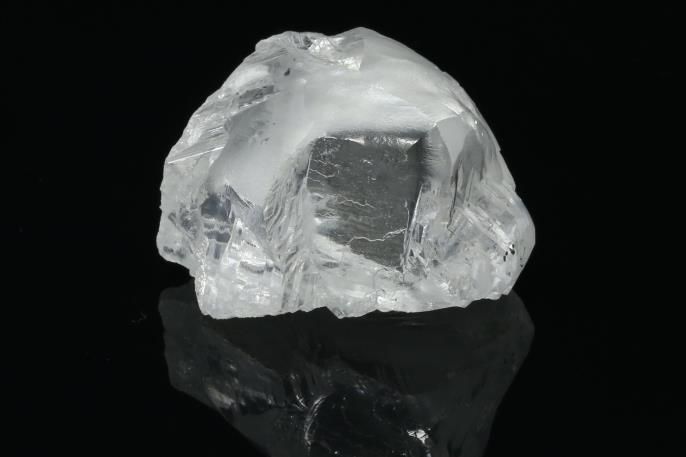
Improved $ per carat

                                                         $ per carat - 6 month rolling average

                                                                                               2 061
                                                                                    1 879
                                                                       1 779

                                                            1 545
                                               1 480

7.87 ct pink ($202 222 /ct)                   Dec 2016     Mar 2017   Jun 2017     Sep 2017   Dec 2017    58.38 ct ($61 905/ct)
2nd highest $/ct ever achieved                                                                            Highest $/ct white diamond in
                                                                                                          2017

                                 8.65 ct pink ($164 855/ct)                    202.16 ct ($44 083/ct)
                                 7th highest $/ct ever achieved                Largest recovery in 2017

                                                                                                                                          7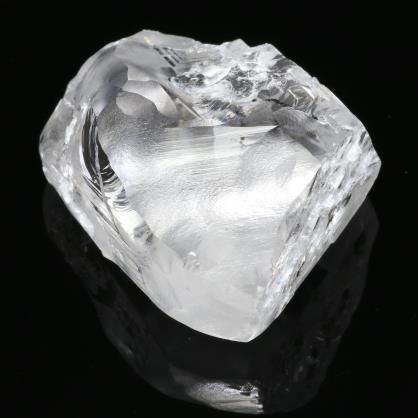
Other significant Letšeng recoveries in 2017

  126.45 ct white, 7.87 ct pink and 8.58 ct yellow   53.29 ct
       ($56 402/ct; $202 222/ct; $7 226/ct)          (US$57 654/ct)          98.26 ct ($36 141/ct)

58.38 ct ($61 905/ct)      69.57 ct ($48 169/ct)     71.17 ct ($51 020/ct)     114.38 ct ($33 223/ct)   104.54 ct ($35 129/ct)

                                                                                                                                 8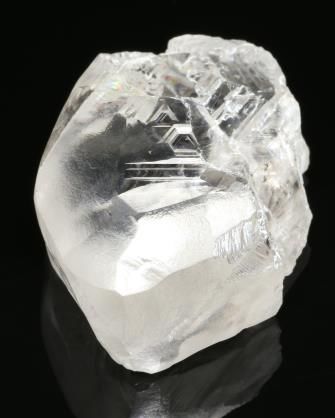
Our 910 carat Legend
Recovered in January 2018
Exceptional quality - Type IIa, D colour
diamond
Largest diamond recovered at Letšeng
Fifth largest gem quality diamond ever
recovered
Sold for $40 million
Other 2018 high-value recoveries include:
- 169.16, 152.81, 149.43, 117.67, 116.98 and
110.63 carats
- 8.53 carat pink
The Lesotho Legend
9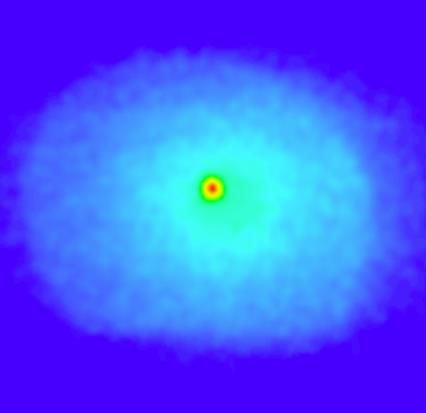
Letšeng – five out of top ten this century

Largest white diamonds recovered this century
Mine                 Rank        Name                 Weight    Country          Year

Karowe                 1         Lesedi la Rona        1 109    Botswana         2015

Letšeng                2         Lesotho Legend         910      Lesotho         2018

Karowe                 3         The Constellation      813     Botswana         2015

Letšeng                4         Lesotho Promise        603      Lesotho         2006

Amazon River           5         Wynn                   581       Brazil         2002

Letšeng                6         Letšeng Star           550      Lesotho         2011

Premier / Cullinan     7         Cullinan Heritage      508    South Africa      2009

Letšeng                8         Letšeng Legacy         493      Lesotho         2007

Letšeng                9         Light of Letšeng       478      Lesotho         2008

Premier / Cullinan    10         Dawn of Millennium     460    South Africa   before 2008

                                                                                            10
Description of
picture here
Johnny Velloza
Chief Operating OfficerZero harm is a priority
Zero fatalities
One lost time injury
Zero major or significant community or environmental incidents
CSI investment continues in line with our strategy
All injury frequency rate (AIFR) Lost time injury frequency rate (LTIFR)
3.01 2.87 0.20
2.49 0.18
1.93 2.02
0.13
0.04
0.00
2013 2014 2015 2016 2017 2013 2014 2015 2016 2017
12Letšeng operational overview
Improvement in large diamond recoveries
Continued optimisation of LoM plan – reduced waste tonnes; increased satellite pipe
XRT installed in H2 2017 to retreat recovery tailings
Continued focus on diamond damage
Majority of business transformation value
Waste tonnes mined Ore tonnes treated Carats recovered
(millions) (millions) (thousands)
112
29.8 29.7
109 109 108
24.0 6.7 6.6
19.1 19.9 6.4 6.4
6.2
95
2013 2014 2015 2016 2017 2013 2014 2015 2016 2017 2013 2014 2015 2016 2017
13Letšeng resource performance
Grade performance - MCF of 99% Revenue by size fraction
Diamonds >10.8 carats account for 76%
of revenue 10%
14%
76%
> 10 cts 5 - 10 cts < 5 cts
Frequency of large diamond recoveries
Jan & Feb
Number of diamonds 2008 2009 2010 2011 2012 2013 2014 2015 2016 2017
2018
>100 carats 7 6 7 6 3 6 9 11 5 7 5
60 - 100 carats 18 11 11 22 17 17 21 15 21 19 4
30 - 60 carats 96 79 66 66 77 60 74 65 70 74 17
20 - 30 carats 108 111 101 121 121 82 123 126 83 113 24
Total diamonds >20
229 207 185 215 218 165 227 217 179 213 50
carats
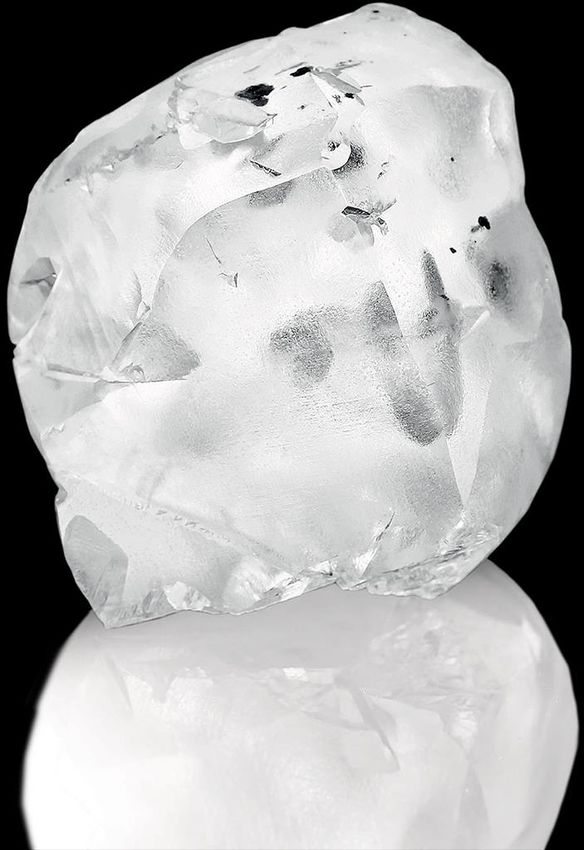
14Disruptive technology
Reducing diamond damage remains a key value creation
opportunity
Complimentary key technologies designed to
- Identify diamonds within kimberlite prior to crushing process
- Liberate diamonds through electric pulse technologies
Due diligence performed on positron emission
tomography (PET)
Prototype of electric pulse technology developed and on
site at Letšeng for testing
Aim to reduce mining and associated costs
7.9 ct 5.5 kg, 170 mm long Diamonds within kimberlite Prototype of electric pulse technology
15Ghaghoo
Care and maintenance achieved in Formal sale process underway
March 2017 - Recovered a total of 150k carats to date
Annualised care and maintenance costs - Total resource of 20.5 million carats
of $3.0 million (excluding once off - In situ value $4.9 billion
costs)
Once-off costs
- Retrenchment costs settled
- Contracts renegotiated and modified
Earthquake
- Impact on fissure
- Water levels managed
Final sale of Ghaghoo goods achieved
an average price of $175 per carat
16Description of
picture here
Michael Michael
Chief Financial OfficerFull year 2017 – key performance indicators
Revenue EBITDA
271 106 104
249
213 214 79
190
$ millions
63
$ millions
48.6
2013 2014 2015 2016 2017 2013 2014 2015 2016 2017
Basic EPS (pre exceptional items) Cashflow from operating activities
30
134
26 119
97
88
$ millions
$ Cents
17
13 71
7
2013 2014 2015 2016 2017 2013 2014 2015 2016 2017
18Full Year 2017 financial results
2017 2017
Before exceptional Exceptional %
$ millions items items 2017 2016 Variance
Revenue 214.3 - 214.3 189.8 13%
Royalty and selling costs (18.8) - (18.8) (17.2)
Cost of sales (137.7) (3.6) (141.3) (98.8)
Corporate expenses (9.2) - (9.2) (11.0)
Underlying EBITDA 48.6 (3.6) 45.0 62.8 (23%)
Depreciation and mining asset amortisation (8.9) - (8.9) (10.4)
Non cash & other items (5.8) - (5.8) -
Impairment and other exceptional items – - – (176.5)
Profit/(loss) before tax 33.9 (3.6) 30.3 (124.1)
Income tax expense (13.1) - (13.1) (20.0)
Profit/(loss) after tax 20.8 (3.6) 17.2 (144.1)
Attributable Profit/(loss) 9.1 (3.6) 5.5 (158.8)
Earnings per share (US cents) 6.6 - 4.0 12.8 (48%)
Loss per share after impairment (US cents) - - - (114.9)
19Financial performance – cost analysis
%
Unit costs ($)
2017 2016 Variance
Direct cash costs (before waste) per tonne treated 11.24 10.70 (5%)
Operating costs per tonne treated 19.96 14.64 (36%)
Waste cash cost per waste tonne mined 2.50 2.09 (20%)
Exchange rate – Average LSL to $ 13.31 14.70 (9%)
Unit costs (LSL)
Direct cash costs (before waste) per tonne treated 149.54 157.29 5%
Operating costs per tonne treated 265.57 215.13 (23%)
Waste cash cost per waste tonne mined 33.23 30.69 (8%)
Corporate costs
15.3
Continued focus on cost savings results 14.2
13.8
in lowest corporate costs reported 12.4
$ millions
11.7
11.0
9.2
2011 2012 2013 2014 2015 2016 2017
20Improving cashflows
Cash
Group cash of $47.7 million ($35.2 million attributable)
Net cash of $1.4 million after debt of $46.3 million
Dividend
No dividend proposed for 2017
17 84
123
$ millions
18
9
8 36
53 2 1 1
48
31
Cash and facilities Letšeng - Financial Letšeng - Investment Corporate Investment Net Tax paid Investment Cash and facilities
December 2016 cash generated liabilities raised waste costs in PPE costs in Ghaghoo finance in polished December 2017
capitalised costs inventory
Cash
Available facilities
21Funding
Ghaghoo $25m facility repaid in February 2017
GDL facility restructured into $45 million facility consisting of:
- $20 million RCF; and
- $25 million term loan facility (Ghaghoo debt)
Term / Amount Drawn down Available
Company Lender Expiry
Description ($ millions) ($ millions) ($ millions)
Gem Diamonds 3-year RCF
Nedbank December 2020 45.0 31.1 13.9
Limited and term loan
Standard Lesotho
Letšeng Diamonds 3-year RCF Bank and July 2018 20.2 - 20.2
Nedbank Lesotho
5.5-year
Letšeng Diamonds Nedbank / ECIC August 2022 17.3 15.2 2.1
project facility
Total 82.5 46.3 36.2
22Financial position
Increased equity value as a result of balance sheet strengthening
Improved liquidity position (current ratio of 2.43 compared to 1.27 in 2016)
$ millions 2017 2016 % Variance
Non-current assets 321.0 271.9
Current assets 91.6 72.9
Total assets 412.6 344.8 20%
Equity attributable to the parent company 158.3 133.2
Non-controlling interest 85.8 70.6
Total equity 244.1 203.8 20%
Non-current liabilities 130.8 83.7
Current liabilities 37.7 57.2
Total liabilities 168.5 140.9 20%
23Description of
picture here
Clifford Elphick, Michael Michael
and Johnny Velloza
Chief Executive Officer, Chief Financial Officer and Chief Operating OfficerTargeting $100 million
4
Cumulative target of $100 million
20
1 over 4 years
4 Cumulative 42
Annual
sustainable 14
savings of
$100m savings of
$30m Sustainable annual saving of $30
11
34 million by 2022
Implemented initiatives
Mining Processing contributing $25 million of the
Working capital & overheads Corporate activities $100 million (Sept 2017 – to date)
Once-off $4m
70 100 30
4 4 4 Recurring $21m
41 1 1 1
20
4 10 11 11
1
8
8 Achieved $3 million cash saving
1
4
9
14 14 14 (Sept 2017 – to date) mainly
5
1
2017 2018 2019 2020 2021 2022
once-off
onwards
Cumulative $100 million Sustainable $30 million
25Mining targeting $42 million
Timing of impact
5
6
2 3 3
2 2 2
1
31 1
8 9 9 9
5
0-
Load, drill & haul Blasting practices Pit design 2017 2018 2019 2020 2021 2022
onwards
All recurring initiatives
Contract renegotiation – reduces unit 42
cost rates
28
Pit slopes – reduces waste tonnes 15
13 14 14
10
6
6
Improved blasting practices – reduces 0 0
2017 2018 2019 2020 2021 2022
costs onwards
Recurring Cumulative
26Processing targeting $34 million
Timing of impact
2
1 1
16 1
3 3
16 1 4
4
7 7
5
3 3
Plant uptime Additional throughput Plant consumables
1
-
2017 2018 2019 2020 2021 2022 onwards
Recurring & once-off initiatives
Increase treated tonnes and carats
recovered through: 34
- Increasing plant uptime (full impact from
2021) 22
- Extending Alluvial Ventures contract & 10
11 11
12
deploying mobile XRT sorting machine 8
3
4
- 1
2017 2018 2019 2020 2021 2022 onwards
Recurring Once-off Cumulative
27Working capital & overheads targeting $4 million
Timing of impact
1
0.4
0.6
3
0.7 0.7 0.7 0.7
0.5
Overheads Working capital 0.1
0.0
2017 2018 2019 2020 2021 2022 onwards
Recurring & once-off initiatives
Once-off saving from working capital
3.7
management
0.5 3.0
0.6
Strict spend control procedures and 2.3
reducing administration and support 0.7 0.7 0.7
0.7
costs at Letšeng 0.4
1.1
0.0 0.1
2017 2018 2019 2020 2021 2022 onwards
Recurring Once-off Cumulative
28Corporate activities targeting $20 million
Timing of impact
4
7
16
3 3 3
3
Corporate costs Non-core assets 1 1 1 1
-- 1
Reducing or eliminating care & 2017 2018 2019 2020 2021 2022 onwards
maintenance costs at Ghaghoo – formal Recurring & once-off initiatives
sale process initiated
20
Selling non-core assets – redundant stock 6
15
& equipment, aircrafts, investment 11
property 8
4 4 4
4
2
-- -
Strict spend control procedures and 2017 2018 2019 2020 2021 2022 onwards
reducing corporate footprint and costs Recurring Once-off Cumulative
292018 Outlook
FY 2018 Guidance
Waste stripped (Mt) 24 - 26
Ore treated (Mt) 6.4 - 6.6
Satellite pipe ore contribution (Mt) 2.0
Carats recovered (Kct) 114 - 118
Carats sold (Kct) 112 - 116
Direct cash costs (before waste) per tonne treated1 (Maloti) 165 - 170
Operating costs per tonne treated2 (Maloti) 280 - 290
Mining waste cash costs per tonne of waste mined (Maloti) 31 - 33
Total capital (US$ million) 24 - 26
1Direct cash costs represent all operating costs, excluding royalty and selling costs
2Operating costs include waste stripping cost amortised, inventory and ore stockpile adjustments, and excludes depreciation and
mining asset amortisation
30Letšeng capital forecast
Letšeng 5 year capital plan
2018 2019 2020 2021 2022
Total tonnes mined (millions) 31.7 34.4 35.8 33.3 34.1
Project capital (US$m) 11 14 7 - -
Stay in business capital (US$m) 15 6 6 6 6
Capital intensity (US$/tonnes mined) 0.82 0.58 0.36 0.18 0.18
Project capital 2018
- Mining Complex $6.4 million
- Core drilling $1.0 million
- Large Diamond Recovery Plant study $1.0 million
Stay in Business capital 2018
- TSF (Patiseng dam) project of $8.5 million
31Thank you
www.gemdiamonds.com
The 910 carat Lesotho Legend recovered at Letšeng mine in
January 2018You can also read