Full-year 2013 Earnings - February 20, 2014 - Safran

Page created by Dan May
 
CONTINUE READING
Full-year 2013 Earnings - February 20, 2014 - Safran
Full-year 2013 Earnings
/ February 20, 2014 /

      0 / FY 2013 EARNINGS / FEBRUARY 20, 2014 /
Ce document et les informations qu’il contient sont la propriété de Safran. Ils ne doivent pas être copiés ni communiqués à un tiers sans l’autorisation préalable et écrite de Safran.
Full-year 2013 Earnings - February 20, 2014 - Safran
/ 01/
                        FY 2013 Highlights
                        Jean-Paul HERTEMAN - Chairman & CEO

      1 / FY 2013 EARNINGS / FEBRUARY 20, 2014 /
Ce document et les informations qu’il contient sont la propriété de Safran. Ils ne doivent pas être copiés ni communiqués à un tiers sans l’autorisation préalable et écrite de Safran.
Full-year 2013 Earnings - February 20, 2014 - Safran
FY 2013 financial highlights

 Growing adjusted revenue with strong                                                          Adjusted recurring operating income                                                         FCF was 40% of adjusted recurring
      performance in Aerospace                                                                        at 12.2% of revenue                                                                         operating income

                               +8.4% 14,695                                                                                 +23.8%
                                                                                                                                           1,788
                13,560
                                                                                                              1,444
                                                                                                                                                                                                             +26.2%
                                                                                                                                                                                                                       712
                                                                                                                                                                                                     564

        (€M)                                                                                        (€M)                                                                                     (€M)
                 FY 12                         FY 13                                                        FY 12*                         FY 13                                                    FY 12             FY 13

Higher adjusted net profit (group share)                                                                   Proposed 2013 dividend                                                                    Low net debt level
          at €2.87 per share                                                                                 up 16.7% vs. 2012                                                                         (16% gearing)

                                                                                                                             +16.7% 1.12
                              +21.9%                                                                                                                                                          Dec. 31, 2012 Dec. 31, 2013
                                              1,193
                                                                                                                0.96
                   979                                                                                                                                                                        (€M)

                                                                                                                                                                                                             €(157)M

        (€M)                                                                                         (€)
                                                                                                                                                                                                     (932)
                FY 12*                         FY 13                                                          FY 12                         FY 13                                                                     (1,089)

 * Restated IAS19R

       2 / FY 2013 EARNINGS / FEBRUARY 20, 2014 /
 Ce document et les informations qu’il contient sont la propriété de Safran. Ils ne doivent pas être copiés ni communiqués à un tiers sans l’autorisation préalable et écrite de Safran.
Full-year 2013 Earnings - February 20, 2014 - Safran
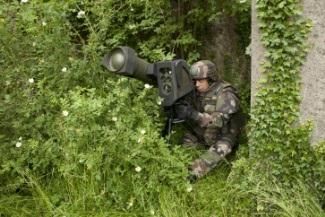
Resolutely pursuing our development strategy
        Executing on key engine development programmes: LEAP,
         Silvercrest
                     Major programmes on track, on time and on budget
        Turbomeca : a dynamic product portfolio
                     Arrius 2R, Arrano, Ardiden 3C/3G
                     Extension to 100% of Turbomeca’s ownership RTM322 programme
        Regrouping of electrical power technologies into Labinal Power
         Systems (LPS)
                     a world leader in on-board electrical power systems
                     reinforcement of LPS with the acquisition of complementary distribution
                      assets from Eaton
        Self-funded R&D of € 1,299 M, in line with guidance
                     Increase in Propulsion as planned due to ramp-up in LEAP development
                      and 2nd Silvercrest application
        Increasing industrial capacity and bringing new technologies into
         production
                     Industrial capex : € 492 million in 2013
                     8,400 hires, 3,600 net job creations in 2013

       3 / FY 2013 EARNINGS / FEBRUARY 20, 2014 /
 Ce document et les informations qu’il contient sont la propriété de Safran. Ils ne doivent pas être copiés ni communiqués à un tiers sans l’autorisation préalable et écrite de Safran.
Full-year 2013 Earnings - February 20, 2014 - Safran
Executing on key engine development programmes

        LEAP has 70% market share for future medium-range
         commercial airliners
                     More than 5,700 orders at end 2013, nearly 6,000 to date
        LEAP 1A: testing on track
                     September – November 2013: FETT test cycle
                     300 hours, >400 cycles
        LEAP 1B: preparation for FETT
                     Ground testing to start June 2014

    LEAP programme on track commercially, on time and on
           budget. So far, zero technical surprises
                                                                                                                              Silvercrest
                                                                                                                                           Complete propulsion system for Dassault 5X
                                                                                                                                           Equips Cessna Citation Longitude
                                                                                                                                           Ground testing and preparing for in-flight testing
                                                                                                                                            on dedicated flying test bed

                                                                                                                              Target 25-30% market share
                                                                                                                                           2,000+ aircraft (4,000+ Silvercrest engines
                                                                  The most advanced business jet engine for the highest
                                                                    potential market segment, already on 2 platforms
       4 / FY 2013 EARNINGS / FEBRUARY 20, 2014 /
 Ce document et les informations qu’il contient sont la propriété de Safran. Ils ne doivent pas être copiés ni communiqués à un tiers sans l’autorisation préalable et écrite de Safran.
Full-year 2013 Earnings - February 20, 2014 - Safran
Turbomeca : a dynamic product roadmap

                                                                       Arrius 2R
                                                                                    Bell Helicopter and Turbomeca team up on new Small Light Short
                                                                                     helicopter
                                                                                    First ever collaboration between Turbomeca and Bell
                                                                       Arrano launched at Heli-Expo 2013
                                                                                    For 4-6 ton helicopters
                                                                       Ardiden 3G and Ardiden 3C
                                                                                    International collaborations with Kamov, AVIC Engines

                    RTM322 : extension to 100% of Turbomeca’s ownership
                                  Heavy helicopters are a high-value, growing market segment
                                   driven by developing countries (oil & gas, mining) and military
                                  Target growth for military applications and accelerated time to
                                   market for heavy commercial engines)
                                  Annual demand up to 2,500 helicopters (2012-31)

       5 / FY 2013 EARNINGS / FEBRUARY 20, 2014 /
 Ce document et les informations qu’il contient sont la propriété de Safran. Ils ne doivent pas être copiés ni communiqués à un tiers sans l’autorisation préalable et écrite de Safran.
Full-year 2013 Earnings - February 20, 2014 - Safran
The More Electric Aircraft – an irreversible trend

                                                   Boeing 737                                                   Airbus A380 Boeing 787                                                    EGTS*         Next gen
                                                                                                                                                                                                         aircraft

                                                          1967                                                          2007                              2009                      2016-17              2025
                                                   Fuel pump                                                                      Fuel pump                                                        Fuel pump
                                                   Landing gear                                                                   Landing gear
                                                                                                                                                                                                     E-Flight controls
                                                   Nacelle                                                                        Nacelle
         Pneumatic                                                                                                                                                                                   E-Landing gear
                                                                                                                                                                                                     E-Nacelle
          Hydraulic                                                                                                                Wing anti-icing                                                  EGTS
                                                   Wing anti-icing                                                                                                                                  Wing anti-icing
                                                   Engine start and                                                               Engine start and
                                                                                                                                    controls                                                         Engine start and
        Mechanical                                  controls
                                                                                                                                   Brakes                                                            controls
                                                   Brakes                                                                                                                                           Brakes
                                                   Thrust reverser                                                                Thrust reverser
                                                                                                                                   Flight controls                                                  Thrust reverser
                                                   Flight controls
                                                   Cabin equipment                                                                   Cabin equipment                                                  Cabin equipment
                                                   Lighting                                                                          Lighting                                                         Lighting
             Electric                              IFE                                                                               IFE                                                              IFE
                                                   Avionics                                                                          Avionics                                                         Avionics

                                                                                                                                                                                            Electrical equipment

                                                                            A key strategic long term market
     * The Electric Green Taxiing System allows aircraft to taxi autonomously without use of the main engines

      6 / FY 2013 EARNINGS / FEBRUARY 20, 2014 /
Ce document et les informations qu’il contient sont la propriété de Safran. Ils ne doivent pas être copiés ni communiqués à un tiers sans l’autorisation préalable et écrite de Safran.
Full-year 2013 Earnings - February 20, 2014 - Safran
Investing in our future

                                                                                                                                2013 total R&D effort of €1.8bn

                                                                                                                                Self-financed R&D increased as planned to €1.3bn
       In €M                                                                                                                     (8.8% of sales)
                                                                                                                                              Ramp up of LEAP development and testing in line with
    2000                                                                                                                                       the business plan
    2 000
                                                          €1,800M                                                                             Development for 2nd Silvercrest application
    1800

    1600               Total R&D effort
    1 500
                                                                                                                                Split of programs reflects upcoming opportunities
    1400                                                            €1,299M                                                                   c.40%: LEAP (3 applications) and Silvercrest
    1200                                              €1,103M                                                                                  (2 applications)
    11000
      000
                                                                                                                                              c.30%: A350, helicopter next gen turbines, flight control,
                                                                                                                                               infrared matrix, biometric ID engines…
      800                                                                                                                                     c.30%: R&T in preparation of the future (mostly next gen
      600                                                                                                                                      engines and electrical technologies)
      500    Total self-funded R&D                                    €694M
      400                                               €504M
                                                                                                                                Self-financed R&D to stabilise in 2014 with a lower
      200
         0             Capitalized R&D                                                                                           level of capitalisation
         0
          2007       2008       2009       2010       2011       2012       2013       2014       2015       2016
                                                                                                                                              Increases in R&T, LEAP (2 engines in test &
                                                                                                                                               certification)
                                                                                                                                              Decrease in Silvercrest

                                 Long term amortization of capitalized R&D remains
                                        sustainable at less than 1% of sales
       7 / FY 2013 EARNINGS / FEBRUARY 20, 2014 /
 Ce document et les informations qu’il contient sont la propriété de Safran. Ils ne doivent pas être copiés ni communiqués à un tiers sans l’autorisation préalable et écrite de Safran.
Positive trends in Civil aftermarket

  Civil aftermarket up 19.2%* - above expectations
     Recent CFM56 and GE90 engines both contributed strongly
     Civil aftermarket momentum to continue in 2014

  Growth drivers
     More, higher value shop visits on recent CFM56
     Strong increase in GE90 aftermarket after no growth in 2012
     Catch-up of deferred maintenance as airlines’ financial health improves

  Aftermarket recoupling to airline activity
     Confirms CFM56 fleet potential for spares revenue to double over 2010-20
     Positive global outlook for the airline industry in 2014 according to IATA

                                      Civil aftermarket growth in the low to mid-teens
                                                      expected in 2014
        *In USD

       8 / FY 2013 EARNINGS / FEBRUARY 20, 2014 /
 Ce document et les informations qu’il contient sont la propriété de Safran. Ils ne doivent pas être copiés ni communiqués à un tiers sans l’autorisation préalable et écrite de Safran.
Defence
     Optrolead*: signing of an upstream study program (PEA) for the
      development of a 4th generation of airborne electro-optical
      gyrostabilized systems
                    *Equally-owned joint venture between Sagem and Thales

     MBDA: selection for the development and production of the firing post
      and infrared seeker on the Medium-Range Missile (MMP)
                   Replacement of France’s Milan antitank missiles

     BELL Helicopter: Sagem’s actuators chosen for the future B525

     DCNS: 5 submarines have been equipped with 10 optronic masts and
      periscopes for the Brazilian, Indian and French navies

     Acquisition of the Swiss company Colibrys SA and of the Integrated
      Cockpit Solutions activities of Eaton

       9 / FY 2013 EARNINGS / FEBRUARY 20, 2014 /
 Ce document et les informations qu’il contient sont la propriété de Safran. Ils ne doivent pas être copiés ni communiqués à un tiers sans l’autorisation préalable et écrite de Safran.
Scoring commercial successes in Security

       MorphoDetection: Medium-range explosives detection
        system
               New 5-year IDIQ contract for CTX 5800™ EDS from the TSA (US)
                for up to $130M
               5-year exclusive contract with CATSA (Canada) for up to $100M
               Nice Côte d’Azur International Airport in Nice, France purchased four
                high-speed CTX 9800 DSi™ explosives detection systems

       MorphoTrust: maintained market leadership in the U.S.
               Driver license issuance solutions to 42 of 50 states (80% of U.S.
                driver licences, 60M IDs issued per year); maintained leadership
                since 2011 Safran acquisition
               Prime contractor of Universal Enrolment Service (UES)

       Morpho: maintained leadership in ID
               Chile program start with first million ID documents issued (10 years
                contract for provision of passports and ID cards)
               Renewal of Albania concession for 10 years with extension to
                e-services
     10 / FY 2013 EARNINGS / FEBRUARY 20, 2014 /
 Ce document et les informations qu’il contient sont la propriété de Safran. Ils ne doivent pas être copiés ni communiqués à un tiers sans l’autorisation préalable et écrite de Safran.
/ 02/
                        FY 2013 Results
                        Ross McINNES - Deputy CEO, CFO

    11 / FY 2013 EARNINGS / FEBRUARY 20, 2014 /
Ce document et les informations qu’il contient sont la propriété de Safran. Ils ne doivent pas être copiés ni communiqués à un tiers sans l’autorisation préalable et écrite de Safran.
Foreword

 All figures in this presentation represent Adjusted data
 Safran’s consolidated income statement has been adjusted for the impact of:

            purchase price allocations with respect to business combinations. Since 2005, this restatement concerns the amortization charged against
             intangible assets relating to aeronautical programs that were revalued at the time of the Sagem-Snecma merger. With effect from the first-half
             2010 interim financial statements, the Group has decided to restate the impact of purchase price allocations for business combinations. In
             particular, this concerns the amortization of intangible assets recognized at the time of the acquisition, and amortized over extended periods,
             justified by the length of the Group's business cycles, and also the gain resulting from the remeasurement of the previously held interest in a
             business combination achieved in stages;

            the mark-to-market of foreign currency derivatives, in order to better reflect the economic substance of the Group's overall foreign currency risk
             hedging strategy:
                       revenue net of purchases denominated in foreign currencies is measured using the effective hedged rate, i.e., including the costs of the hedging
                        strategy,
                       the recognition of all mark-to-market changes on foreign currency derivatives relating to future flows is neutralized.

 Recurring operating income
            It excludes income and expenses which are largely unpredictable because of their unusual, infrequent and/or material nature such as
             impairment losses/reversals, capital gains/losses on disposals of operations and other unusual and/or material non operational items.

    12 / FY 2013 EARNINGS / FEBRUARY 20, 2014 /
Ce document et les informations qu’il contient sont la propriété de Safran. Ils ne doivent pas être copiés ni communiqués à un tiers sans l’autorisation préalable et écrite de Safran.
Fx volatility

   Continued Fx volatility during FY 2013
                           Translation effect: foreign currencies translated into €                                                                                                             Average spot rate
                             Negative impact from $, GBP, BRL and CAD                                                                                                                           FY 2012    FY 2013
                             Impact on Revenue and Return on Sales                                                                                                                               $1.29      $1.33

                           Transaction effect: mismatch between $ sales and € costs                                                                                                                 Hedge rate
                            is hedged                                                                                                                                                            FY 2012    FY 2013
                             Positive impact from $                                                                                                                                              $1.32      $1.28
                             Positive impact from other currencies
                             Impact on Profits

                           Mark-to-market effect                                                                                                                                                     Spot rate
                             €374M on fair value of financial instruments                                                                                                            Dec. 31,   June 30,   Dec. 31,
                             Impact on consolidated “statutory” income statement                                                                                                      2012        2013      2013
                                                                                                                                                                                       $1.32      $1.31      $1.38

                                                                                      Diverse impacts on P&L
     13 / FY 2013 EARNINGS / FEBRUARY 20, 2014 /
 Ce document et les informations qu’il contient sont la propriété de Safran. Ils ne doivent pas être copiés ni communiqués à un tiers sans l’autorisation préalable et écrite de Safran.
Consolidated and adjusted income statements
                                                                                                                                  Currency hedging                               Business combinations
                                                                                                                                                                               Amortization
          FY 2013 reconciliation                                                           Consolidated      Re-                                        Deferred               of intangible PPA impacts -    Adjusted
          (In €M)                                                                             data      measurement                                     hedging                  assets -    other business     data
                                                                                                         of revenue                                    loss / gain            Sagem/Snecma combinations
                                                                                                                                                                                  merger
          Revenue                                                                                 14,490                         205                           -                            -       -          14,695
          Other operating income / expense                                                       (13,195)                         (2)                         13                           150    127         (12,907)
          Recurring operating income                                                               1,295                         203                          13                           150    127          1,788
          Other non current operating income /
                                                                                                     185                           -                           -                            -     (216)         (31)
          expense
          Profit (loss) from operations                                                            1,480                         203                          13                           150    (89)         1,757
          Cost of net debt                                                                           (42)                          -                           -                            -       -           (42)
          Foreign exchange financial income (loss)                                                   551                       (203)                       (374)                            -       -           (26)
          Other finance costs / income                                                               (70)                          -                           -                            -       -           (70)
          Net finance costs / income                                                                 439                       (203)                       (374)                            -       -          (138)
          Income tax expense                                                                        (650)                          -                        110                            (52)    52          (540)
          Income from associates                                                                      15                           -                           -                            -       -           15
          Gain on disposal of Ingenico shares                                                        131                           -                           -                            -       -           131
          Profit (loss) from continuing operations                                                 1,415                           -                       (251)                           98     (37)         1,225
          Profit (loss) from discontinuing operations                                                   -                          -                           -                            -       -            -
          Minority interests                                                                         (29)                          -                         (1)                           (2)      -           (32)
          Parent                                                                                   1,386                           -                       (252)                           96     (37)         1,193

     14 / FY 2013 EARNINGS / FEBRUARY 20, 2014 /
 Ce document et les informations qu’il contient sont la propriété de Safran. Ils ne doivent pas être copiés ni communiqués à un tiers sans l’autorisation préalable et écrite de Safran.
FY 2013 profit from operations

                                                                                                                                FY 2012
         (In €M)                                                                                                                                                  FY 2013
                                                                                                                               (restated)
         Revenue                                                                                                                   13,560                           14,695

         Recurring operating income                                                                                                  1,444                           1,788
         % of revenue                                                                                                                10.6%                           12.2%                           Includes:
                                                                                                                                                                                           •   Capital gains on sale of
         Total one-off items                                                                                                          (50)                             (31)                    Paris office building
                                                                                                                                                                                               €16M, Globe Motors
                                                                                                                                                                                               €23M;
               Capital gain (loss) on disposals                                                                                           1                              39                •   Impairment on a legacy
                                                                                                                                                                                               engine programme
               Impairment reversal (charge)                                                                                             (1)                             (17)                   €(15)M;
                                                                                                                                                                                           •   Charge related to past
               Other infrequent & material & non operational
                                                                                                                                       (50)                             (53)                   service costs on a new
               items
                                                                                                                                                                                               DBP plan €(40)M,
         Profit from operations                                                                                                      1,394                           1,757                     acquisition &
         % of revenue                                                                                                                10.3%                           12.0%                     integration charges
                                                                                                                                                                                               €(10)M

                                                                     12.2% recurring operating income

     15 / FY 2013 EARNINGS / FEBRUARY 20, 2014 /
 Ce document et les informations qu’il contient sont la propriété de Safran. Ils ne doivent pas être copiés ni communiqués à un tiers sans l’autorisation préalable et écrite de Safran.
FY 2013 income statement

                                                                                                                         FY 2012
              (In M€)                                                                                                                                  FY 2013
                                                                                                                         restated
              Revenue                                                                                                       13,560                      14,695

              Recurring operating income                                                                                     1,444                        1,788
              % of revenue                                                                                                   10.6%                        12.2%
                                                                                                                                                                                           Of which cost of debt of €(42)M
              Profit from operations                                                                                         1,394                        1,757
              % of revenue                                                                                                   10.3%                        12.0%                            Effective tax rate of 33.4%
              Net finance (cost) income                                                                                       (154)                        (138)                            Corporate tax surcharge in
                                                                                                                                                                                              France: tax rate of 38%
              Income tax expense                                                                                              (254)                        (540)                            2012 tax expense included
                                                                                                                                                                                              the favourable impact of the
              Income from associates                                                                                             19                           15
                                                                                                                                                                                              absorption by Safran of
              Gain on disposal of Ingenico shares                                                                                  -                         131                              subsidiaries which had been
                                                                                                                                                                                              involved in loss making
              Minority interests                                                                                                (26)                         (32)                             activities divested several
              Profit – group share                                                                                             979                        1,193                               years ago.
              Basic EPS (in €)                                                                                                2.36*                       2.87**

       * Based on 415,280,826 shares
       ** Based on 416,292,736 shares
                                                                                  Net profit growth of 21.9%
     16 / FY 2013 EARNINGS / FEBRUARY 20, 2014 /
 Ce document et les informations qu’il contient sont la propriété de Safran. Ils ne doivent pas être copiés ni communiqués à un tiers sans l’autorisation préalable et écrite de Safran.
FY 2013 revenue

                                                                                                                                                                                              Record OEM production rates
                                                                                                                                                                                               in aerospace coupled with
        (In €M)
                                                                                                                                                                                               continued positive trends in
                                                                                                                                                                                               civil aerospace aftermarket
                                                                                        +8.4%
                                                                                                                                                                                              Strength in avionics and
                                        1,118                 14,678                     166                  14,512                     183                  14,695                           double-digit growth at
                                                                                                                                                                                               MorphoTrust
              13,560
                                                                                                                                                                                              Unfavourable currency impact
                                                                                                                                                                                                  Negative translation effect
                                                                                                                                                                                                   (incl. $, GBP, BRL, CAD),
                                                                                                                                                                                                   particularly affecting Security
                                       +8.2%                                                                                                                                                       activities
                                       organic
                                                                                                                                                                                              Changes in the scope of
                                                                                                                                                                                               consolidation include:
                                                                                                                                                                                                    Acquisitions: GEPS, RTM322
                                                                                                                                                                                                     programme, AB notes, Cassis
               FY 2012                Organic                 FY 2013                  Currency               FY 2013              Acquisitions &              FY 2013
                                                                                                                                                                                                    Divestment: Globe Motors Inc
                                      variation             at constant                 impact               at constant             activities
                                                              FY 2012                                         FY 2012                  newly
                                                           structure and                                      structure            consolidated,
                                                          exchange rates                                                             disposals

     17 / FY 2013 EARNINGS / FEBRUARY 20, 2014 /
 Ce document et les informations qu’il contient sont la propriété de Safran. Ils ne doivent pas être copiés ni communiqués à un tiers sans l’autorisation préalable et écrite de Safran.
FY 2013 recurring operating income
                                                                                                                                                                                          Main organic profitability
                                                                                                                                                                                           drivers
                                                                                                                                                                                                Propulsion: increased OE
  (In €M)
                                                                                                                                                                                                 volumes and favourable
                                                                                      +23.8%
                                                                                                                                                                                                 pricing in civil engines,
                                                                                                                                                                                                 strongly positive trend in civil
                                                                                                                                                                                                 aftermarket
                                                                                      103                   1,781                         7                  1,788
                                    234                   1,678                                                                                                                                 Positive impact of higher OE
          1,444                                                                                                                                                                                  production rates on nacelles,
                                                                                                                                                                                                 thrust reversers, wiring,
                                                                                                                                                                                                 landing and braking systems
                                                                                                                                                                                                Avionics

                                                                                                                                                                                                Currency hedging
          10.6%                                                                                                                                               12.2%
                                                                                                                                                                                                Production and overhead
           RoS                   +16.2%                                                                                                                        RoS                               costs savings (notably in
                                 organic                                                                                                                                                         Equipment and Defence)

          FY 2012                Organic                 FY 2013                    Currency                FY 2013               Acquisitions &              FY 2013
                                                                                                                                                                                          Changes in the scope of
          restated               variation             at constant                   impact                at constant              activities                                             consolidation include:
         (IAS 19A)                                       FY 2012                                            FY 2012                   newly
                                                      structure and                                         structure             consolidated,                                                 Acquisitions: GEPS, RTM322
                                                     exchange rates                                                                 disposals                                                    programme, AB notes,
                                                                                                                                                                                                 Cassis

                                                                                                                                                                                                Divestment: Globe Motors Inc

     18 / FY 2013 EARNINGS / FEBRUARY 20, 2014 /
 Ce document et les informations qu’il contient sont la propriété de Safran. Ils ne doivent pas être copiés ni communiqués à un tiers sans l’autorisation préalable et écrite de Safran.
Research & Development

     (In €M)                                                                                           FY 2012                 FY 2013                Variation

     Total R&D                                                                                           (1,594)                 (1,821)                 (227)

     External funding                                                                                       491                     522                     31

     Total self-funded cash R&D                                                                          (1,103)                 (1,299)                 (196)                            Self-funded cash R&D effort at
                                                                                                                                                                                           peak level of 8.8% of sales
     as a % of revenue                                                                                     8.1%                    8.8%                  0.7 pt

     Tax credit                                                                                             124                     140                     16                            Ramp up of LEAP development
                                                                                                                                                                                           and testing in line with the
     Total self-funded cash R&D after tax credit                                                          (979)                  (1,159)                 (180)                             business plan,
                                                                                                                                                                                           2nd Silvercrest application
     Gross capitalized R&D                                                                                  504                     694                    190
                                                                                                                                                                                          Increase of capitalized costs:
     Amortised R&D                                                                                          (68)                    (76)                    (8)
                                                                                                                                                                                           €190M
     P&L R&D in recurring EBIT                                                                            (543)                    (541)                      2

     as a % of revenue                                                                                     4.0%                    3.7%                 (0.3) pt

     19 / FY 2013 EARNINGS / FEBRUARY 20, 2014 /
 Ce document et les informations qu’il contient sont la propriété de Safran. Ils ne doivent pas être copiés ni communiqués à un tiers sans l’autorisation préalable et écrite de Safran.
FY 2013 results by activity

                                                                                                                                                                                                           Holding
        (In €M)                                                                                FY 2013                   Propulsion Equipment                                    Defence        Security
                                                                                                                                                                                                           & others
        Revenue                                                                                  14,695                        7,791                       4,121                    1,278        1,502        3

        Year-over-year growth in %                                                                 8.4%                       11.2%                       11.6%                    (2.8)%       (2.8)%       na

        Recurring operating income                                                                1,788                        1,359                         380                           87     120       (158)

        as a % of revenue                                                                        12.2%                        17.4%                        9.2%                      6.8%        8.0%        na

     20 / FY 2013 EARNINGS / FEBRUARY 20, 2014 /
 Ce document et les informations qu’il contient sont la propriété de Safran. Ils ne doivent pas être copiés ni communiqués à un tiers sans l’autorisation préalable et écrite de Safran.
Aerospace Propulsion

                                                                                                                                     FY 2012                  Organic
                                                            (In €M)                                                                            FY 2013 Change
                                                                                                                                    (restated)                Change
                                                            Revenue                                                                     7,005                  7,791              +11.2% +11.3%
                                                            Recurring operating income                                                  1,076                  1,359              +26.3%
                                                                                                      % of revenue                      15.4%                  17.4%              +2.0 pts
                                                                  One-off items                                                              1                   (14)
                                                            Profit (loss) from operations                                               1,077                  1,345
                                                                                                      % of revenue                      15.4%                  17.3%

                                              Growing revenue
                                                     Robust rise in civil OEM deliveries (CFM, high thrust engines)
                                                     Strong growth in civil aftermarket

                                              EBIT: Excellent profitability
                                                     Positive impact of better OE volume and unit revenue for civil engines
                                                     Favourable trend in civil aftermarket (recent CFM56 and GE90)
                                                     Increased contribution of helicopter turbine support contracts
                                                     Productivity improvements
                                                     Positive currency effects

     21 / FY 2013 EARNINGS / FEBRUARY 20, 2014 /
 Ce document et les informations qu’il contient sont la propriété de Safran. Ils ne doivent pas être copiés ni communiqués à un tiers sans l’autorisation préalable et écrite de Safran.
Aircraft Equipment

                                                                                                                                     FY 2012                  Organic
                                                            (In €M)                                                                            FY 2013 Change
                                                                                                                                    (restated)                Change
                                                            Revenue                                                                     3,691                  4,121              +11.6% +9.8%
                                                            Recurring operating income                                                    286                    380              +32.9%
                                                                                                      % of revenue                       7.7%                   9.2%               +1.5 pt
                                                                  One-off items                                                           (16)                    (2)
                                                            Profit (loss) from operations                                                 270                    378
                                                                                                      % of revenue                       7.3%                   9.2%

                       OE driven revenue growth
                             Increases in OEM production rates (B787, B737; A400M, A330 and A320 programmes; regional jets)
                              favourably impact landing gears, harnessing, nacelle and thrust reversers activities
                             Increasing activity related to the A350 programme
                             Continued momentum for the carbon brakes activity

                         Significant improvement in profitability
                             Favourable volume impact and productivity gains
                             Supportive mix/volume effect of services on auxiliary power gearboxes, nacelles and wheels and brakes.
                              High returns of carbon brakes as a result of a larger installed base and continued air traffic growth
                             Positive currency effect

     22 / FY 2013 EARNINGS / FEBRUARY 20, 2014 /
 Ce document et les informations qu’il contient sont la propriété de Safran. Ils ne doivent pas être copiés ni communiqués à un tiers sans l’autorisation préalable et écrite de Safran.
Defence

                                                                                                                                     FY 2012                  Organic
                                                            (In €M)                                                                            FY 2013 Change
                                                                                                                                    (restated)                Change
                                                            Revenue                                                                     1,315                  1,278               (2.8)%    (2.2)%
                                                            Recurring operating income                                                      79                     87             +10.1%
                                                                                                      % of revenue                       6.0%                   6.8%               +0.8 pt
                                                                  One-off items                                                              -                      7
                                                            Profit (loss) from operations                                                   79                     94
                                                                                                      % of revenue                       6.0%                   7.4%

                             Growth in Avionics with improved level of profitability
                                    Higher deliveries of seeker kit modules. Solid activity in flight control systems
                                    Favourable mix/volume effect on profitability
                             Softer revenue in Optronics, slightly impacting profits
                                    Delivery of the Felin infantry combat system to 4 regiments of the French Army (same as in 2012)
                                    First maintenance and upgrade activity on Felin equipment
                                    Long-range infrared goggles down compared to 2012
                        Cost-savings                        measures mitigated margin pressure

     23 / FY 2013 EARNINGS / FEBRUARY 20, 2014 /
 Ce document et les informations qu’il contient sont la propriété de Safran. Ils ne doivent pas être copiés ni communiqués à un tiers sans l’autorisation préalable et écrite de Safran.
Security

                                                                                                                                     FY 2012                  Organic
                                                            (In €M)                                                                            FY 2013 Change
                                                                                                                                    (restated)                Change
                                                            Revenue                                                                     1,546                  1,502               (2.8)%     (0.5)%
                                                            Recurring operating income                                                    145                    120              (17.2)%
                                                                                                      % of revenue                       9.4%                   8.0%               (1.4) pt
                                                                  One-off items                                                           (25)                    (3)
                                                            Profit (loss) from operations                                                 120                    117
                                                                                                      % of revenue                       7.8%                   7.8%

       MorphoTrust    continues robust growth driven by US Federal activities (Universal Enrollment, FBI,
            weapons permits); margins under pressure from budgetary restrictions
       Persistent    softness in Morpho’s traditional biometric activities due to run-off of export contracts;
            competitive pressure impacts profitability of new contracts
       e-Documents:      regaining traction in Q4 as NFC and LTE technology deliveries commenced; volume
            declines impacted margins, exacerbated by R&D effort, somewhat compensated by cost reductions
       Slow    growth in detection: strong momentum at year-end with US, Canada and other export deliveries of
            CTX systems; higher volumes and better mix boosting profits
       New             management taking measures to take full advantage of the outstanding potential

     24 / FY 2013 EARNINGS / FEBRUARY 20, 2014 /
 Ce document et les informations qu’il contient sont la propriété de Safran. Ils ne doivent pas être copiés ni communiqués à un tiers sans l’autorisation préalable et écrite de Safran.
Fx hedging: improved rate for 2014

                                Approx. 50% of Safran US$ revenue naturally hedged by US$ procurement

                                                                       Hedge portfolio, Feb. 4, 2014
                                                                                                     Total: $19bn                                                                             Higher expected level of net USD
                                                                                                                                                                                               exposure for 2014-17 due to
 Estimated exposure needs                                                                                                                                                                      strong growth of businesses with
 In US$ bn                                                                                                                                                                                     exposed USD revenue

                                                                                                                           6.0                ~6.0                  ~6.0                      2014 and 2015 are fully hedged
                                                                               5.6                   5.8
                      6
                                                                                                                                                                                              Further increase in 2016 hedging
                                                         5.0
                      5                                                                                                                                                                              $4.3bn achieved at $1.25 to
                                   4.3                                                                                                           4.9
                                                                                                                                                                                                      rise to $4.9bn at $1.25 as
                      4
                                                                                                                                                                                                      long as €/$
Fx hedging: benefiting margins over 2014-17

                                                Estimated impact on recurring operating income
                                                           of targeted €/$ hedge rates

                                             €/$ 1,4                 1.37                                                                                                              200   EBIT impact
                                          hedge                                                                                                                                              vs. previous
                                            rate 1,35                                                                                                                                  180   year (in €M)
                                                                                     1.32
                                                                                                                                                                                       160
                                                           1,3                                       1.28
                                                                      155                                             1.26            1.26                                             140
                                                                                                                                                      1.25             1.25
                                                         1,25                         135             130                                                                              120

                                                           1,2                                                                                                                         100

                                                                                                                                                                                       80
                                                         1,15

                                                                                                                        70                                                             60
                                                           1,1
                                                                                                                                                                                       40
                                                         1,05                                                                                            38
                                                                                                                                                                                       20

                                                             1                                                                                                                         0
                                                                      2011            2012             2013           2014E           2015E           2016E            2017E

     26 / FY 2013 EARNINGS / FEBRUARY 20, 2014 /
 Ce document et les informations qu’il contient sont la propriété de Safran. Ils ne doivent pas être copiés ni communiqués à un tiers sans l’autorisation préalable et écrite de Safran.
Free Cash Flow

                                                                                                                      FY 2012*
          (in €M)                                                                                                                              FY 2013
                                                                                                                      Restated
                                                                                                                                                                                            Of which amortization of
          Adjusted net profit                                                                                               979                    1,193                                   tangibles and intangibles
                                                                                                                                                                                           for €512M and provisions
          Depreciation, amortization and provisions                                                                         700                      678                                         (net) for €67M

          Others                                                                                                             23                      113
                                                                                                                                                                                             Good control over WC
          Cash from operating activities before change in                                                                                                                                  requirements in a context
                                                                                                                          1,702                    1,984
          WC                                                                                                                                                                                 of strong increases in
                                                                                                                                                                                            production in aerospace
          Change in WC                                                                                                      (85)                     155
                                                                                                                                                                                                    markets
          Capex (tangible assets)                                                                                         (419)                    (492)
                                                                                                                                                                                           Increased R&D spending
          Capex (intangible assets)**                                                                                     (634)                    (935)                                    and Capex investments;
                                                                                                                                                                                           includes €42M proceeds
                                                                                                                                                                                             from sale of an office
          Free cash flow                                                                                                    564                      712
                                                                                                                                                                                                building in Paris

       * 2012 is presented in a comparable format to 2013
       ** Of which €694M capitalised R&D in 2013 vs €504M capitalised in 2012

     27 / FY 2013 EARNINGS / FEBRUARY 20, 2014 /
 Ce document et les informations qu’il contient sont la propriété de Safran. Ils ne doivent pas être copiés ni communiqués à un tiers sans l’autorisation préalable et écrite de Safran.
Net debt position

        (in M€)                                                                                                                                                                      Cash flow from operations
                                                                                                                                                                                      equals 1.11x recurring EBIT
                                                                                                                                                                                     Decreased WC requirements
                                                                              R&D
                                                        Change                and                                                                                                    2012 final dividend
                        Cash flow                        in WC               Capex
            Net debt at from ops                                                                                                                         Net debt at                  (€0.65/share) and
           Dec 31, 2012                                    155                                                                                          Dec. 31, 2013                 2013 interim dividend
                                                                                                                                                                                      (€0.48/share)
                                                                            (1,427)

                                                                                                                                                                                     “Disposals” include
                                                                                                                                                                                     12.57% of Ingenico: €287M
                                     1,984                                                    Dividends*                              Acquisitions
                                                                                                                                       & others                                      Globe Motors: €68M

                                                                                                   (481)                 353
                 (932)                                                                                                                      (741)             (1,089)
                                                                                                                                                                                     “Acquisitions & Others” include:
                                                                                                                   Disposals
                                                                                                                                                                                     GEPS: €(301)M
                                                                                                                                                                                     Extension to full ownership in the
                                                                                                                                                                                      RTM322 programme: €(293)M
                                  €712M Free Cash Flow                                                                                                                               Safran-Albany JV for LEAP
                                                                                                                                                                                      composites €(33)M
      * Includes €(10)M of dividends to minority interests

     28 / FY 2013 EARNINGS / FEBRUARY 20, 2014 /
 Ce document et les informations qu’il contient sont la propriété de Safran. Ils ne doivent pas être copiés ni communiqués à un tiers sans l’autorisation préalable et écrite de Safran.
Gross debt and liquidity

                 Gross debt repayment schedule
                                             (Dec. 31, 2013)
                                                                                                                                                                                            Cash & equiv.
                                                                                                                                                                                               €1,672M
                                                                                                                                                                                                   +
                                                                                                                                                                                            Debt hedging
                                                                                                                                                                                             instruments
                                                                                                                                                                                                €(31)M
                                                                                                                                                                         Gross
                                                                                                                                                                          debt
                                                                                                                                                                        €2,730M

                                                                                                                                                                                           Net debt €1,089M

       USPP - $1.2bn, maturities 2019, 2022 &                                                                                           Committed & undrawn financing
        2024; subject to 1 covenant                                                                                                       resources: €2.55bn; subject to 1
        (net debt/EBITDA
Balance sheet highlights

                                                                                                           Dec 31, 2012                                                      Shareholders’ equity      up
   (In M€)                                                                                                              Dec 31, 2013
                                                                                                            (restated)
                                                                                                                                                                                  by €0.8bn
   Goodwill                                                                                                        3,078                        3,495
   Tangible & Intangible assets                                                                                    6,476                        7,381
                                                                                                                                                                             OWC       decreased by €127M
   Other non current assets                                                                                          818                          734
                                                                                                                                                                                  at €763M (5.2% of revenue)
   Operating Working Capital                                                                                         890                          763
   Net (debt) cash                                                                                                 (932)                      (1,089)
                                                                                                                                                                             Provisions      grew slightly

   Shareholders’ equity - Group share                                                                              5,834                        6,636
   Minority interests                                                                                                163                          178
   Non current liabilities (excl. net (debt) cash)                                                                 1,732                        2,082
   Provisions                                                                                                      2,887                        2,975
   Other current liabilities / (assets) net                                                                        (286)                        (587)

     30 / FY 2013 EARNINGS / FEBRUARY 20, 2014 /
 Ce document et les informations qu’il contient sont la propriété de Safran. Ils ne doivent pas être copiés ni communiqués à un tiers sans l’autorisation préalable et écrite de Safran.
Customer financial guarantees

                                                                                                                                                            Dec. 31,                 Dec. 31,
                                                (In $M)
                                                                                                                                                             2012                     2013

                                                Total guarantees                                                                                                 72                        72

                                                Estimated value of pledges                                                                                       20                        11

                                                Net exposure on these guarantees                                                                                 37                        47

                                                Provisions                                                                                                       37                        36

                                                 Stabilization of the total guarantees at the
                                                      lowest level in the past 25 years

     31 / FY 2013 EARNINGS / FEBRUARY 20, 2014 /
 Ce document et les informations qu’il contient sont la propriété de Safran. Ils ne doivent pas être copiés ni communiqués à un tiers sans l’autorisation préalable et écrite de Safran.
/ 03/
                        Outlook

    32 / FY 2013 EARNINGS / FEBRUARY 20, 2014 /
Ce document et les informations qu’il contient sont la propriété de Safran. Ils ne doivent pas être copiés ni communiqués à un tiers sans l’autorisation préalable et écrite de Safran.
Equity shareholding

                                          As of Dec. 31, 2012                                                                                                                  As of Dec. 31, 2013

           Public                                                                                       French State                             Public                                                 French State
            54.1%                                                                                             30.2%                              62.8%                                                    22.4%

                                                                                                                                                                                                           Employees
                                                                                                                                                                                                             14.7%

          Treasury                                                                                        Employees
          shares
                                                                                                             15.4%
              0.3%
                                                                                                                                                                                                     Treasury shares
                                                                                                                                                                                                         0.1%

                                                                Free float continued to increase
     33 / FY 2013 EARNINGS / FEBRUARY 20, 2014 /
 Ce document et les informations qu’il contient sont la propriété de Safran. Ils ne doivent pas être copiés ni communiqués à un tiers sans l’autorisation préalable et écrite de Safran.
2013 dividend
             Dividend
             per share
             (€)
             Final
             Dividend                                                                                                                                                             A proposal for a dividend payment
             distribution                                                                                                                              1.12
             (€M)                                                                                                                                                                 to parent holders of €1.12 at next
                                                                                                                             0.96                                                 AGM on May 27, 2014
             Interim
             dividend
             distribution
                                                                                                                                                                                               €0.48 interim dividend already
             (€M)                                                                                 0.62                                                  267                                     paid in 2013 (€200M)
                                                                                                                             271
                                                                      0.50                                                                                                                     €0.64 to be paid in 2014
                                            0.38                                                                                                                                                (€267M)
                                                                                                   154
                  0.25
                                                                       202
                    72                       152                                                   102                       129                        200                  Ex-dividend             date: May 29, 2014
                    32
                                                                                                                                                                             Payment              date: June 3, 2014
                 2008                       2009                       2010                      2011                       2012                       2013
Total
dividend 104                                152                       202                        256                        400                        467
distribution
(€M)

                €1.12/share dividend payment subject to shareholders’ approval

      34 / FY 2013 EARNINGS / FEBRUARY 20, 2014 /
  Ce document et les informations qu’il contient sont la propriété de Safran. Ils ne doivent pas être copiés ni communiqués à un tiers sans l’autorisation préalable et écrite de Safran.
Estimated impacts of IFRS11 on 2013 accounts

                   IFRS 11 Joint Arrangements is applied starting January 1, 2014
                       • 2014 performance will be measured against restated figures for 2013
                       • Reclassification of some jointly held activities previously proportionally
                          integrated, henceforth equity associates
                   Estimated impacts are the following:

                                                   Summary estimated impacts                                                                           2013 restatements
                                                   Orders
                                                   Order book                                                                                 Approx (800) M€

                                                   Income statement
                                                   Revenue                                                                                    Slightly more than (300) M€
                                                   Adjusted recurring operating                                                               Slightly less than (10) M€
                                                   income
                                                   Net income                                                                                 No impact

                                                   Balance sheet
                                                   Net debt                                                                                   Approx 130 M€ higher
                                                   Working capital                                                                            Approx 20 M€ lower

     35 / FY 2013 EARNINGS / FEBRUARY 20, 2014 /
 Ce document et les informations qu’il contient sont la propriété de Safran. Ils ne doivent pas être copiés ni communiqués à un tiers sans l’autorisation préalable et écrite de Safran.
2014 key assumptions

         Estimated IFRS 11 impacts of around €(300)M to 2013 revenue and less than
          €(10)M to 2013 adjusted recurring operating income

         Healthy increase in aerospace OE deliveries
            Boeing 737, A330, regional jets...

         Civil aftermarket growth in the low to mid-teens percentage
             Mainly driven by recent CFM56 engines

         Stable self-funded R&D level with less capitalisation
             R&T; helicopter turbines higher; LEAP peaking; Silvercrest lower as peak is
               passed

         Stable tangible capex

         Profitable growth for the security business

         On-going Safran+ plan to enhance the cost structure and reduce overhead

                 Increased focus on Competitiveness, Expertise and Innovation

     36 / FY 2013 EARNINGS / FEBRUARY 20, 2014 /
 Ce document et les informations qu’il contient sont la propriété de Safran. Ils ne doivent pas être copiés ni communiqués à un tiers sans l’autorisation préalable et écrite de Safran.
FY 2014 outlook

          Adjusted revenue expected to increase by a percentage in mid single
           digits* at an estimated average rate of USD 1.30 to the Euro
          Adjusted recurring operating income expected to increase by a
           percentage in low double digits* at a hedge rate of USD 1.26 to the
           Euro

          Free cash flow expected to represent close to 40% of the adjusted
           recurring operating income subject to usual uncertainties on the
           timing of advance payments

                                                                    Strong confidence for the long term
                                      CFM franchise is assured for the next decades (aftermarket revenue
                                       and successful LEAP transition)
                                      Acquisitions reinforce Safran for the long term in helicopters and MEA
                                      €/$ hedged book provides positive impact on profits
      *2014 performance will be measured relative to the 2013 accounts restated for the effects of IFRS 11

     37 / FY 2013 EARNINGS / FEBRUARY 20, 2014 /
 Ce document et les informations qu’il contient sont la propriété de Safran. Ils ne doivent pas être copiés ni communiqués à un tiers sans l’autorisation préalable et écrite de Safran.
/ 04/
                        Questions & Answers

    38 / FY 2013 EARNINGS / FEBRUARY 20, 2014 /
Ce document et les informations qu’il contient sont la propriété de Safran. Ils ne doivent pas être copiés ni communiqués à un tiers sans l’autorisation préalable et écrite de Safran.
/ 05/
                        Additional information

    39 / FY 2013 EARNINGS / FEBRUARY 20, 2014 /
Ce document et les informations qu’il contient sont la propriété de Safran. Ils ne doivent pas être copiés ni communiqués à un tiers sans l’autorisation préalable et écrite de Safran.
Amended IAS19
FY 2012 income statement

                                                                                                                 Impact of
                                                                                        FY 2012                                          FY 2012
              (In €M)                                                                                            amended
                                                                                        published                                        restated
                                                                                                                   IAS19

              Revenue                                                                       13,560                              -          13,560                         The €(27)M decrease in recurring
                                                                                                                                                                           operating income results from
                                                                                                                                                                           the discontinuation of the
              Recurring operating income                                                     1,471                       (27)                1,444
              % of revenue
                                                                                                                                                                           amortisation of actuarial gains
                                                                                             10.8%                                           10.6%
                                                                                                                                                                           and losses and past service
              Profit from operations                                                         1,421                       (27)                1,394
                                                                                                                                                                           costs previously not recognised
              % of revenue                                                                   10.5%                                           10.3%
                                                                                                                                                                           (Euro 10 million impact) and the
                                                                                                                                                                           direct recognition in 2012 of past
              Net finance (cost) income                                                        (152)                        (2)                (154)                       service costs relating to
              Income tax expense                                                               (263)                           9               (254)                       agreements entered into in the
              Profit (loss) from discontinued op.                                                       -                       -                      -                   second half of 2012 (Euro (36)
              Minority interests                                                                  (26)                          -                (26)
                                                                                                                                                                           million impact)
              Share in profit from associates                                                       19                          -                   19

              Profit - group share                                                               999                     (20)                    979
              Basic EPS (in €)                                                                   2.41                 (0.05)                    2.36

     40 / FY 2013 EARNINGS / FEBRUARY 20, 2014 /
 Ce document et les informations qu’il contient sont la propriété de Safran. Ils ne doivent pas être copiés ni communiqués à un tiers sans l’autorisation préalable et écrite de Safran.
FY 2012: R&D by activity

           (In €M)                                                                                               FY 2012                     Propulsion                      Equipment      Defence   Security

           Total self-funded cash R&D                                                                             (1,103)                           (649)                          (213)     (117)     (124)

           as a % of revenue                                                                                        8.1%                            9.3%                           5.8%      8.9%      8.0%

           Tax credit                                                                                                 124                              47                             29      36        12

           Total self-funded cash R&D after tax credit                                                              (979)                           (602)                          (184)     (81)      (112)

           Gross capitalized R&D                                                                                      504                             342                            126      22        14

           Amortised R&D                                                                                             (68)                            (25)                            (32)     (8)       (3)

           P&L R&D in recurring EBIT                                                                                (543)                           (285)                            (90)    (67)      (101)

           as a % of revenue                                                                                        4.0%                            4.1%                           2.4%      5.1%      6.5%

     41 / FY 2013 EARNINGS / FEBRUARY 20, 2014 /
 Ce document et les informations qu’il contient sont la propriété de Safran. Ils ne doivent pas être copiés ni communiqués à un tiers sans l’autorisation préalable et écrite de Safran.
FY 2013: R&D by activity

           (In €M)                                                                                               FY 2013                     Propulsion                      Equipment      Defence   Security

           Total self-funded cash R&D                                                                             (1,299)                           (790)                          (254)     (126)     (129)

           as a % of revenue                                                                                        8.8%                           10.1%                           6.2%      9.9%      8.6%

           Tax credit                                                                                                 140                              51                             38      39        12

           Total self-funded cash R&D after tax credit                                                            (1,159)                           (739)                          (216)     (87)      (117)

           Gross capitalized R&D                                                                                      694                             517                            129      31        17

           Amortised R&D                                                                                             (76)                            (24)                            (36)    (10)       (6)

           P&L R&D in recurring EBIT                                                                                (541)                           (246)                          (123)     (66)      (106)

           as a % of revenue                                                                                        3.7%                            3.2%                           3.0%      5.2%      7.1%

     42 / FY 2013 EARNINGS / FEBRUARY 20, 2014 /
 Ce document et les informations qu’il contient sont la propriété de Safran. Ils ne doivent pas être copiés ni communiqués à un tiers sans l’autorisation préalable et écrite de Safran.
Aerospace OE* / Services revenue split

                                                                                   FY 2012                                              FY 2013                                            % change
                                     Revenue
                                 Adjusted data
                                  (in Euro million)                         OE                  Services                         OE                  Services                          OE      Services

                                  Propulsion                             3,718                      3,287                     4,045                      3,746                      8.8%        14.0%
                                 % of revenue                            53.1%                      46.9%                     51.9%                      48.1%

                                  Equipment                              2,637                      1,054                     2,907                      1,214                     10.2%        15.2%
                                 % of revenue                            71.4%                      28.6%                     70.5%                      29.5%

                 * All revenue except services

     43 / FY 2013 EARNINGS / FEBRUARY 20, 2014 /
 Ce document et les informations qu’il contient sont la propriété de Safran. Ils ne doivent pas être copiés ni communiqués à un tiers sans l’autorisation préalable et écrite de Safran.
Quantities of major aerospace programmes

                                                                                                                               FY 2012                      FY 2013                         %
                                                    Number of units delivered

                                                     CFM56 engines                                                                 1,406                         1,502                       7%

                                                     High thrust engines                                                                567                          619                     9%

                                                     Helicopter engines                                                                 924                          934                     1%

                                                     M88 engines                                                                           26                           20                 (23)%

                                                     TP400                                                                                     -                        36                   na

                                                     A380 nacelles                                                                      108                          108                        -

                                                     A330 thrust reversers                                                              146                          166                    14%

                                                     A320 thrust reversers                                                              489                          513                     5%

                                                     Small nacelles (biz & regional jets)                                               534                          605                    13%

     44 / FY 2013 EARNINGS / FEBRUARY 20, 2014 /
 Ce document et les informations qu’il contient sont la propriété de Safran. Ils ne doivent pas être copiés ni communiqués à un tiers sans l’autorisation préalable et écrite de Safran.
Affirming our strategy over the electrical energy chain

        Consolidation of all electrical power activities within Labinal Power Systems                                                                                                      Long-term outlook

                                                                         A world leader in electrical         Strong installed base &
                                                                          power systems with combined           recurring aftermarket
                                                                                                                revenues
                                                                                                                                                                                              Competitive
                                                                          revenues c. € 1.4 billion in
                                                                                                                                                                                               positioning in
        +                                                                 2014
                                                                                                                                                                                               aerospace electrical
                                                                                                         Power
                                                                                                       generation                                                                              systems

        +
                                      Acquisition                                                                                                                                             Capture benefits of
                                      closed in                                                                                                                 Primary &
Electrical Power systems
                                                                             Electrical                                                                        secondary                       closer integration of
                                      March 2013                            equipment                                                                          distribution                    electrical systems
       +                                                                                                                                                                                       and wiring, with
                                                                                                                                                                                               aircraft engines and
                                                                                                                                                                                               gearboxes
       +

                                                                                                                                                                                              Lead innovation in
        +                                                                                                                                                        Systems                       the electrification of
                                                                                  Wiring                                                                        integration                    aircraft equipment

        +                                                                                                               Support &                                                             Broader offering:
                                                                                                                         Services
                                                                                                                                                                                               higher shipset value
                                     Acquisition
      PDMS
                                     expected to
                                                                          Complete offering in power                                    12,000 people in 12 countries
                                     close in H1
                                     2014                                  systems

     45 / FY 2013 EARNINGS / FEBRUARY 20, 2014 /
 Ce document et les informations qu’il contient sont la propriété de Safran. Ils ne doivent pas être copiés ni communiqués à un tiers sans l’autorisation préalable et écrite de Safran.
Definition

  Civil                   aftermarket (expressed in USD)
               This non-accounting indicator (non audited) comprises spares and MRO
                (Maintenance, Repair & Overhaul) revenue for all civil aircraft engines for
                Snecma and its subsidiaries and reflects the Group’s performance in civil
                aircraft engines aftermarket compared to the market.

     46 / FY 2013 EARNINGS / FEBRUARY 20, 2014 /
 Ce document et les informations qu’il contient sont la propriété de Safran. Ils ne doivent pas être copiés ni communiqués à un tiers sans l’autorisation préalable et écrite de Safran.
47 / FY 2013 EARNINGS / FEBRUARY 20, 2014 /
Ce document et les informations qu’il contient sont la propriété de Safran. Ils ne doivent pas être copiés ni communiqués à un tiers sans l’autorisation préalable et écrite de Safran.
You can also read