Forest Conservation and Restoration Using the Emberger Index: Cork Oak as Study Case
←
→
Page content transcription
If your browser does not render page correctly, please read the page content below
Article
Forest Conservation and Restoration Using the Emberger Index:
Cork Oak as Study Case
Federico Vessella and Bartolomeo Schirone *

                                          Dipartimento di Scienze Agrarie e Forestali (DAFNE), Università degli Studi della Tuscia, Via San Camillo de
                                          Lellis, 01100 Viterbo, Italy; vessella@unitus.it
                                          * Correspondence: schirone@unitus.it

                                          Abstract: The Mediterranean Basin is frequently stricken by huge disasters, and it represents an
                                          important biodiversity hotspot. Designing a synthetic approach, which is user-friendly with a low
                                          cost, that aims to summarize the main climatic factors that determine vegetation geographical ranges
                                          is a strategic solution to plan forest restoration actions and quickly act in cases of urgency. Here, we
                                          propose an updated version of the Emberger Index, applied to Quercus suber, an emblematic species
                                          of many ecosystems in the Mediterranean. Our investigation couples the latest spatially continuous
                                          climatic data, a high-resolution distribution map, and modelling techniques. The results evidence the
                                          effective benefits of the updated process, with insights into the optimal climatic requirements of a
                                          species within its real spatial domain, including projections for the next decades and the detection of
                                          putative refugia. Those outputs were not possible before because of a lack of data covering a certain
                                          area. Cork oak revealed an excellent study case, able to highlight the potentiality of Emberger’s
                                          approach, and understand the ecological amplitude and vulnerabilities of the target species. If
                                          genetic information is available, the Emberger Index can even be applied at the haplotype scale,
                                          thus benefitting the applied research. Such an index mirrors the optimal plasticity and physiologic
                                          characteristics of a species, supporting the decision makers in selecting the correct plants to use in
                                          future reforestation and restoration activities.


                                          Keywords: Emberger Index; Quercus suber; putative refugia; forest restoration; forecasting; assisted
Citation: Vessella, F.; Schirone, B.
Forest Conservation and Restoration
                                          migration; Mediterranean bioclimate
Using the Emberger Index: Cork Oak
as Study Case. Forests 2022, 13, 252.
https://doi.org/10.3390/f13020252
                                          1. Introduction
Academic Editor: Guntis Brūmelis
                                                The Mediterranean Basin is a melting pot of human heritage, hosting different cultures,
Received: 29 December 2021                civilizations, lifestyles, and people who share a common climate. Hence, the Mediter-
Accepted: 1 February 2022                 ranean area can be defined by observing its common climatic characteristics [1,2]. The
Published: 6 February 2022                apparent clearness of that concept hides many tricks because of the heterogeneity of the
Publisher’s Note: MDPI stays neutral      Mediterranean Basin, its complex orogenic history, and the consequential multitude of local
with regard to jurisdictional claims in   environmental conditions [3]. Several attempts have been made since the beginning of the
published maps and institutional affil-   20th century, by the scientific community, to draw the Mediterranean boundaries on a map.
iations.                                  The major problem faced was associated with the selection of climatic limiting factors that
                                          determine the extension of the Mediterranean bioclimate; for example, Köppen [4] focused
                                          on the summer precipitation, Emberger [5] and Aschmann [6], following Giacobbe [7],
                                          considered the dryness degree during the warmest season, and Berenger [8] identified
Copyright: © 2022 by the authors.         different boundaries imposed by summer wetness, winter coldness, climate dryness, or a
Licensee MDPI, Basel, Switzerland.
                                          combination of them. Presently, researchers agree that the seasonality and summer drought
This article is an open access article
                                          should be detected as global traits peculiar to that area, which are useful to fix the area’s
distributed under the terms and
                                          geographical limits. In particular, the summer is identified as the warmer season, with more
conditions of the Creative Commons
                                          droughts, i.e., a period of three months when both the lowest precipitation and highest
Attribution (CC BY) license (https://
                                          temperatures are recorded. Based on this, Daget [1] combined the previous attempts, lead-
creativecommons.org/licenses/by/
                                          ing to the establishment of a summarized output, which was further improved and refined
4.0/).

Forests 2022, 13, 252. https://doi.org/10.3390/f13020252                                                       https://www.mdpi.com/journal/forests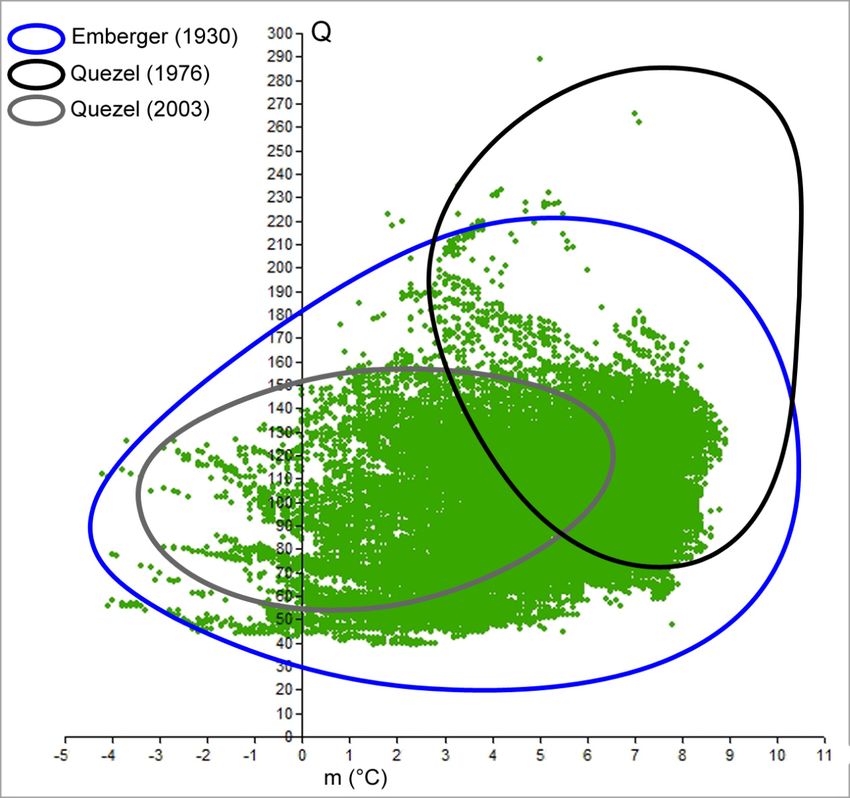
Forests 2022, 13, 252                                                                                              2 of 15

                        during the 1980s and 1990s [9–11]. Recently, Rivas-Martínez [12] refined the Mediterranean
                        isoclimate by adding further indexes into a more complex system of formulas but focusing
                        on the European countries (North Africa and the Middle East are presently excluded from
                        his bioclimatic map). The use of climatic indexes has even been combined with vegeta-
                        tion descriptions, and the Mediterranean has been identified as an important biodiversity
                        hotspot, considering the presence of peculiar ecosystems and species [6,13]. In the 1930s,
                        Emberger empirically developed a bioclimatic quotient (Q) that summarizes the main cli-
                        matic factors that determine vegetation geographical ranges. In detail, the formula includes
                        climatic variables, such as the annual precipitation (P), the minimum temperature of the
                        coldest month (m), and the maximum temperature of the warmest month (M), directly or
                        indirectly expressing drought, continentality, and evapotranspiration [14]. The original
                        formula from the 1930s is presented below (Formula (1)), while the same quotient, using
                        Kelvin degrees for temperatures, instead of Celsius, was introduced by Daget in 1977 and
                        led to Formula (2), as follows:
                                                                     100 ∗ P
                                                              Q= 2                                                (1)
                                                                    M − m2
                                                                       2000 ∗ P
                                                                Q2 =                                                  (2)
                                                                       M 2 − m2
                             There are no significant divergences between those formulas, but Formula (2) is
                        presently used more by researchers because of the higher precision, due to the employment
                        of the Kelvin scale.
                             The main benefits of Emberger’s expression rely on the facility to obtain raw data
                        of the variables from any weather station, as well as the ability to draw, in a Cartesian
                        diagram (namely, Emberger’s diagram or a climatogram), the relation between Q and m
                        for a given location; the latter is considered the main ecological limiting factor for plant
                        species. The user-friendliness of Emberger’s Index has ensured its wide application in
                        technical reports, management plans, and guidelines, to describe and classify the climate of
                        study sites [15–20]. The application of Emberger’s method has even been extended to other
                        research fields, other than ecology, for example, in biology to characterize the distribution of
                        diseases’ vectors, or in geology to map the geomorphological units [21,22]. In addition, by
                        plotting Q and m of the areas where a target species is present, it is possible to bioclimatically
                        characterize the species, encompassing all the points with a closed line. Therefore, the area
                        delimited by that line on Emberger’s diagram represents the phytoecological domain of
                        the species. Such an output is worthy of mention because it offers an effective scheme of
                        the main climatic requirements of a specimen; thus, it can help foresters to understand and
                        select the appropriate species to adopt in reforestation or forest restoration plans.
                             Nowadays, several models are available to facilitate such interventions, for example,
                        those based on niche ecological concepts [23,24], allowing the most appropriate species in
                        a given area, in terms of pedological and climatic features, to be selected. Those models
                        are conceived on complex algorithms that require large datasets, specific expertise, and
                        high-tech hardware able to rapidly compute the calculations. For this reason, they are
                        predominantly indicated for research purposes. In fact, foresters adopt alternative and
                        user-friendly approaches in their investigations, and the Emberger’s Index is one of the
                        most employed approaches.
                             Although Emberger’s bioclimatic diagrams are still in use and serve as references,
                        the raw data are presently obsolete or incomplete; for example, the climatograms of
                        Pinus halepensis Mill., Quercus ilex L., and Quercus suber L. were realized using a subset
                        of weather stations closest to the target species’ forests (mostly placed in North Africa,
                        where Emberger and his followers conducted the majority of their field surveys), or with
                        time series ranging from the 1930s to the 1970s [25–30]. If the climatic data are updated,
                        as in the case of Quercus ithaburensis (Decne.), the investigation does not include the full
                        species range [31]. In view of this, we consider it of paramount importance to address
                        some quali-quantitative improvements, in order to fully characterize a target species that
                        will benefit from advanced tools and a new set of climatic data. The renewal process is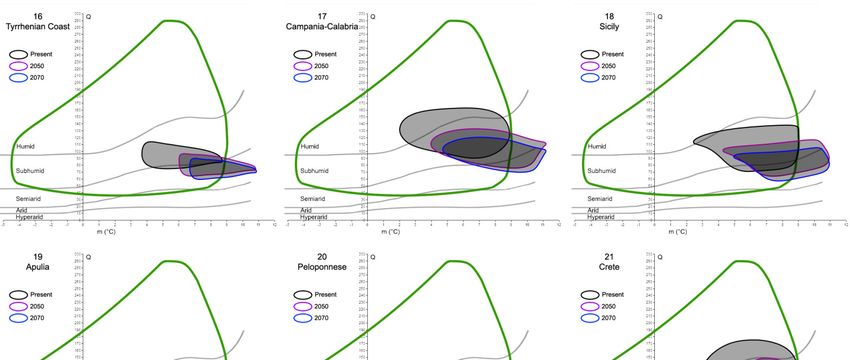
Forests 2022, 13, 252                                                                                             3 of 15

                        further required due to the ongoing global warming situation, which is causing changes in
                        the Mediterranean climatic regime, with the possibility of leading to more severe drought
                        conditions [32]. We can presently rely on global circulation model (GCM) simulations
                        of the future climate, considering the different representative concentration pathways
                        of greenhouse emissions [33]. Hence, given the detailed distribution of a species, it is
                        possible to draw a complete and updated Emberger’s climatogram for the present time
                        and project the sites within it to the future. Hereafter, we refer to a keystone species of
                        the Mediterranean Basin, cork oak (Quercus suber), as a study case to explore both the
                        theoretical and practical benefits of applying Emberger’s method, updated with the latest
                        information about the species’ occurrence and climate. The species was selected because
                        its distribution fits with the Mediterranean limits proposed by Rivas-Martínez [12,24].
                        Moreover, it sustains rich biodiversity, many fundamental ecological processes (carbon
                        storage, soil protection, water retention, etc.), and represents a valuable source of income
                        for many countries [34]. Because of its importance, researchers have already gained a vast
                        amount of knowledge about the ecology, physiology, distribution, genetics, etc., of the cork
                        oak [35–37]. This allows us to refine our investigation, for example, differentiating the
                        analysis according to the mainly detected haplotypes [38]. In addition, Emberger’s Index
                        was calculated for the detected potential refugia already proposed by Vessella et al. [36], to
                        evaluate the expected future changes in the climate within those areas that are believed
                        to have hosted the species since the last interglacial (~130 ka), thus being crucial for the
                        maintenance of the species in the next decades. We are confident about the usefulness of
                        those outputs as effective tools for foresters to easily check the capacity of the cork oak to
                        persist in a location, or to be successfully introduced into new areas.

                        2. Materials and Methods
                              The first step to actualize Emberger’s Index for the target species is to obtain a detailed
                        cork oak distribution, to properly identify the study area, i.e., the Mediterranean isoclimate,
                        and to acquire the latest temperature and precipitation time series.
                              The actual range of cork oak was obtained from merging data from national inven-
                        tories, field surveys and remote sensing analyses. The assemblage of the information
                        required, first, standardization of the raw data; in fact, the accuracy of cork oak distribu-
                        tion suffers from heterogeneity among the countries around the Mediterranean. While
                        Italy, France, Spain, and Portugal already have cork oak forests delimited and mapped
                        as shapefiles of polygons, the North African countries lack high-resolution information.
                        However, photointerpretation and local experts’ support has led to definitive identification
                        and delimitation of the species all around its actual range. A total of 155,209 polygons were
                        mapped in GIS environment and stored on a geodatabase.
                              The study area limitation was chosen from the different proposals found in the litera-
                        ture. Here, we compared three Mediterranean isoclimates, as defined by Emberger [14,39],
                        Daget [1], and Médail and Quézel [11]. Among them, we selected Daget’s solution because
                        it encompasses almost all the cork oak populations, more than the other isoclimates, except
                        for the extra-zonal sites located in Aquitaine. To include the full dataset of cork oak stands,
                        we extended Daget’s limits to the Atlantic coast of Aquitaine.
                              The climatic variables used in Emberger’s formula were retrieved from the WorldClim
                        database, version 2 [40]. Annual precipitation, maximum temperature of warmest month
                        and minimum temperature of coldest month were downloaded as raster grid files at
                        30 arc-seconds resolution (~1 km2 ) and refer to the average climate data for 1970–2000.
                        Concerning the simulation of the future climate, 13 IPPC5 projections from GCMs for the
                        representative concentration pathway 8.5 (radiative forcing value of +8.5 W/m2 in the
                        year 2100, relative to pre-industrial value) were used and the abovementioned variables
                        were averaged using Spatial Analyst in ArcGis 9.3.1 for the following two time slices:
                        2050 (average for 2041–2060) and 2070 (average for 2061–2080) (Table 1). Hence, Q values
                        for 2050 and 2070 were computed as raster grids at 30 arc-seconds resolution, as the input
                        data. The advantage of this information is its spatial extent, covering the full study area.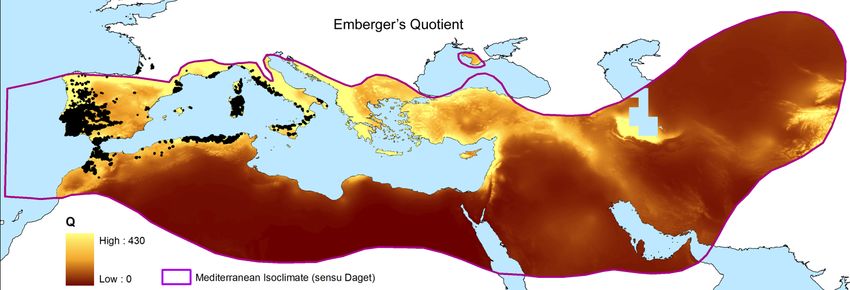
Forests 2022, 13, 252                                                                                                            4 of 15

                                 Hence, Emberger’s Index was calculated over the whole Mediterranean isoclimate, using
                                 the “Raster Calculator” function implemented in ArcGis 9.3.1, and the resulting raster grid
                                 was plotted on a Q-m diagram (Supplementary Material 1). Similarly, cork oak populations
                                 were characterized according to Emberger’s Index and the minimum temperature of the
                                 coldest month, both for present and future climate conditions. To assign those variables to
                                 each site, we ran the “Sample” function of the Spatial Analysis toolbox in Arcgis 9.3.1. The
                                 resulting tables, with the variables in columns and the species populations in rows, were
                                 used to realize Emberger’s climatograms for the cork oak.

                                 Table 1. List of global circulation models used to realize the consensus maps of bioclimatic variables
                                 for computing Emberger’s Index for the future scenarios.

       Model                                                             Source
    Access 1-0                        https://confluence.csiro.au/display/ACCESS (assessed on 22 September 2021)
   BCC-CSM 1-1                               http://forecast.bcccsm.ncc-cma.net/ (assessed on 27 March 2012)
     CCSM4                               http://www.cesm.ucar.edu/models/ccsm4.0/ (assessed on 1 April 2010)
   CNRM-CM5                  http://www.cnrm-game-meteo.fr/spip.php?article126&lang=fr (assessed on 2 September 2011)
    GFDL-CM3                             http://www.gfdl.noaa.gov/news-app/story.32 (assessed on 1 July 2011)
    GISS-E2-R                             http://data.giss.nasa.gov/modelE/ar5/ (assessed on 31 January 2020)
                                https://verc.enes.org/models/earthsystem-models/metoffice-hadley-centre/hadgem2-es
  HadGEM2-ES
                                                                (assessed on 17 March 2017)
    INM-CM4                   http://igloo.atmos.uiuc.edu/IPCC/russ.sresa1b.pr.index.html (assessed on 1 December 2015)
 IPSL-CM5A-LR               https://verc.enes.org/models/earthsystem-models/ipsl/ipslesm (assessed on 1 December 2015)
     MIROC5             http://www.icesfoundation.org/Pages/ScienceItemDetails.aspx?siid=181 (assessed on 1 December 2015)
  MPI-ESM-LR                  http://www.mpimet.mpg.de/en/science/models/mpi-esm/ (assessed on 1 December 2015)
  MRI-CGCM3                        http://cmip-pcmdi.llnl.gov/cmip5/availability.html (assessed on 1 December 2015)
   NorESM1-M                https://verc.enes.org/models/earthsystem-models/ncc/noresm (assessed on 1 December 2015)

                                      Further investigations concerned the description of the potential refugia for cork
                                 oak, as identified by Vessella et al. [36], in terms of Q and m. Present and estimated
                                 future values of those variables were calculated for 22 areas using the function “Extract by
                                 mask” implemented in ArcGis Spatial Analyst toolbox. The obtained raster values of each
                                 area were additionally plotted on a single Emberger’s diagram to compare the variation
                                 across time.
                                      A similar study involved the cork oak haplotypes retrieved from Simeone et al. (2009).
                                 In this case, each haplotype was treated separately; four climatograms were realized
                                 and compared with the climatogram representing the full species occurrence. The same
                                 was performed for the two future time slices (2050 and 2070). To estimate the optimal
                                 Q-m conditions of the species, as well as the haplotypes, a kernel density function using
                                 Arcgis 9.3.1 was applied to the data points within Emberger’s climatograms. We started
                                 from the assumption that more cork oak populations are present under certain Q-m coupled
                                 values, and those values could be representative of an optimal climate condition for the
                                 species, at least in terms of Emberger’s Index and the minimum temperature of the coldest
                                 month. The bandwidth of the kernel function was calculated using standard search radius
                                 automatically estimated by ArcGis 9.3.1, and the point density was therefore split into
                                 ten classes.
                                      The five classes with the highest values were retained and plotted on Emberger’s
                                 climatogram; this method concerned both present and future climates, so that the results of
                                 each haplotype could be compared. To point out the effects of global warming, the density
                                 classes of the haplotypes, for present and future conditions, were plotted on the same
                                 graph, taking the actual cork oak climatogram as the reference. This approach allowed the
                                 geographical position of those populations that will suffer a significant change in Q and
                                 m to be estimated and identified, so that their future position can be determined from the
                                 species climatogram.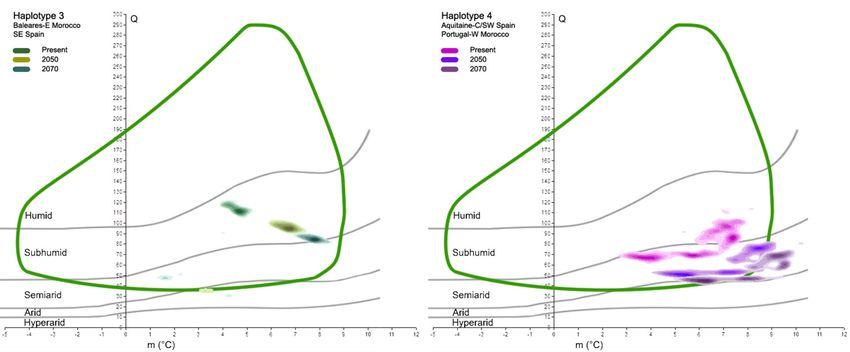
same graph, taking the actual cork oak climatogram as the reference. This approach al-
lowed the geographical position of those populations that will suffer a significant change
Forests 2022, 13, 252 in Q and m to be estimated and identified, so that their future position can be determined
5 of 15
from the species climatogram.
3.
3. Results
Results
The benefit of
The benefit ofspatially
spatiallycalculating
calculating thethe climatic
climatic variables
variables overover
the the
whole whole Mediterra-
Mediterranean
nean was that it resulted in an updated map of Emberger’s
was that it resulted in an updated map of Emberger’s Index at 30 arc-seconds resolution Index at 30 arc-seconds reso-
lution (~1
2 km 2). Here, we used the isoclimatic boundaries of the Mediterranean, as defined
(~1 km ). Here, we used the isoclimatic boundaries of the Mediterranean, as defined by
by Daget
Daget [1] [1] (Figure
(Figure 1). This
1). This dataset
dataset waswasused used as starting
as the the starting
pointpoint
to drawto draw the cork
the real real cork
oak
oak climatogram
climatogram andand compare
compare it with
it with previous
previous calculations
calculations (Figure
(Figure 2).2).InInfact,
fact,the
thedetailed
detailed
distribution
distribution of cork cork oakoakhas
hasbeen
beenplotted
plottedon onEmberger’s
Emberger’s diagram,
diagram, andand thethe retrieved
retrieved cloud
cloud of
of points
points shownshown as results
as the the results
fromfrom Emberger
Emberger duringduring the better
the 1930s 1930sapproximate
better approximate the
the present
present
cork oakcork Q-moak Q-m description
description than recent thanstudies.
recent studies.
However, However, the detailed
the detailed species dis-
species distribution
tribution
we reliedwe onrelied
allowedon allowed
us to gousbeyond to go beyond
the mere the description
mere description
of theofQ-m the Q-m
limitslimits for
for the
If QIfranges −4.2 and ◦ C, the spatial
species.
the species. Q ranges between
between39 and 39289,
andand 289,mand
ranges between
m ranges between 8.9and
−4.2 8.9 °C, the
distribution
spatial of the cork
distribution of theoak corkpopulation
oak populationon theon graph is notishomogeneous.
the graph not homogeneous. Hence, the
Hence,
application
the application of theof kernel function
the kernel revealed
function at least
revealed atfour
leasthotspots of high-density
four hotspots points,
of high-density
i.e., cores
points, i.e.,placed in the bottom
cores placed in the bottomright part
rightofpart
theofgraph, where
the graph, sub-humid
where sub-humid and semi-arid
and semi-
conditions rule. Those areas are characterized by narrow
arid conditions rule. Those areas are characterized by narrow ranges of Q and ranges of Q and m, where the
m, where
maximum
the maximum concentration
concentration of realofpopulations
real populationsis observed (Figure(Figure
is observed 3). The most
3). The representative
most repre-
Q values Q
sentative (ofvalues
the highest
(of the density
highest class)
densitywereclass)aswere
follows: 67 and67
as follows: 68,andcoupled with m
68, coupled of
with
3.5–4.1 ◦ C; 70 and 71, coupled with m of 5.6–5.8 ◦ C; 85 and 98, coupled with m of 7.1–7.5 ◦ C.
m of 3.5–4.1 °C; 70 and 71, coupled with m of 5.6–5.8 °C; 85 and 98, coupled with m of 7.1–
All °C.
7.5 theAllpairwise combinations
the pairwise combinationswere grouped
were groupedinto 10into
classes and listed
10 classes and in a sheet
listed in a table,
sheet
with a pivot table to be queried; thus, when given a couple of Q-m
table, with a pivot table to be queried; thus, when given a couple of Q-m values, it is pos- values, it is possible to
retrieve the density class they belong to (Supplementary
sible to retrieve the density class they belong to (Supplementary Material 2). Material 2).
Figure 1. Map of Emberger’s Index over the Mediterranean Basin at 30 arc-seconds resolution. The
Figure 1. Map of Emberger’s Index over the Mediterranean Basin at 30 arc-seconds resolution. The
isoclimate of Daget [1] was used as reference to encompass the spatial calculation of Emberger’s Q.
isoclimate of Daget [1] was used as reference to encompass the spatial calculation of Emberger’s Q.
Black dots show the real distribution of the cork oak.
Black dots show the real distribution of the cork oak.
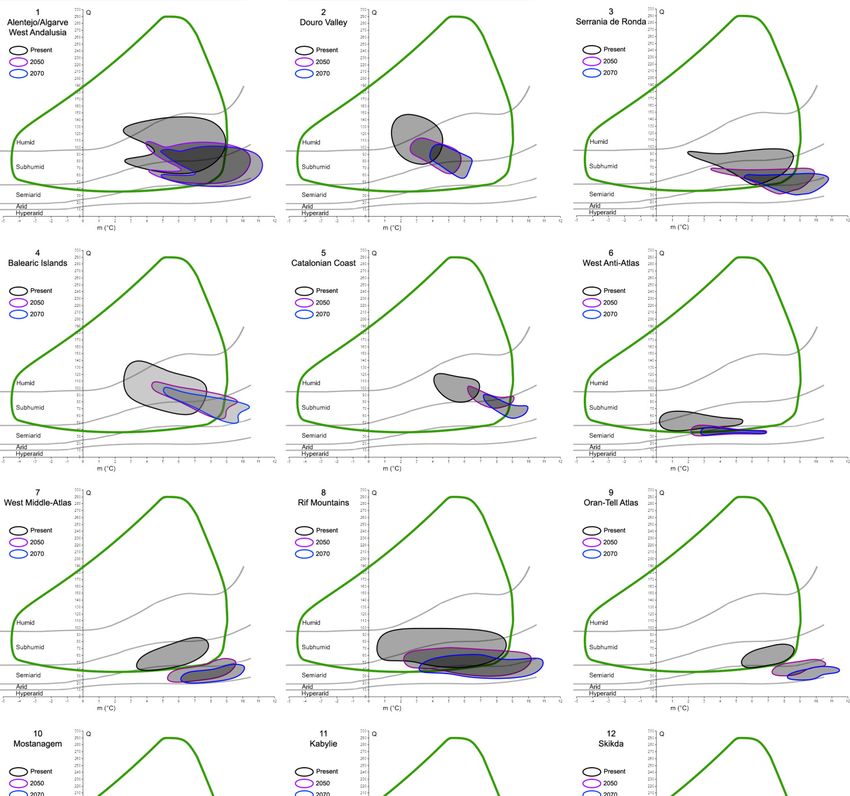
The investigation of the putative refugia and haplotypes provided further results and
insights, especially into the future relationships between the cork oak and climate. After
analyzing and plotting the predicted changes in Q and m in the 22 refugial areas, a common
trend can be observed (Figure 4). In fact, extracting the Q and m values of 2050 and 2070
from all the areas, a global increase in the minimum temperature of the coldest month
(up to 12 ◦ C), coupled with a decrease in precipitation (thus, lower Q values, until the
hyper-arid/arid limit), would interest all the potential species’ refugia. This is clear from
the graphs, where the ellipses tend to move towards the bottom-right corner of Emberger’s
diagram, although with different magnitude. In fact, given that the cork oak climatogram
is fixed (i.e., assuming that the species climatic niche breadth is stable for the next century),
some areas would partially or totally shift out of it. The former case is represented by 16 out
of 22 areas, and the latter by 4 out of 22 (all of them belong to North Africa). In two cases,
the Douro Valley, and the Var, all the Q-m values predicted for the next decades would still
be included within the cork oak climatogram.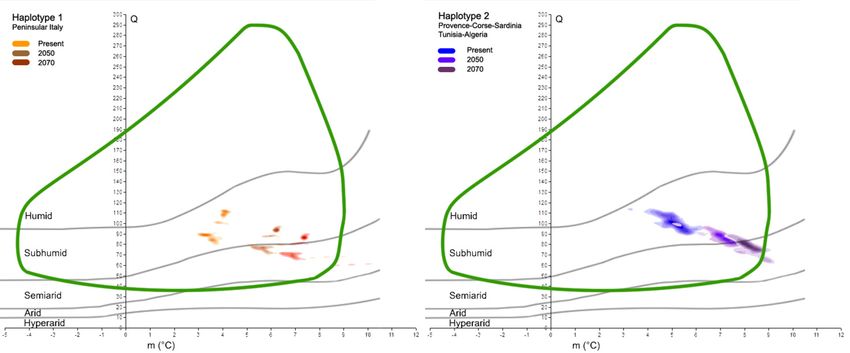
Forests 2022,
  Forests     13,13,252
          2022,      252                                                                                                       6 of6 of
                                                                                                                                     15 15
  Forests 2022, 13, 252                                                                                                        6 of 15

                            Figure 2.2. Comparison
                           Figure       Comparison ofof cork
                                                         cork oak
                                                              oak climatograms
                                                                   climatogramsasasreported
                                                                                      reportedby
                                                                                               byEmberger
                                                                                                  Emberger[14][14]and
                                                                                                                   andQuézel
                                                                                                                       Quézel[26,30]
                                                                                                                               [26,30]
                            Figure
                            with the2.cloud
                                        Comparison
                                            of pointsofofcork oak distribution
                                                          the real climatogramsat as reported
                                                                                  present timeby Emberger
                                                                                               (green dots).[14] and Quézel [26,30]
                           with the cloud of points of the real distribution at present time (green dots).
                            with the cloud of points of the real distribution at present time (green dots).

                                                                                                                     .
                            Figure 3. Kernel density classes of cork oak’s points plotted on Emberger’s diagram; blue to red
                            Figure
                           Figure
                            scale  3.3.Kernel
                                  shows Kernel
                                          lowerdensity
                                                densityclasses
                                                        classes
                                                 to higher     ofofcork
                                                           density  corkoak’s points
                                                                          oak’s
                                                                     magnitude.      plotted
                                                                                points
                                                                                 Green  curveon
                                                                                       plotted  Emberger’s
                                                                                               on         thediagram;
                                                                                                  Emberger’s
                                                                                              represents        diagram;
                                                                                                              species   blue to red
                                                                                                                           blue     scale
                                                                                                                                to red
                                                                                                                      climatogram.
                            scale shows
                           shows   lower lower   to higher
                                           to higher       density
                                                     density         magnitude.
                                                              magnitude.    GreenGreen
                                                                                   curvecurve represents
                                                                                          represents      the species
                                                                                                     the species      climatogram.
                                                                                                                 climatogram.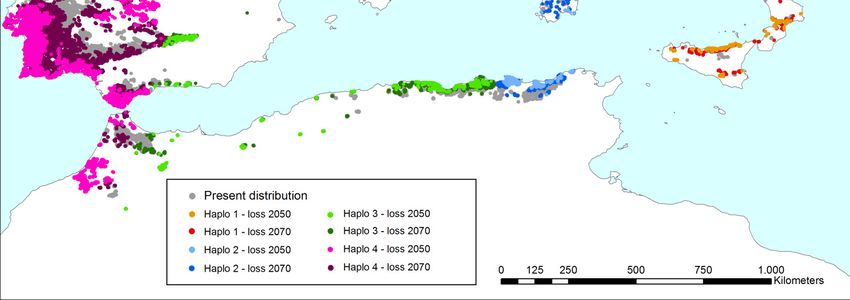
ferent magnitude. In fact, given that the cork oak climatogram is fixed (i.e., assumi
                                     species climatic niche breadth is stable for the next century), some areas would
                                     totally shift out of it. The former case is represented by 16 out of 22 areas, and the
                                     out of 22 (all of them belong to North Africa). In two cases, the Douro Valley, and
Forests 2022, 13, 252                the Q-m values predicted for the next decades would still be included          within th
                                                                                                              7 of 15
                                     climatogram.

                        Figure 4. Cont.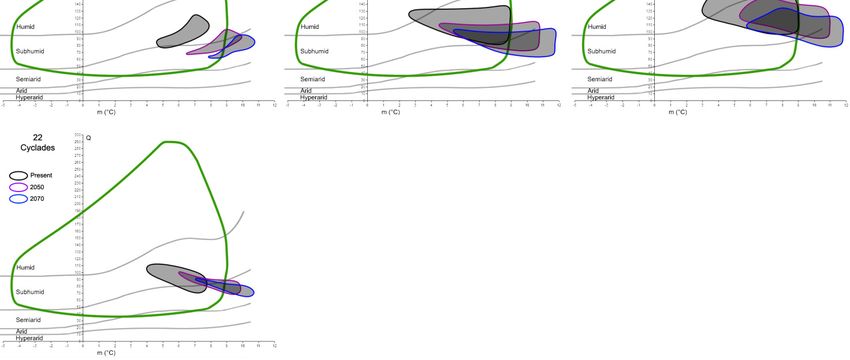
Forests 2022, 13, 252 Forests 2022, 13, 252 8 of 15 8 of 15
Figure 4. Mosaic ofFigureEmberger’s
4. Mosaicclimatograms for the 22 cork
of Emberger’s climatograms oak
for the 22 putative refugiarefugia
cork oak putative proposed by by Ves-
proposed
Vessella et al. [36]. Black closed lines encompass the Q-m values detected within each area at presentat present
sella et al. [36]. Black closed lines encompass the Q-m values detected within each area
time. Purple and blue lines show what the Q-m values of the same areas would be in 2050 and 2070,
time. Purple and blue lines show what the Q-m values of the same areas would be in 2050 and 2070,
respectively. The green curve represents the cork oak climatogram, as in Figure 3.
respectively. The green curve represents the cork oak climatogram, as in Figure 3.
Focusing on the main haplotypes of the cork oak, as detected by Simeone et al. [38],
Focusing on the maindifferent
we found haplotypes of theand
behaviors cork oak, astodetected
responses by Simeone
global warming. In fact,et
atal. [38], the five
present,
we found differenthighest
behaviors
densityand responses
classes of eachtohaplotype
global warming. In fact,
mostly occupy at present,
distinct spatialthe five
areas within the
highest density classes
cork oakof each haplotype
climatogram mostly
(Figure occupy
5). The orangedistinct spatial
haplotype, with areas within
Q ranging fromthe84 to 113,
cork oak climatogram
and m(Figure
from 3.15). The°C,
to 4.2 orange
is fullyhaplotype, with Q ranging
within the sub-humid domain,from as is 84
the to 113,
blue haplotype
and m from 3.1 to(Q ◦ C, isfrom
4.2values fully91within
to 115, and
the m from 3.4 to domain,
sub-humid 6.4 °C). The
aslatter
is theis blue
partially overlapped with
haplotype
(Q values from 91 the greenand
to 115, haplotype, 3.4 to 6.4 ◦ C).
m fromcharacterized byThethe following two main overlapped
latter is partially cores: the firstwith
is within the
the green haplotype, characterized by the102
sub-humid space (Q from to 122, and
following twommain
from 3.9 to 5.1),
cores: theand
firstthe
is second
within isthewithin the
semi-arid belt (Q centered around 50, and m from 1.5 to 2 °C). Finally, the purple haplo-
sub-humid space (Q from 102 to 122, and m from 3.9 to 5.1), and the second is within the
type, which has its highest density classes covering a large portion of the species climato-
semi-arid belt (Q centered around 50, and m from 1.5 to 2 ◦ C). Finally, the purple haplotype,
gram, is over both the semi-arid and sub-humid domains; its Q values range from 63 to
which has its highest
114,density
while mclasses
is betweencovering
2.7 anda8.2large
°C. portion
When theoffuture
the species
Q-m valuesclimatogram,
of the sameisareas are
over both the semi-arid and sub-humid domains; its Q values range
plotted on Emberger’s graph, it will be possible to recognize the shiftfrom 63 to 114,inwhile
those sites to-
m is between 2.7 and 8.2 ◦ C. When the future Q-m values of the same areas are plotted
wards more drought conditions (Figure 6). In fact, most places in which the orange hap-
on Emberger’s graph,
lotypeit presently
will be possible to recognize
occurs have moved from the
theshift in those
sub-humid sites towards
domain more domain
to the semi-arid
drought conditionsin(Figure
less than6). one
Incentury, but places
fact, most persist in
within
whichthethe
corkorange
oak climatogram.
haplotypeThe same feature is
presently
occurs have moved observed
from the in sub-humid
reference to the blue haplotype.
domain In this domain
to the semi-arid case, the inincrease in the
less than oneminimum
century, but persist within the cork oak climatogram. The same feature is observed in
reference to the blue haplotype. In this case, the increase in the minimum temperature
in 2070 places the core of the points slightly outside of the species climatogram. The
green haplotype is in line with the previous haplotypes; a trend towards more drought
conditions is observed as well, with the smallest core of points dislocated within the arid
belt in 2070, thus outside of the climatogram. The purple haplotype seems to suffer from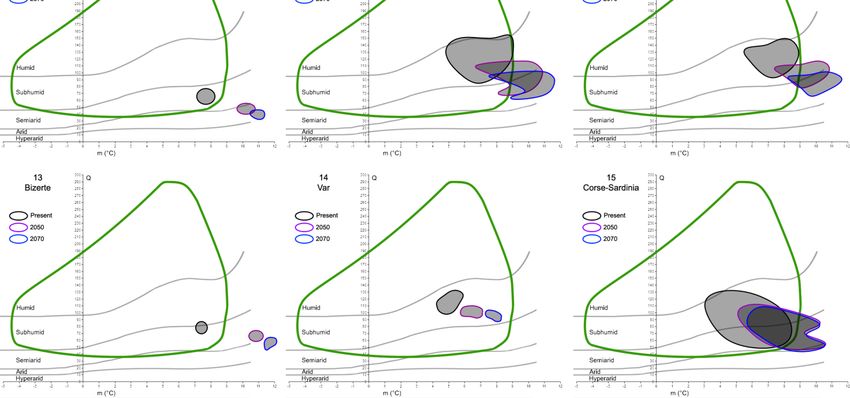
Forests 2022, 13, 252                                                                                                              9 of 15

Forests 2022, 13, 252                      temperature in 2070 places the core of the points slightly outside of the species climato-
                                                                                                                                    9 of 15
                                           gram. The green haplotype is in line with the previous haplotypes; a trend towards more
                                           drought conditions is observed as well, with the smallest core of points dislocated within
                                           the arid belt in 2070, thus outside of the climatogram. The purple haplotype seems to suf-
                                         the future climatic scenarios more than the other haplotypes. Its major occurrence is
                                           fer from the future climatic scenarios more than the other haplotypes. Its major occurrence
                                         presently characterized by sub-humid/semi-arid conditions, but in the next decades, those
                                           is presently characterized by sub-humid/semi-arid conditions, but in the next decades,
                                         clouds of sites will all be placed within the semi-arid belt and partially outside of the cork
                                           those clouds of sites will all be placed within the semi-arid belt and partially outside of
                                         oak climatogram, thus not theoretically being suitable for the persistence of the species.
                                           the cork oak climatogram, thus not theoretically being suitable for the persistence of the
                                         Aspecies.
                                            qualitative  representation
                                                    A qualitative        of those of
                                                                   representation  changes  is shown
                                                                                     those changes is in Tablein2.Table 2.
                                                                                                      shown

                                           Figure 5. Selection and plot of the five highest density classes, at present, for each haplotype on
                                         Figure 5. Selection and plot of the five highest density classes, at present, for each haplotype on
                                           Emberger’s diagram in comparison with cork oak climatogram (green curve). The darker the subtle
                                         Emberger’s   diagram
                                           color of each       in comparison
                                                         haplotype,             with
                                                                    the higher the   cork oak
                                                                                   density     climatogram
                                                                                           of real            (greenQ-m
                                                                                                   points at certain curve). The darker the subtle
                                                                                                                        values.
                                         color of each haplotype, the higher the density of real points at certain Q-m values.

                                         Table 2. Minimum, mean and maximum values of Q and m parameters for the haplotypes investigated
                                         in this study. Present, 2050 and 2070 time slices are reported for comparison.

                                  Orange                           Blue                         Green                         Purple
         Q              Today      2050       2070      Today      2050      2070     Today      2050      2070      Today      2050      2070
   Minimum                84        69          63        91        73        65         50        38        35        63        48        43
    Mean                  96        82          77       102        88        80        103        91        84        82        63        57
   Maximum               113        99          92       115       102        94        122       105        93       114        83        83
        m
   Minimum                  3.1     5          6.2       3.4        5.1       5.9       1.5       3.1       4.1       2.7         4       4.9
    Mean                    3.6     6          7.1       5.1        7.1       7.9        4        6.1       7.3       5.9        7.2      8.1
   Maximum                  4.2    8.9         9.9       6.4         9         9        5.1       7.2       8.2       8.2        9.2      10.3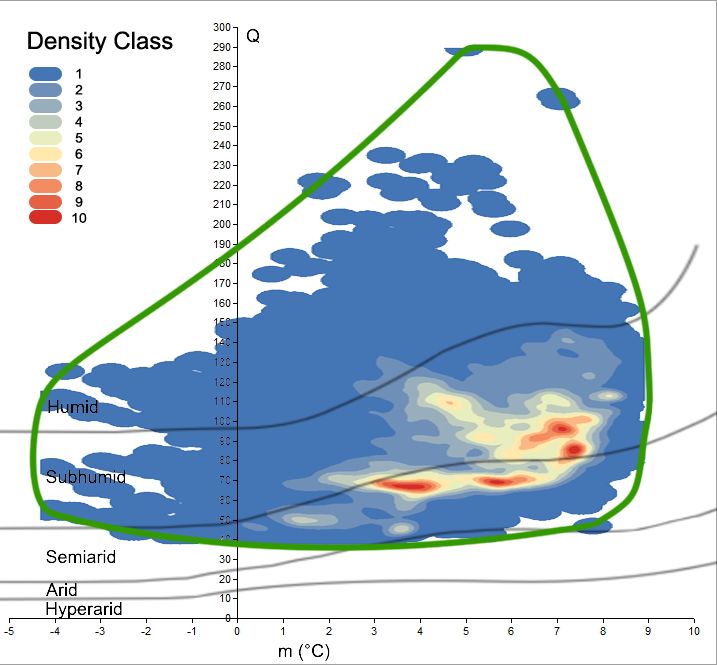
Forests2022,
Forests 2022,13,
13,252
252 1010 of 15
of 15
Figure6.6.Projections
Figure Projectionsofofresults
resultsshown
showninin Figure
Figure 5 to
5 to 2050
2050 and
and 2070
2070 time
time slices.
slices. Each
Each boxbox shows
shows thethe
comparison of a haplotype at present and in the future. Cork oak climatogram (green curve)
comparison of a haplotype at present and in the future. Cork oak climatogram (green curve) is used is used
as reference.
as reference.
Table
The2. Minimum, meanof
points outside andthemaximum values of Q and
species climatogram m parameters
have for the
been spatially haplotypes on
represented investi-
a
gated in this study. Present, 2050 and 2070 time slices are reported for comparison.
map (Figure 7). Hence, loss of the present surface can be geographically localized and
estimated (Table 3). A global
Orange Blue reduction in cork oak Green
occurrence within the same areas of
Purple
Q Today the
2050 present distribution
2070 Today is observed.
2050 2070 The results
Today in Table
2050 3 show that
2070 Today only 47%
2050of the
2070
Minimum 84 present
69 cork
63 oak sites
91 would
73 maintain
65 Q-m values
50 suitable38 for the persistence
35 63 of the
48species
43
Mean 96 until the77
82 end of 102
this century.
88 Such a 80reduction
103is widespread
91 over
84 the whole
82 range,
63 but
57
Maximum 113 is mostly92focused
99 115on the102
Iberian Peninsula
94 (central and
122 105 south-west)
93 and
114 North 83 Africa.
83
m On the other hand, northern populations seem to better tolerate the increase in droughts
Minimum 3.1 5and temperatures,
6.2 3.4 as can5.1be observed5.9 in French,
1.5 Catalonian,
3.1 Northern
4.1 Portuguese,
2.7 4 and
4.9
Mean 3.6 6Tyrrhenian 7.1 cork oak
5.1 stands. 7.1In fact, they
7.9 persist4throughout 6.1 global7.3warming,5.9 with7.2a limited
8.1
Maximum 4.2 reduction
8.9 9.9in surface.
6.4 Focusing 9 on haplotypes,
9 the purple
5.1 7.2haplotype
8.2 would 8.2 majorly
9.2 suffer
10.3
from the effects of a drier climate; there would be up to a 62% decrease in its present
The points
distribution outside
at the end ofofthe thecentury.
species climatogram
Each of the other have haplotypes
been spatiallywouldrepresented
undergo on a a
map (Figure
theoretical 7). Hence,
reduction of ca.loss of the present surface can be geographically localized and
35%.
estimated (Table 3). A global reduction in cork oak occurrence within the same areas of
Table 3. Estimated
the present reductionisin
distribution cork oak populations,
observed. The results distinguished
in Table 3 showby haplotype,
that only due47%toofchange
the pre-
insent
temperature
cork oak sites would maintain Q-m values suitable for the persistence ofcirculation
and precipitation, as predicted for 2050 and 2070 by the thirteen global the species
models listed
until the endin of
Table
this1.century.
NumbersSuchrefer to residual surfaces
a reduction expressed over
is widespread as cells of whole
the 1 squarerange,
kilometer
but is
containing cork oak forests. The geographical location is shown in Figure 7.
mostly focused on the Iberian Peninsula (central and south-west) and North Africa. On
the other hand, northernOrange populations Blue seem to better
Greentolerate the increase in droughts
Purple Total and
temperatures, as can be observed in French, Catalonian, Northern Portuguese, and Tyr-
Present 2707 8970 12,929 51,773 76,739
rhenian
2050cork oak stands.2274 In fact, they 7866 persist throughout
11,120 global warming, with
35,771 a limited
57,031
reduction
2070 in surface. Focusing on 5963
1819 haplotypes, the purple haplotype
8359 19,710 would majorly
35,851 suffer
from the effects of a drier climate; there would be up to a 62% decrease in its present
distribution at the end of the century. Each of the other haplotypes would undergo a the-
oretical reduction of ca. 35%.in temperature and precipitation, as predicted for 2050 and 2070 by the thirteen global circulation
models listed in Table 1. Numbers refer to residual surfaces expressed as cells of 1 square kilometer
containing cork oak forests. The geographical location is shown in Figure 7.
Orange Blue Green Purple Total
Present 2707 8970 12,929 51,773 76,739
Forests 2022, 13, 252 11 of 15
2050 2274 7866 11,120 35,771 57,031
2070 1819 5963 8359 19,710 35,851
Figure 7. Cork oak distribution in the Mediterranean. Colors refer to haplotypes and to the areas
Figure 7. Cork oak distribution in the Mediterranean. Colors refer to haplotypes and to the areas
that will have Q-m values outside of the species climatogram in the next decades (see Figures 4–6);
that will have Q-m values outside of the species climatogram in the next decades (see Figures 4–6);
thus, they are not climatically suitable for the persistence of cork oak. Grey areas represent those
thus, they are
sites where thenot climatically
species will keepsuitable for the
safeguarded persistence
to increase theirofprobability
cork oak. of
Grey areas the
enduring represent those
conditions
sites
overwhere
time. the species will keep safeguarded to increase their probability of enduring the conditions
over time.
4. Conclusions
4. Conclusions
Environmental disasters strike many countries worldwide, and humans are fully re-
Environmental
sponsible for much ofdisasters
the damage strike many
caused countries
to forests. worldwide, and
Hydrogeological humans
instability andare fully
forest
responsible for much of the damage caused to forests. Hydrogeological instability
fires are frequent and natural, and the processes of regeneration are not enough to restore and forest
fires are frequent given
the ecosystems, and natural,
the highand the processes
frequency of regeneration
of those are notchange
episodes. Climate enoughistoacknowl-
restore the
ecosystems,
edged to have given the high
strong frequency
implications forof those
the episodes.
integrity Climate change
of ecosystems is survival
and the acknowledged
of spe- to
have
cies [41–44]. Wars and civil disorders are further factors menacing forests in [41–44].
strong implications for the integrity of ecosystems and the survival of species some
Wars and civil
hotspots, such disorders are further
as the Middle East and factors
Northmenacing forests
Africa [45]. in some hotspots,
The Mediterranean such
Basin as the
is par-
Middle
ticularly sensitive to those threats, and the status of the forests in these hotspots mirror to
East and North Africa [45]. The Mediterranean Basin is particularly sensitive
those threats,processes
the ongoing and the status of theabove
mentioned forests[46].
in these
Humanshotspots mirror the
are imposed ongoing
to directly processes
intervene
mentioned
with restoration actions, including species-assisted migration, reforestation, actions,
above [46]. Humans are imposed to directly intervene with restoration and
including species-assisted
defragmentation migration, reforestation, and defragmentation plans [24,47,48].
plans [24,47,48].
On the other hand, the urgent need for interventions and the dimensions of the target
areas mean that fast, broadly available solutions that are user-friendly with a low cost are
required. Methods or synthetic indexes fulfil those requirements, and several agencies have
already adopted them in applied research [49].
Since its creation, Emberger’s Index has been broadly adopted to synthesize the
phytoclimatic characteristics of a study site. The feasibility of obtaining raw data and
applying the formula has resulted in it becoming a successful solution, as demonstrated by
its large employment in technical reports, applied research, and forest projects after more
than 90 years since its creation [50,51]. In this study, we analyzed Emberger’s climatogram
for cork oak commonly used by experts to characterize the suitability of an area to host
the species with reforestation plans. Once the models are assessed for other species, weForests 2022, 13, 252 12 of 15
believe that Emberger’s Index could be easily used by foresters and experts involved in
forest restoration and reforestation projects of the Mediterranean ecosystems [52,53]. The
results evidenced the efficacy of the method but suggested the need for updated raw data
to be implemented into the formula. Indeed, differences arose in the Q-m values among
previously proposed climatograms and the climatogram we realized, so their shapes differ
significantly. Figure 2 clearly shows those divergences, among the pair “Quezel 1976–2003”
and “Emberger 1930-our result” in particular, mainly due to the sample used. In fact, the
original Emberger climatogram better approximates the real climatogram (cloud of green
dots) because the data collection is distributed homogenously around the Mediterranean.
With the updated process, characterization of the species now benefits from complete and
detailed distribution; thus, the climatogram shows the real spatial domain according to the
present occurrence of the target species. At the same time, it is important to be reminded
that inventories based on only remote sensing do not enable detailed range reconstruction,
while field surveys remain strategic to create a real distribution map.
New advances from the same detailed distribution and its employment in the Em-
berger criteria were found; given the full species occurrence, it was possible to correlate
the spatial abundance of the cork oak and climatic values, demonstrating the feasibility of
mapping the ecological optimum [54]. In addition, a comparison among putative refugia,
already identified in previous studies [55], and their relative positions within the cork oak
climatogram revealed a match with the maximum density of species presence. In fact, the
22 areas are mostly placed in the bottom-right part of the climatogram (see Figure 4), but the
GCMs projections for the coming century reveal a global shift towards drier and warmer
conditions. On the other hand, the species occurrence in the early 20th century is not
detailed and widely referenced; thus, the comparison with the actual range is hard to assess.
However, we can assume that variation in the distribution in a century is not significant for
a long-life tree, such as cork oak, so the responses to climate change can be stated by recent
investigations about tree dieback and changes in regeneration processes [56–59]. However,
we can presently deal with advanced remote sensing techniques, which are useful to obtain
punctual and refined data; by coupling that information with indexes, such as Emberger’s
Index, it is finally possible to monitor the responses of forest species to variations in climate,
at least for the next century. This allows us to better understand the ecological amplitude
and vulnerabilities of a target species [60,61]. Prediction models of climate might even
be employed for future reforestation and restoration activities, and they might be able to
output a more comprehensive framework of the future distribution of a species when used
in niche modelling approaches [62]. However, the application of a synthetic index, such
as Emberger’s Index, as a user-friendly tool, provides a refined approximation of species
distribution models by using only two variables.
The Joint Research Centre, on behalf of the European Commission, launched the
European Atlas of Forest Tree Species, with insights into the distribution and suitability
maps of the main tree species for the next century; the cork oak is obviously included [63],
and its relative probability of presence was estimated using local bioclimatic conditions.
Additional positive feedback might concern the combination of those models with Em-
berger’s climatograms, so choosing the species for a given area could be performed by
selecting those plants with optimal plasticity and physiologic characteristics.
Genetic information from previous studies has improved the possibility of explor-
ing the behavior of species, even at the haplotype level. Once the correlation between
genetic features and environmental variables is assessed, models can be developed to
select the most effective haplotypes or provenances of a given species to be used. At-
tempts to detect the regions of provenance of forest species, based on genetics, already exist
and refer to several species in Europe [64–66]. Further implementations can include the
edaphic adaptability of a species with its Emberger climatogram [67]. Finally, this study
might serve as exhortation to obtain more accurate species distribution maps, which are
currently commonly lacking in forestry studies, but are fundamental to approach many
investigations.Forests 2022, 13, 252 13 of 15
Supplementary Materials: The following are available online at https://www.mdpi.com/article/
10.3390/f13020252/s1, Supplementary Materials 1: Q-m diagrams showing the relative position of
real distribution of cork oak forests (green points cloud) within the Daget’s Mediterranean isoclimate
(grey points cloud) at present time (A), 2050 (B), 2070 (C). Each point of the clouds represents a surface
of 30 arc-seconds (ca. 1 km2 ); Supplementary Materials 2: Insert Q-m values to get the suitability
class of a site.
Author Contributions: Conceptualization, B.S.; methodology, all authors; software, F.V.; original
draft preparation, writing, review and editing, all authors. All authors have read and agreed to the
published version of the manuscript.
Funding: This research received no external funding.
Conflicts of Interest: The authors declare no conflict of interest.
References
1. Daget, P.H. Le bioclimat Mediterraneen: Caractères généraux, modes de caractérisation. Vegetatio 1977, 34, 1–20. [CrossRef]
2. Aschmann, H. A restrictive definition of Mediterranean climates. Bull. Soc. Bot. Fr. Act. Bot. 1984, 131, 21–30. [CrossRef]
3. Trigo, R.; Xoplaki, E.; Zorita, E.; Luterbacher, J.; Krichak, S.O.; Alpert, P.; Jacobeit, J.; Sáenz, J.; Fernández, J.; González-Rouco, F.; et al.
Relations between variability in the Mediterranean region and mid-latitude variability. In Developments in Earth and Environmental
Sciences; Lionello, P., Malanotte-Rizzoli, P., Boscolo, R., Eds.; Elsevier: Amsterdam, The Netherlands, 2006; Volume 4, pp. 179–226.
[CrossRef]
4. Köppen, W. Une nouvelle classification générale des climats. Rev. Gen. Sc. 1918, 30, 550–554.
5. Emberger, L. Les limites de l’aire de végétation méditerranéenne en France. Bull. Soc. Hist. Nat. Toul. 1943, 78, 158–180.
6. Aschmann, H. Distribution and peculiarity of Mediterranean ecosystems. In Mediterranean Type Ecosystems; Springer:
Berlin/Heidelberg, Germany, 1973; pp. 11–19.
7. Giacobbe, A. Schema di una teoria ecologica per la classificazione della vegetazione italiana. Plant Biosyst. 1938, 45, 37–121.
[CrossRef]
8. Bérenger, M. Mémorial de la Météorologie Nationale: Essai d’Etude Météorologique du Bassin Méditerranéen; Imp. Nationale: Paris,
France, 1955.
9. Quézel, P. Definition of the Mediterranean region and the origin of its flora. In Plant Conservation in the Mediterranean Area.
Geobotany 7; Gomez-Campo, C., Ed.; W. Junk: Dordrecht, The Netherlands; Boston, MA, USA; Lancaster, UK, 1985; pp. 9–24.
10. Quézel, P.; Barbero, M. Carte de la Végétation Potentielle de la Région Méditerranéenne: Feuille n◦ 1 Méditerranée Orientale; Ed. du
Centre National de la Recherche Scientifique (CNRS): Paris, France, 1985.
11. Médail, F.; Quézel, P. Hot-spots analysis for conservation of plant biodiversity in the Mediterranean Basin. Ann. Mo. Bot. Gard.
1997, 84, 112–127. [CrossRef]
12. Rivas-Martínez, S.; Penas, A.; Díaz, T.E. Bioblimatic Map of Europe. Cartographic Service; University of Léon: Leon, Spain, 2004.
13. Mitrakos, K. A theory for Mediterranean plant life. Acta Oecol. 1980, 1, 245–252.
14. Emberger, L. La végétation de la Région Méditerranéenne: Essai d’une classification des groupenments végétaux. Rev. Génerale
Bot. 1930, 42, 642–662.
15. Sauvage, C. Le quotient pluviothermique d’Emberger, son utilisation et la representation géographique de ses variations au
Maroc. Ann. Phys. Globe Météo Inst. Sci Chérif. 1963, 20, 11–23.
16. Le Houérou, H.N. An outline of the bioclimatology of Libya. Bull. Société Bot. Fr. Actual. Bot. 1984, 131, 157–178. [CrossRef]
17. Gavilán, R.G. The use of climatic parameters and indices in vegetation distribution. A case study in the Spanish Sistema Central.
Int. J. Biometeorol. 2005, 50, 111–120. [CrossRef] [PubMed]
18. Rego, F.C.; Rocha, M.S. Climatic patterns in the Mediterranean region. Ecol. Mediterr. 2014, 40, 49–59. [CrossRef]
19. Haghighi, A.T.; Zaki, N.A.; Rossi, P.M.; Noori, R.; Hekmatzadeh, A.A.; Saremi, H.; Kløve, B. Unsustainability Syndrome—From
meteorological to agricultural drought in arid and semi-arid regions. Water 2020, 12, 838. [CrossRef]
20. Nikolova, N.; Yanakiev, D. Climate aridity in southern Bulgaria for the period 1961–2015. Forum Geografic. Stud. Cercet. Geogr.
Protect, ia Mediu. 2020, XIX, 10–17. [CrossRef]
21. Golvan, Y.; Rioux, J. Ecologie des mérions du Kurdistan Iranien: Relations avec l’épidémiologie de la peste rurale. Ann. Par. Hum.
Comp. 1961, 36, 449–558. [CrossRef]
22. Despois, J.; Raynal, R. Géographie de l’Afrique du Nord-Ouest; Payot: Paris, France, 1967; Volume 26.
23. Dumroese, R.K.; Palik, B.J.; Stanturf, J.A. Forest restoration is forward thinking. J. For. 2015, 113, 430–432. [CrossRef]
24. Schirone, B.; Radoglou, K.; Vessella, F. Conservation and restoration strategies to preserve the variability of cork oak
Quercus suber—A Mediterranean forest species-under global warming. Clim. Res. 2017, 71, 171–185. [CrossRef]
25. Nahal, I. Le Pin d’Alep (Pinus halepensis Mill.). 1962, Étude taxonomique, phytogéographique, écologique et sylvicole. Ann. Ecole
Nat. Eaux For. Stat. Rech. Exp. For. 1962, 19, 477–688.
26. Quezel, P. Les forêts du pourtour méditerranéen. In Forêts et Maquis Méditerranéens: Écologie, Conservation et Aménagement;
Note Technique MAB, 2; UNESCO: Paris, France, 1976; pp. 9–33.Forests 2022, 13, 252 14 of 15
27. Daget, P. Le Bioclimat Mediterraneen: Analyse des formes climatiques par le systeme d’Emberger. Vegetatio 1977, 34, 87–103.
[CrossRef]
28. Quézel, P.; Tomaselli, R.; Morandini, R. Bosque y Maquia Mediterráneos: Ecología, Conservación y Gestión [Mediterranean Forest and
Maquis: Ecology, Conservation and Management]; Serbal/UNESCO: Paris, France, 1977; Volume 333.75. Q5.
29. Guara Requena, M.; Laguna Lumbreras, E.; Sanchis Duato, E. Aproximacion cartografica a la distribucion del indice de Emberger
en la Comunidad Valenciana. Collect. Bot. Barcinonensi Bot. Inst. Ed. 1986, 16, 355–363.
30. Quézel, P.; Médail, F. Ecologie et Biogéographie des Forêts du Bassin Méditerranéen: Collection Environnement; Elsevier: Paris,
France, 2003.
31. Dufour-Dror, J.M.; Ertas, A. Bioclimatic perspectives in the distribution of Quercus ithaburensis Decne. subspecies in Turkey and in
the Levant. J. Biogeogr. 2004, 31, 461–474. [CrossRef]
32. Klausmeyer, K.R.; Shaw, M.R. Climate change, habitat loss, protected areas and the climate adaptation potential of species in
Mediterranean ecosystems worldwide. PLoS ONE 2009, 4, e6392. [CrossRef] [PubMed]
33. IPCC. Climate Change: Synthesis Report. Contribution of Working Groups I, II and III to the Fifth Assessment Report of the
Intergovernmental Panel on Climate Change; IPCC: Geneva, Switzerland, 2014.
34. Aronson, J.; Pereira, J.S.; Pausas, J.G. Cork Oak Woodlands on the Edge: Ecology, Adaptive Management, and Restoration; Island Press:
Washington, DC, USA; Covelo, Italy; London, UK, 2009.
35. Magri, D.; Fineschi, S.; Bellarosa, R.; Buonamici, A.; Sebastiani, F.; Schirone, B.; Simeone, M.C.; Vendramin, G.G. The distribution
of Quercus suber chloroplast haplotypes matches the palaeogeographical history of the western Mediterranean. Mol. Ecol. 2007,
16, 5259–5266. [CrossRef]
36. Vessella, F.; Simeone, M.C.; Schirone, B. Quercus suber range dynamics by ecological niche modelling: From the Last Interglacial to
present time. Quat. Sci Rev. 2015, 119, 85–93. [CrossRef]
37. Correia, A.; Costa-e-Silva, F.; Dubbert, M.; Piayda, A.; Pereira, J. Severe dry winter affects plant phenology and carbon balance of
a cork oak woodland understorey. Acta Oecol. 2016, 76, 1–12. [CrossRef]
38. Simeone, M.C.; Papini, A.; Vessella, F.; Bellarosa, R.; Spada, F.; Schirone, B. Multiple genome relationships and a complex
biogeographic history in the eastern range of Quercus suber L. (Fagaceae) implied by nuclear and chloroplast DNA variation.
Caryologia 2009, 62, 236–252.
39. Emberger, L. Nouvelle contribution à l’étude de la classification des groupements végétaux. Rev. Gén. Bot. 1933, 45, 473–486.
40. Hijmans, R.J.; Cameron, S.E.; Parra, J.L.; Jones, P.G.; Jarvis, A. Very high resolution interpolated climate surfaces for global land
areas. Int. J. Climatol. 2005, 25, 1965–1978. [CrossRef]
41. Araújo, M.B.; Cabeza, M.; Thuiller, W.; Hannah, L.; Williams, P.H. Would climate change drive species out of reserves?
An assessment of existing reserve-selection methods. Glob. Change Biol. 2004, 10, 1618–1626. [CrossRef]
42. Thomas, C.D.; Cameron, A.; Green, R.E.; Bakkenes, M.; Beaumont, L.J.; Collingham, Y.C.; Erasmus, B.F.; De Siqueira, M.F.;
Grainger, A.; Hannah, L. Extinction risk from climate change. Nature 2004, 427, 145–148. [CrossRef]
43. Thuiller, W.; Lavorel, S.; Araújo, M.B.; Sykes, M.T.; Prentice, I.C. Climate change threats to plant diversity in Europe. Proc. Natl.
Acad. Sci. USA 2005, 102, 8245–8250. [CrossRef]
44. Carnicer, J.; Colla, M.; Ninyerola, M.; Pons, X.; Sánchez, G.; Peñuelas, J. Widespread crown condition decline, food web disruption,
and amplified tree mortality with increased climate change-type drought. Proc. Natl. Acad. Sci. USA 2011, 108, 1474–1478.
[CrossRef]
45. Schirone, B.; Al-Hirsh, I.; Al-Qaddi, N.; Battisti, C.; Vessella, F.; Marras, T.; Ortolani, R.M. Parallel disasters: Wars and biodiversity
loss in mountain areas. Reforesta 2016, 1, 76–80. [CrossRef]
46. Bonan, G.B. Forests and climate change: Forcings, feedbacks, and the climate benefits of forests. Science 2008, 320, 1444–1449.
[CrossRef]
47. Stanturf, J.A.; Palik, B.J.; Williams, M.I.; Dumroese, R.K.; Madsen, P. Forest restoration paradigms. J. Sustain. For. 2014, 33,
S161–S194.
48. Dumroese, R.K.; Williams, M.I.; Stanturf, J.A.; Clair, J.B.S. Considerations for restoring temperate forests of tomorrow: Forest
restoration, assisted migration, and bioengineering. New For. 2015, 46, 947–964. [CrossRef]
49. Artz, R.; Anastasoiu, D.; Arrouays, D.; Bastos, A.; Benedetti, A.; Pagliai, M. European Atlas of Soil Biodiversity; Publication Office of
the European Union: Luxembourg, 2010.
50. Caloiero, T.; Callegari, G.; Cantasano, N.; Coletta, V.; Pellicone, G.; Veltri, A. Bioclimatic analysis in a region of southern Italy
(Calabria). Plant Biosyst. 2016, 150, 1282–1295. [CrossRef]
51. Barrón, L.G.; Morales, J.; Sousa, A. Time analysis of Emberger’s Pluviothermic Q Index in the SW of the Iberian Peninsula.
In Patterns and Mechanisms of Climate, Paleoclimate and Paleoenvironmental Changes from Low-Latitude Regions, Proceedings of the
Conference of the Arabian Journal of Geosciences (CAJG-1), Sousse, Tunisia, 12–15 November 2018; Zhang, Z., Khélifi, N., Mezghani, A.,
Heggy, E., Eds.; Springer: Berlin/Heidelberg, Germany, 2019; pp. 45–47.
52. FAO; CIFOR. FAO Framework Methodology for Climate Change Vulnerability Assessments of Forests and Forest Dependent People;
Forestry Paper 183; FAO: Rome, Italy, 2019.
53. Balekoglu, S.; Caliskan, S.; Dirik, H. Effects of geoclimatic factors on the variability in Pinus pinea cone, seed, and seedling traits in
Turkey native habitats. Ecol. Process. 2020, 9, 55. [CrossRef]Forests 2022, 13, 252 15 of 15
54. Van Couwenberghe, R.; Collet, C.; Pierrat, J.-C.; Verheyen, K.; Gégout, J.-C. Can species distribution models be used to describe
plant abundance patterns? Ecography 2013, 36, 665–674. [CrossRef]
55. Médail, F.; Diadema, K. Glacial refugia influence plant diversity patterns in the Mediterranean Basin. J. Biogeogr. 2009, 36,
1333–1345. [CrossRef]
56. Acácio, V.; Dias, F.S.; Catry, F.X.; Bugalho, M.N.; Moreira, F. Canopy cover loss of Mediterranean oak woodlands: Long-term
effects of management and climate. Ecosystems 2021, 24, 1775–1791. [CrossRef]
57. Montero-Muñoz, J.L.; Ureña, C.; Navarro, D.; Herrera, V.; Alonso-Rojo, P.; Hernández-Alonso, H.; Cepeda-González, M.F.;
Jovellar, L.C.; Fernández-Santos, B.; Silla, F. Regeneration dynamics in fragmented landscapes at the leading edge of distribution:
Quercus suber woodlands as a study case. Plant Soil 2021, 467, 311–327. [CrossRef]
58. Rossetti, I.; Bagella, S. Mediterranean Quercus suber wooded grasslands risk disappearance: New evidences from Sardinia (Italy).
For. Ecol. Manag. 2014, 329, 148–157. [CrossRef]
59. Touhami, I.; Chirino, E.; Aouinti, H.; El Khorchani, A.; Elaieb, M.T.; Khaldi, A.; Nasr, Z. Decline and dieback of cork oak
(Quercus suber L.) forests in the Mediterranean basin: A case study of Kroumirie, Northwest Tunisia. J. For. Res. 2020, 31,
1461–1477. [CrossRef]
60. Condés, S.; García-Robredo, F. An empirical mixed model to quantify climate influence on the growth of Pinus halepensis Mill.
stands in South-Eastern Spain. For. Ecol. Manag. 2012, 284, 59–68. [CrossRef]
61. Aabdousse, J.; Wahid, N.; Faida, R.; Karaoui, I.; Boulli, A.; Hassib, A. Determination of the effect of biogeographic variability on
myrtle ecology in Morocco using a combination of GIS and bioclimatic indices. J. Mater. Environ. Sci. 2021, 12, 1209–1225.
62. Vessella, F.; López-Tirado, J.; Simeone, M.C.; Schirone, B.; Hidalgo, P.J. A tree species range in the face of climate change:
Cork oak as a study case for the Mediterranean biome. Eur. J. For. Res. 2017, 136, 555–569. [CrossRef]
63. Houston Durrant, T.; de Rigo, D.; Caudullo, G. Quercus suber in Europe: Distribution, habitat, usage and threats. In European
Atlas of Forest Tree Species; San-Miguel-Ayanz, J., de Rigo, D., Caudullo, G., Houston Durrant, T., Mauri, A., Eds.; Publication
Office of the European Union: Luxembourg, 2016; p. e01ff11.
64. Alía, R.; Gómez, A.; Agúndez, M.; Bueno, M.; Notivol, E. Levels of genetic differentiation in Pinus halepensis Mill. in Spain
using quantitative traits, isozymes, RAPDs and cp-microsatellites. In Genetic Response of Forest Systems to Changing Environmental
Conditions; Springer: Dordrecht, The Netherlands, 2001; pp. 151–160.
65. Derory, J.; Mariette, S.; Gonzaléz-Martínez, S.C.; Chagné, D.; Madura, D.; Gerber, S.; Brach, J.; Persyn, F.; Ribeiro, M.M.; Plomion, C.
What can nuclear microsatellites tell us about maritime pine genetic resources conservation and provenance certification strategies?
Ann. For. Sci. 2002, 59, 699–708. [CrossRef]
66. Martín, J.; Esteban, L.; de Palacios, P.; Fernandez, F.G. Variation in wood anatomical traits of Pinus sylvestris L. between Spanish
regions of provenance. Trees 2010, 24, 1017–1028. [CrossRef]
67. Reis, F.; Soares-Castro, P.; Costa, D.; Tavares, R.M.; Baptista, P.; Santos, P.M.; Lino-Netoa, T. Climatic impacts on the bacterial
community profiles of cork oak soils. Appl. Soil Ecol. 2019, 143, 89–97. [CrossRef]You can also read


