Flight schedule adjustment for hub airports using multi-objective optimization - De Gruyter
←
→
Page content transcription
If your browser does not render page correctly, please read the page content below
Journal of Intelligent Systems 2021; 30: 931–946 Research Article Mei Tao*, Lan Ma, and Yiming Ma Flight schedule adjustment for hub airports using multi-objective optimization https://doi.org/10.1515/jisys-2020-0114 received November 10, 2020; accepted June 17, 2021 Abstract: Based on the concept of “passengers self-help hubbing,” we build a flight schedule optimization model where maximizing the number of feasible flight connections, indicating transfer opportunities, as one objective and minimizing total slot displacements as the other objective. At the same time, the “Demand Smoothing Model” is introduced into the flight schedule optimization model to reduce the queuing delays for arrival and departure flights. We take into account all aircraft itineraries, the difficulty level of schedule coordination, and the maximum displacement of any single flight acceptable to airlines when optimizing flight schedule. Given an original schedule, the model produces a feasible modified schedule that obeys the slot limits specified for an airport without canceling any flights, increases transfer opportunities, and improves on-time performance for hub airports while reducing interference with airline scheduling preferences. The model was verified with the operating data of the Urumqi international airport, and the results show that minor adjustments to flight schedules can increase the transfer opportunities of the airport and significantly reduce flight queuing delays. Keywords: hub airport, flight schedule optimization, feasible flight connections, flight queuing delay, flight slot displacements 1 Introduction A hub-and-spoke aviation system is an advanced form of air transportation organization commonly used by large airlines and airports in the world today. It has many advantages such as optimizing route network structure, rationally allocating resources, reducing airlines’ operating costs, and promoting hub airport prosperity. Now the European and American regions have more advanced and developed hub-and-spoke air transport network systems, but such systems in the Asia-Pacific region are still under development. In order to attract airlines and passengers, neighboring countries around China are actively strengthening the development of hub airports. Singapore Changyi Airport, Jakarta Sukarno-Hada Airport, Seoul Incheon International Airport, Tokyo Narita International Airport, Bangkok International Airport have been hub airports with a high percentage of international transfer passengers. Realizing the need of accelerating the development of hub-and-spoke aviation system to be competitive in global aviation network, “National Civil Aviation Airport Plan” (2017 edition) in China proposed to build a modern airport system with extensive coverage, reasonable distribution, complete functions, and intensive environmental protection by 2025, forming 3 world-class multi-airport systems, 10 international hubs, and 29 regional hubs. * Corresponding author: Mei Tao, Department of Airspace Planning and Aeronautical Information, College of Air Traffic Management, Civil Aviation University of China, Tianjin 300300, China, e-mail: mtaocauc@163.com Lan Ma: Department of Airspace Planning and Aeronautical Information, College of Air Traffic Management, Civil Aviation University of China, Tianjin 300300, China Yiming Ma: Department of Avionics, Sino-European Institute of Aviation Engineering, Civil Aviation University of China, Tianjin 300300, China Open Access. © 2021 Mei Tao et al., published by De Gruyter. This work is licensed under the Creative Commons Attribution 4.0 International License.
932 Mei Tao et al.
80%
70%
60%
50%
40%
30%
20%
10%
0%
CLT ATL ORD CAN PVG PEK
Figure 1: Comparison of transfer rates of major hub airports between China and the United States.
Passenger transfer rate is an important index of classifying a hub airport. At present, the transfer level
of main hub airports in China is obviously insufficient. The comparison of the transfer rate of major hub
airports between China and the United States is shown in Figure 1. After deregulation, some US legacy
airlines started a hub-and-spoke network and use hub airports as their bases. For example, Atlanta Inter-
national Airport (ATL) is one of the hubs of Delta airlines and the market share of operations of Delta at ATL
is about 80%. Charlotte Douglas International Airport (CLT) was one of the hubs of US Airways. After the
merger of US Airways and American Airlines (AA), CLT continues to be one of the ten domestic hubs of AA,
as the gateways to the Caribbean and Europe for the US Southeast market. AA’s market share accounts for
about 88% of CLT’s operation. The market concentration of hub airports in China is not high, and the
proportion of flights of airlines in some main hub airports is shown in Figure 2. From the data in Figure 2, we
can see no airlines dominate the operations at these airports. Similar phenomena are observed at other
national and regional hub airports in China. Compared to the situation in the US, it is difficult for hub
airports in China to rely on a single airline to increase the passenger transfer rate. While turning to the
European aviation network, Malighetti observed that two-third of the fastest connecting flights do not
belong to the same airline or the same airline alliance in the European aviation market [1]. He gave such
phenomenon a terminology of “passengers self-help hubbing,” i.e. passengers choosing connecting itin-
erary based on the route network and flight time of different airlines [1]. Our study draws on this concept
and proposes to optimize flight schedules at hub airports so as to provide passengers with more feasible
transfer opportunities. With “passengers self-help hubbing,” the optimized flight schedule can help
increase passenger transfer rate and improve the competitiveness of the airport.
First Second Third others
120%
100%
80%
60%
40%
20%
0%
PEK SHA CAN CKG KWE
Figure 2: Proportion of airline flights in some main hub airports in China.
With the development of hub airports around the world, many scholars have studied the hub airport’s
transfer capabilities to analyze the competitiveness of airports and airlines. These research studies are
mainly divided into two categories. One focuses on the spatial characteristics of the aviation hub networkFlight schedule optimization model 933
and analyzes the air route network topology of airlines or airports by complex network theory [2–5], and the
other focuses on the temporal characteristics of the aviation hub network. Flight schedule analysis models
are established to evaluate the connection capabilities of airlines or airports. The proportion of feasible
flight connections was proposed to evaluate the connection capability of the airport [6–8]. The weighted
indirect connections (WNX) that considered comprehensively the impact of transfer time and the quality of
the indirect flight compared to the direct flight in a weighted manner was proposed to assess the airport or
airline’s connection capabilities [9]. The NETSAN model that considered comprehensively the number and
quality of direct and non-direct flights in a weighted manner is used to evaluate the connectivity of the hub
airport [10]. The eight different hub airport connectivity assessment models are compared and analyzed,
and each model is applied to the European air transport network [11]. The NETSCAN Connectivity Index is
also used to evaluate the airport connectivity of Don Mueang International Airport in Thailand [12]. Some
Chinese researchers also studied hub airport transfer capability based on temporal characteristics of the
aviation hub network. Considering passenger transfer waiting costs and flight waves, a flight frequency
optimization model is established with the objective function of maximizing airline benefits [13]. The
structural evolution of the flight wave system of Chinese hub airports and the spatiotemporal characteristics
of the feeding routes of hub airports with obvious flight wave systems were analyzed [14]. Taking Beijing
Capital International Airport as the research object, a quantitative method was proposed to describe the
spatial and temporal network configuration and differentiation structure of the flight schedule [15].
A transfer level evaluation model from the perspective of the layout of the airport route network and flight
slot distribution was constructed [16].
On the other hand, based on the well-known observation that, for a given number of flight schedules in
a day, the more evenly they are distributed along the day, the lower expected delays will be. Some
researchers studied how to mitigate congestion through schedule coordination. A mathematical model
was developed by comprehensively applying the deterministic queuing model and economic model.
They considered the tradeoff between flight delay costs and flight schedule displacement costs caused
by flight slot constraints to determine the appropriate scheduling limits for airports [17]. A stochastic
optimization model was used to determine the number of arrival slots that should be allocated to airlines
at a congested airport during different time intervals across the course of a single day. The innovation of
their approach takes into account the long-term uncertainty induced in arrival or departure capacities
because of weather conditions [18]. A demand smoothing (DS) optimization model was established that
can generate a new feasible flight schedule that obeyed the scheduling limits without canceling any flights.
By applying the DS model, on the one hand, substantial delay reductions could be achieved and, on the
other, interference with airline scheduling preferences could be reduced [19].
However, none of the above studies considered taking the increase of airport transfer opportunities as
one of the objectives while optimizing airport flight schedules. In this study, we propose to optimize flight
schedules at one airport considering both the operational efficiency (delay) and hub airport competitive-
ness (transfer opportunities). We use Urumqi airport as a case study to demonstrate the proposed method
and evaluate potential benefits.
2 Flight schedule optimization mechanism
The objective of this paper is to develop a mathematical model to optimize flight schedules at the strategic
level of air traffic demand management to increase transfer opportunities and improve on-time performance
for hub airports. The number of feasible flight connections is used to quantify transfer opportunities. The
feasible flight connections refer to those connections that are competitive, operationally feasible, and
sufficiently convenient transfer opportunities between arriving and departing flights including coordinated
transfers and self-help transfers. The coordinated transfers are those planned by airlines for passengers.
The self-help transfer means passengers use the advantage of available flights at a particular airport to
create their own connection. Assuming that the original flight schedule is the most desired setting for all934 Mei Tao et al.
airlines, the proposed flight schedule optimization model considers minimizing total slot displacements as
one objective and maximizing the number of feasible flight connecting seats as the other objective. While
optimizing flight schedules to increase the airport’s transfer opportunities, a “demand smoothing model”
[19] is introduced into the flight schedule optimization model to reduce the number of flights during peak
hours to a certain extent, and to reduce the queuing delay of departure and arrival flights. The “demand
smoothing model” aims at spreading departures and arrivals more evenly throughout the day by placing
slot limits on the number of movements that airlines may schedule per unit time at an airport. Slot limits,
i.e. the maximum total number of departures and arrivals, at the congested airport in China usually are set
on a 60 min basis and they are for both departures and arrivals. For example, slot limits at Beijing Capital
Airport were 88 in any 60 min period in 2017. There are two disadvantages of these simple slot limits. First,
slot limits set on a 60 min basis cap the total operations scheduled in that hour, but within that hour, there
is possibly a surge of scheduled flights that could cause significant delays. Refining the resolution of the slot
limit time unit, e.g. from every 60 to 15 min, could alleviate such a problem. Second, the current slot limits
do not consider the runway capacity trade-off while serving different fleet mixes of arrivals and departures.
Even the total scheduled operations do not exceed slot limits, there might be delays if there are significant
more arrivals or departures in one hour because runway capacity is lower under this circumstance com-
pared to when the mix is more balanced. Thus, besides slot limits on the total operations, we may add
constraints limiting the number of scheduled arrivals and departures within the refined time unit, every
15 min. The setting of the constraints will be based on the analysis of historical operational throughput of
every 15 min, which will be elaborated on in later sections.
However, the adjustment of flight schedules will interfere with the competitive environment of airlines.
To ensure equity among airlines, we need to set a threshold of maximum displacement for each operation
and take that as one of the constraints. The threshold of the maximum displacement is a parameter that can
be varied to test how the optimal solutions would change accordingly. The other constraint while modeling
the flight schedule optimization is to maintain aircraft flight task connection. A minimal connecting time
needs to be maintained to ensure the feasibility of aircraft and passenger itineraries. With the outputs of the
optimization model, we can calculate the increase of the number of feasible flight connections and avail-
able flight connecting seats, and the decrease in arrival and departure queuing delays compared to the
status quo. Figure 3 shows the flow chart of the flight schedule optimization scheme.
Airport operational
throughput Original flight schedule
The maximum number of
Flight slot limits feasible flight connecting
(several schemes) seats
Flight Schedule
Without reducing number of
Flight slot displacement Optimization Model
flights
acceptable to airlines Without changing aircraft
(different displacements) flight task connection
Optimized flight schedule 1 Optimized flight schedule n
Calculate number of feasible flight connecting seats
Calculate arrival and departure queuing delay
The airport, airlines and air traffic control
department make a decision collaboratively
The optimal flight schedule
Figure 3: Flight schedule optimization mechanism.Flight schedule optimization model 935
3 Flight schedule optimization model
In this paper, we take the flight schedule of 1 day in the summer and autumn flight seasons of airport W as
the research object and establish the flight data set, time interval data set, and flight slot data set for airport
flight schedule optimization problem. The main sets involve the set of departure and arrival flights
F = {1,…, f } , the set of time intervals P = {1,…, p } , and the set of flight slots T = {1,…, t } . In the set P , the
length of each time interval is assumed to be equal to 15 min, so there are 96 periods in this set. We define
00:00–00:15 as the first period, 00:15–00:30 as the second period, and so on until 23:45–24:00 as the 96th
period. In set T, the flight slot is defined as an interval of 5 min. We define 00:00 as slot 1, 00:05 as slot 2,
and so on until 23:55 as slot 288.
3.1 Parameters and variables
Every flight i or j is associated with a departure slot, a departure period, a departure airport, an arrival slot,
an arrival period, and an arrival airport. We define the following parameters ∀ i, j ∈ F , i ≠ j , ∀p ∈ P , ∀t ∈ T .
Parameters:
1, if flight i is originally scheduled to arrive in period p;
Sipa = ⎧
⎨
⎩ 0, otherwise;
1, if flight i is originally scheduled to departure in period p;
Sipd = ⎧
⎨
⎩ 0, otherwise;
tia : the arrival slot of flight i in the original schedule;
tid : the departure slot of flight i in the original schedule;
Nij : the number of feasible flight connections;
Rij : the detour factor;
AiW : the distance between the origin airport and the transfer airport W of flight i ;
D Wj : the distance between the transfer airport W and the destination airport of flight j ;
Dij : the great circle distance between the origin airport of flight i and the destination airport of flight j ;
Tij : the connecting time between flight j and flight i ;
Cqa/ Cqd/ Cqt : arrival/departure/total flight slots number available for allocation in 15 min;
mijmin : the minimum aircraft turnaround time between flight j and flight i when they use the same
aircraft;
mijmins : the minimum connecting time between flight j and flight i when flight j is a coordinated
connecting flight of flight i with the same flight number;
mijminc : the minimum connecting time between flight j and flight i when flight j is a coordinated con-
necting flight of flight i with different flight numbers;
mijmaxs : the maximum connecting time between flight j and flight i when a flight j is a coordinated
connecting flight of flight i with the same flight number;
mijmaxc : the maximum connecting time between flight j and flight i when a flight j is a coordinated
connecting flight of flight i with different flight numbers;
MCT: the minimum connecting time for passengers to make the transfer;
MaxCT: the maximum connecting time for passengers to make the transfer;
δ : the maximum displacement of any single flight acceptable to airlines;
pij : the maximum number of seats provided to passengers when passengers transfer from flight i to
flight j ;
qi : the displacement weighted coefficient;
α : a positive weighted coefficient in the objective function;
The decision variables of this optimization model are as follows:936 Mei Tao et al.
1, if flight i is assigned to arrive in period p;
Ripa = ⎧
⎨
⎩ 0, otherwise;
1, if flight i is assigned to departure in period p;
Ripd = ⎧
⎨
⎩ 0, otherwise;
μi : the slot displacement of flight i .
3.2 Objective function
This paper takes the airport’s maximum transfer opportunities and minimum total weighted flight slot
displacements as the objective function. Hence, the objective function is to maximize
∑ pij Nij − α ∑ qi∣μi ∣
i∈F ,j∈F i∈F (1)
i≠j
1, 1 ≤ Rij ≤ 1.4 and MCT ≤ Tij ≤ MaxCT;
Nij = ⎧ ∀i, j ∈ F , i ≠ j (2)
⎨
⎩ 0, otherwise;
AiW + Dwj
Rij = , ∀i, j ∈ F , i ≠ j , (3)
Dij
Tij = [(t jd + 3μj ) − (tia + 3μi )] × 5, ∀i, j ∈ F , i ≠ j . (4)
The objective function is divided into two parts. The first part is the number of feasible connecting flight
seats that is used to represent transfer opportunities of an airport. The feasible connecting flight seats are
calculated as the summation of pij if the connection between flights i and j is feasible. The variable pij is
introduced to represent the maximum number of seats provided to passengers when passengers transfer
from flight i to flight j . It is determined by the minimal number of seats while comparing flight i and j .
Compared with direct flights, it will take longer travel times for passengers traveling by indirect flights,
consisting of connecting time and detour time. Feasible flight connections are flight connections that meet
the constraints of the detour time and the connecting time. The detour time passengers can accept is related
to the range, so we introduce a detour factor. The detour factor Rij means the in-flight time for an indirect
flight compared to the direct flight time. We assume that the distance is proportional to the flight time, so we
define the detour factor as the ratio of the sum of the flight distance of flight i and flight j to the distance in
the great circle between the origin airport of flight i and the destination airport of flight j . The connecting
time Tij is the time difference between the arrival time of flight i and the departure time of flight j in the
schedule. The maximum detour factor is usually less than or equal to 1.4 [16]. In addition, the connecting
time Tij should be greater than the minimum connecting time MCT required for passengers to make the
transfer and be less than the maximum connecting time MaxCT that passengers are willing to wait when
making the transfer. The minimum connecting time MCT that needs to be feasible for both passengers and
baggage depends on the terminal building layout, the capacity of BHS (baggage handling system), and the
availability of transport means. Usually, small airports tend to have significantly shorter MCT and they can
provide faster transfer connections. Large airports, on the other hand, are usually much more constrained
and can only offer relatively slow connections. The maximum connecting time, MaxCT, should be appro-
priate for different hub airports based on the main connection type such as long haul-short/medium haul or
short/medium-short/medium haul, etc. Many different proposals exist as parameters for MaxCT: Doganis
and Dennis propose a standard value of 90 min for all types of connections [20]. Danesi suggests a differ-
entiated set of values ranging from 90 to 180 min [21]. For the sake of model simplicity, we refer to fixed
maximum connecting times.Flight schedule optimization model 937
The second part of the objective function is the total weighted flight slot displacements, multiplication
of qi , and absolute value of μi . The slot displacement of flight μi is expressed as the number of 15 min
periods. For example, if the slot displacement of flight i is 15 min, then we set the corresponding value of
μi = 1. The variable qi is introduced to represent the weighted coefficient based on the difficulty level
of schedule coordination. For the purposes of airport schedule coordination, airports are categorized
into three levels by IATA (International Air Transport Association) according to congestion conditions at
the airports. In China, airports are categorized by CAAC (Civil Aviation Administration of China) according
to the relationship between flight demand and airport supply including main schedule coordinated air-
ports, secondary schedule coordinated airports, and non-schedule-coordinated airports. For each flight,
depending on if it is an arrival flight or a departure flight, qi is determined by the schedule coordination
level of the origin airport for the arrival flight and the destination airport for the departure flight. In terms of
the subject airport where we apply the schedule optimization, those airports are called related airports. For
international flights, if the related airport is the level 3 airport specified by IATA, then the schedule
coordination difficulty coefficient is defined as qi = 105, i.e. with a very large number so that these flights’
schedules should not be replaced. If the related airport is specified by IATA as an other level airport, the
schedule coordination difficulty coefficient is equal to 1. For domestic flights in China, if the related airport
is one of Beijing/Capital airport, Guangzhou/Baiyun airport, Shanghai/Pudong airport, and Shanghai/
Hongqiao airport, then the schedule coordination difficulty coefficient is of the highest level because these
airports are the most congested airports. We define qi = 105. In the process of adjusting flight schedules,
these flight schedules in these busiest airports will not be displaced. If the related airport is one of the main
coordination airports specified by CAAC other than the four airports described above, we define qi = 4. If the
related airport is the secondary coordination airport, we define qi = 2 . If the related airport is one of the non-
schedule-coordinated airports specified by CAAC, we define qi = 1. It is preferred to displace the flight slot of
the related airport as a non-schedule-coordinated airport when adjusting the flight schedule so that we can
ensure the feasibility of flight schedule optimization.
3.3 Constraints
(1) Ensure that each arrival fight is assigned to exactly one scheduled arrival time. Then,
∑ Ripa = 1, ∀i ∈ F . (5)
p∈P
(2) Ensure that each departure fight is assigned to exactly one scheduled departure time. Then,
∑ Ripd = 1, ∀i ∈ F . (6)
p∈P
(3) The arrival flight i in the original flight schedule is displaced to a time period p. Then,
∑ pRipa = ∑ pSipa + μi , ∀i ∈ F . (7)
p∈P p∈P
(4) The departure flight i in the original flight schedule is displaced to a time period p. Then,
∑ pRipd = ∑ pSipd + μi , ∀i ∈ F . (8)
p∈P p∈P
The combination of Constraints (3) and (4) ensures that scheduled block times are left unchanged.
(5) Ensure that the displacement of any single flight does not exceed the maximum displacement of any
single flight acceptable to airlines δ . The maximum displacement δ is also expressed as the number of
15 min periods. For example, if the maximum displacement is 30 min, then we set the corresponding
value of δ = 2 :
∣μi ∣ ≤ δ, ∀i ∈ F (9)938 Mei Tao et al.
(6) Meet the limit of airport flight slot numbers available for allocation in 15 min, so that
∑ Ripa ≤ Cqa, ∀p ∈ P , (10)
i∈F
∑ Ripd ≤ Cqd, ∀p ∈ P , (11)
i∈F
∑ Ripa + ∑ Ripd ≤ Cqt, ∀p ∈ P . (12)
i∈F i∈F
Constraints (10) ensure to meet the arrival flight slot limits in 15 min, Constraints (11) ensure to meet
the departure flight slot limits in 15 min, and Constraints (12) ensure to meet the total flight slot limits in
15 min.
(7) Aircraft connections maintained.
The flights in the flight schedule optimization model include all flights that arrive at airport W or that
leave from airport W. Sometimes the flight that arrives at airport W and the flight that leaves from airport W
are executed by the same aircraft. For instance, if an aircraft flies the itinerary A → W → B, then both flights
A → W and W → B are included in the model. The rescheduling of flight A → W might require a change in
the scheduled time of flight W → B to maintain a feasible connection between both flights. Just like the
above instance, the situation that an aircraft has two flight slots in the flight schedule may include the
following four scenarios.
(1) Given subject airport W, if the aircraft is used for flight i coming from airport A to airport W, and then
flight j leaving from airport W to airport B, the itinerary of the aircraft is A → W → B. If flights i and j
have the same flight number, then the connecting time between flights i and j should meet the
following constraints considering both aircraft connection and passenger connection because they
are coordinated connecting flights planned by airlines:
mijminsXij ≤ TijXij ≤ mijmaxsXij , ∀i, j ∈ F , i ≠ j , (13)
where
⎧ 1, if flight j is a coordinated connecting flight of
Xij = flight i with the same flight number;
⎨
⎩ 0, otherwise;
(2) If similar to that described in Scenario 1 but flights i and j have different flight numbers, then the
connecting time between flights i and j should meet the following constraints considering both aircraft
connection and passenger connections because they are coordinated connecting flights planned by
airlines:
mijmincYij ≤ TijYij ≤ mijmaxcYij, ∀i, j ∈ F , i ≠ j , (14)
where
⎧ 1, if flight j is a coordinated connecting flight of
Yij = flight i with different flight numbers;
⎨
⎩ 0, otherwise;
(3) In this scenario, flight i comes from airport A to airport W, and then flight j leaves from airport W back
to airport A. The itinerary of the aircraft is A → W → A and uses two flight slots at airport W including
one arrival slot and one departure slot. The duration between the departure time and the arrival time in
airport W should be larger than the minimum aircraft turnaround time:
mijminZij ≤ TijZij , ∀i, j ∈ F , i ≠ j , (15)Flight schedule optimization model 939
where
⎧ 1, if flight j is the return flight of flight i and the departure slot of
Zij = flight j at airport W is later than the arrival slot;
⎨
⎩ 0, otherwise;
(4) The last scenario is that flight i leaves airport W and arrives at airport A, and then flight j departure from
airport A and comes back to airport W. The itinerary of the aircraft is W → A → W and uses two flight
slots at airport W including one departure slot and one arrival slot. The duration between arrival time
and the departure time in airport W should be longer than the sum of the flight time from airport W to
airport A, the minimum aircraft turnaround time at airport A, and the flight time from airport A to
airport W. We force aircraft connecting time in the new flight schedule at airport A to be larger than the
minimum aircraft connecting time because the flight times of flight i and flight j are not changed:
ATij = {[(t ja + 3μj ) − FTj] − [(tid + 3μi ) + FTi]} × 5, ∀i, j ∈ F , i ≠ j (16)
mijminQij ≤ ATijQij , ∀i, j ∈ F , i ≠ j , (17)
where
FTi : flight time of flight i ;
ATij : the connecting time between flight i and flight j at airport A;
⎧ 1, if flight j is the return flight of flight i and the arrival slot of
Qij = flight j at airport W is later than the departure slot;
⎨
⎩ 0, otherwise.
FTi is expressed as the number of 5 min. For example, if the flight time of the flight i is 60 min, then we
set the corresponding value of FTi = 12 .
4 Numerical experiment
We take Urumqi International Airport (IATA: URC, ICAO: ZWWW) as the case for demonstrating the opti-
mization model. URC is currently one of the Chinese eight regional hub airports and is planned to become
one of the Chinese national gateway hub airports. Same as many other airports in China, there is no
dominant airline operating at URC. Thus, to improve the competitiveness of URC as a hub airport, it is
needed to increase its transfer opportunities and passenger self-help hubbing.
4.1 Input data
We obtained 1 day flight schedule of the Urumqi airport used in both summer and autumn flight seasons of
2017, which included 236 arrival and 237 departure flights. Figure 4 shows the scheduled arrivals, depar-
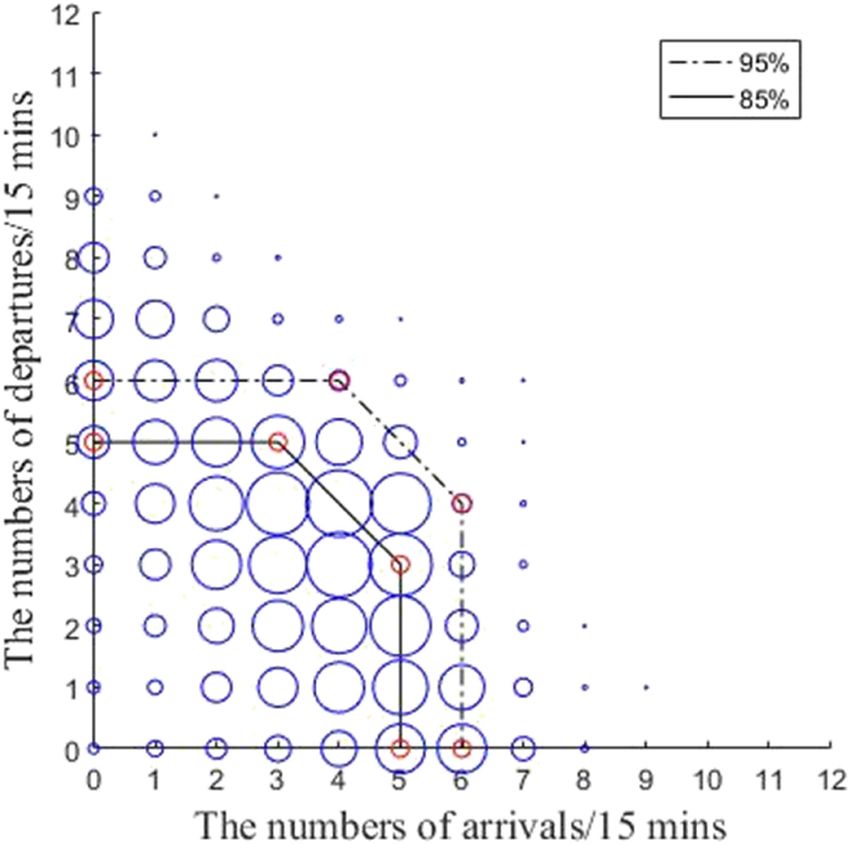
tures, and total operations in every 15 min for that day. To obtain the airport capacity profile, we utilized the
capacity evaluation method based on historical data to determine the airport operational throughput
envelope. Such method includes quantile regression and Graham scanning method to determine the convex
hull inflection point, with which the airport operational throughput envelope of URC based on the actual
operating data from June to September 2017 was obtained, as shown in Figure 5. The capacity envelopes of
95% confidence interval and 85% confidence interval are, respectively, described in Figure 5. Based on the
current slot limits, there are 32 operations per hour in the Urumqi airport, and the capacity envelope with an
85% confidence interval is determined as the operating capacity envelope. The seat numbers of different
types of aircraft in the flight schedule for that day are shown in Table 1. The minimum aircraft turnaround940 Mei Tao et al.
number of arrivals number of departures total number
15
OF FLIGHTS
10
NUMBEROF
NUMBER
5
0
1 4 7 10 13 16 19 22 25 28 31 34 37 40 43 46 49 52 55 58 61 64 67 70 73 76 79 82 85 88 91 94
TIME (15 MINUTES)
Figure 4: Arrival and departure flight slots distribution in every 15 min in the Urumqi airport original flight schedule.
time mijmin at the Urumqi airport is 45 min. We calculated mijmins , mijminc , mijmaxs, and mijmaxc of the in the flight
schedule. The mijmins is 45 min and the mijmaxs is 160 min; the mijminc is 45 min and the mijmaxc is 240 min. There
are three terminal buildings T1, T2, and T3, 111 check-in counters, 12 self-service check-in counters, 47
security channels, 12 outbound luggage turntables, and 9 inbound luggage turntables at the Urumqi air-
port. It is very convenient for passengers to transfer at the Urumqi airport. It takes passengers about 10 min
to walk between different terminals. According to the regulations of the operation department of the
Urumqi airport, the first baggage must appear in the carousel within 10 min after the flight arrives,
the last one should appear in the carousel within 40 min, and the average time for passengers to take
the luggage is 25 min. While waiting for luggage, passengers can complete self-service check-in through a
mobile app, and then check in luggage within 10 min. According to the regulations of the security depart-
ment in the Urumqi airport, the security staff needs to ensure that 95% of the passengers enter the security
queue and complete the security inspection within 10 min. It usually takes passengers 15 min from entering
the security queue to the boarding gate. If passengers need to transfer to an international flight, it will take
about 15 min to go through the customs. Considering the interference of uncertain factors, we add a 15 min
time margin. Usually, 90 min is enough for passengers to transfer at the Urumqi airport. So in this model,
we assume that the minimum connecting time MCT is 90 min, and the maximum connecting time MaxCT is
Figure 5: Operational throughput envelope within 15 min in the Urumqi airport.Flight schedule optimization model 941
Table 1: Seats numbers in aircraft types in the flight schedule
Aircraft type B738 B737 B752 B772 B763 A320 A319 A332 A321 E195 E190
Number of seats 162 149 239 550 269 150 124 293 186 122 114
180 min as passengers for self-connections not only wait between flights but have to be processed. We also
determine if flight j is the immediate successor of flight i based on the tail number of aircraft performing
flight i and flight j . The maximum displacements of any single flight acceptable to airlines are δ = 1 and
δ = 2 . Based on the operational throughput envelope within 15 min in the Urumqi airport shown in Figure 5,
we designed three test scenarios with different flight slot limits in 15 min (shown in Table 2). Together with
the two levels of the maximum displacement, we have a total of 6 settings for implementing the flight
schedule optimization.
4.2 Optimization results
We implemented the flight schedule optimization model in GAMS 25.1 using CPLEX MIP on an Intel(R) Core
Table 2: Schemes for the number of flight slots that can be allocated within 15 min
Scheme 1 Scheme 2 Scheme 3
No. of arrival flight slots 5 6 5
No. of departure flight slots 5 5 6
Total no. of arrival and departure flight slots 8 9 9
(TM) i7 running at 2.71 GHz and 16 GB RAM. For δ = 1 and δ = 2 and 3 slot allocation schemes, we obtained 6
optimized flight schedules. We analyzed feasible flight connections and delays of optimized flight
schedules.
4.2.1 Feasible flight connections
The number of feasible flight connections, the number of feasible connecting flight seats, and flight slot
displacements of every scheme are shown in Table 3. When δ = 1, the number of feasible flight connections
and the number of feasible connecting flight seats optimized by Scheme 3 are increased the most, by 27.2
and 27.9% respectively. When δ = 2 , the number of feasible flight connections and the number of feasible
connecting flight seats optimized by Scheme 1 are increased the most, by 32.6 and 33.8%, respectively.
4.2.2 Flight queuing delay
We take the optimized flight schedule and airport operational throughput as the input. We model the arrival
queue and the departure queue by means of two distinct M (t ) / Ek (t ) / 1 queuing systems. We take the runway
as a single server and the demand processes are modeled as Poisson processes, and the service processes
are modeled as Erlang processes of order k where k = 3 as used in the existing literature [22]. In this runway
queuing system, demand rates are calculated from the number of landings and takeoffs in the flight
schedule. Service rates are determined by the airport operational throughput envelope. Flight queuing942
Mei Tao et al.
Table 3: Optimization results by every scheme
Original value δ=1 δ=2
Scheme 1 Scheme 2 Scheme 3 Scheme 1 Scheme 2 Scheme 3
Optimal value of the objective function 191,769 189,640 198,126 202,312 195,216
183,988
No. of feasible flight connections 1,375 1,573 1,519 1,624 1,635 1,611
1,535
No. of feasible connecting flight seats 187,950 215,624 208,490 223,216 225,127 221,606
210,313
Arrival queue length (aircraft) 52 47 7 0 41 8
0
Departure queue length ( aircraft) 147 19 87 0 17 84
0
Total queue length (aircraft) 199 66 94 0 58 92
0
Flight slot displacements 0 201 160 282 255 247
220Flight schedule optimization model 943
delay is represented by the arrival and departure queue lengths at the end of the period p. Some new
parameters as follows are introduced. We define ∀ p ∈ P in these parameters.
ap : the arrival queue length at the end of period p;
dp : the departure queue length at the end of period p;
μpa : the arrival service rate selected during period p;
μpd : the departure service rate selected during period p;
αs / βs / γs : parameters defining each linear segment of the envelope;
So, the arrival and departure queue lengths can be calculated by the following formulation:
ap = ap − 1 + ∑ Ripa − μpa, ∀p ∈ P , (18)
i∈F
dp = dp − 1 + ∑ Ripd − μpd , ∀p ∈ P , (19)
i∈F
The service rates are represented by means of a piece-wise linear operational throughput envelope as
shown in Figure 5. We suppose that air traffic controllers adopt tactics of “service arrival aircraft first.” This
is consistent with the actual air traffic control method. The arrival and departure service rates are selected
among the set of achievable service rates determined by the operational throughput envelope. The opera-
tional throughput envelope can then be expressed by the following set of linear inequalities (20):
αsμpa + βsμpd ≤ γs, ∀p ∈ P , (20)
Arrival and departure queuing delays and flight slot displacements in the optimized flight schedule for
every scheme are shown in Table 3. When we use Scheme 1 to optimize flight schedule, the arrival queuing
delay and departure queuing delay are decreased to 0. The flight queuing delay distribution in every 15 min
of the optimized flight schedule by every scheme when δ = 1 is shown in Figure 6. From the comparison of
feasible flight connections, queuing delay, and flight slot displacements in Table 3, it can be seen that with
δ = 1, the feasible flight connections have been optimized to a certain extent and an increase of the maximal
displacement δ led to more total flight slot displacements but only slight improvement of feasible flight
connections and connecting flight seats. Similarly, when δ is relaxed from 1 to 2, the queuing delays of the
optimized flight schedule do not change much. When using Scheme 1 to optimize flight schedules, if we
take δ = 1, the total flight slot displacements are 220 15 min periods, and the number of feasible flight
connections is increased by 11.6%, the number of feasible connecting flight seats are increased by 11.9%,
and the arrival queuing delay and the departure queuing delay are both decreased to 0. If we take δ = 2 , the
total flight slot displacements are 282 15 min periods, and the number of feasible flight connections is
increased by 18.1%, the number of feasible connecting flight seats are increased by 18.8%, and the arrival
Original flight schedule Scheme 1 Scheme2 Scheme 3
12
TOTAL QUEUING DELAY
10
8
6
4
2
0
1 4 7 10 13 16 19 22 25 28 31 34 37 40 43 46 49 52 55 58 61 64 67 70 73 76 79 82 85 88 91 94
TIME 15 MINUTES
Figure 6: Flight queuing delays distribution in every 15 min of the optimized flight schedule by every scheme when δ = 1 .944 Mei Tao et al.
queuing delay and the departure queuing delay are also both decreased to 0. When we take δ = 1, it is
possible to significantly reduce the arrival and departure queuing delay with fewer flight slot displacements,
and at the same time increase the number of feasible flight connection seats at the airport. Schemes 2 and 3
both have higher total slot limits. Scheme 2 gives more flexibility of scheduling arrival flights while Scheme 3
gives the flexibility to scheduled departure flights. The optimized outcomes show that Scheme 3 will lead to
more arrival and departure queuing delays compared to other Schemes (see Figure 6). The arrival and
departure slot distributions within every 15 min in the optimized flight schedule by Scheme 1 and Scheme
2 when δ = 1 are shown in Figures 7 and 8. In this study, we only show the optimized flight schedule for six
settings of slot limits and maximal displacement. More settings can be generated and the optimized outcomes
could be analyzed and visualized. It provides decision support so that the airport, airlines, and the air traffic
control department can work collaboratively to determine the optimal flight schedule.
number of arrivals number of departures total numbers
10
NUMBER OF FLIGHTS
8
6
4
2
0
1 4 7 10 13 16 19 22 25 28 31 34 37 40 43 46 49 52 55 58 61 64 67 70 73 76 79 82 85 88 91 94
TIME(15 MINUTES)
Figure 7: Arrival and departure flight slot distribution in every 15 min in the optimized flight schedule by Scheme 1 when δ = 1 .
number of arrivals number of departures total numbers
10
NUMBER OF FLIGHTS
8
6
4
2
0
1 4 7 10 13 16 19 22 25 28 31 34 37 40 43 46 49 52 55 58 61 64 67 70 73 76 79 82 85 88 91 94
TIME (15 MINUTES)
Figure 8: Arrival and departure flight slot distribution in every 15 min in the optimized flight schedule by Scheme 2 when δ = 1 .
5 Conclusion
We have studied how to improve the hub network temporal configurations of the airport by adjusting flight
schedules. We propose to refine the resolution of slot limits from every 60 to 15 min and add arrival and
departure specific slot limits to assist the flight schedule adjustment. A multiobjective optimization model is
proposed to maximize transfer opportunities of the airport and control the total schedule displacements.Flight schedule optimization model 945
Considering that rescheduling flight slots would interfere with airlines’ competitive environment, we also
put restrictions on maximal schedule displacement. The optimization model was applied for the flight
schedule at the Urumqi international airport. Based on the different number of arrival and departure flight
slots available for allocation, obtained from analyzing historical operational data and flight schedule
displacement limits acceptable to the airlines, different testing scenarios have been designed and corre-
sponding optimized flight schedules were obtained. The increase of the number of feasible flight connec-
tions and available flight connection seats, and the decrease in flight queuing delays for every testing
scenario were calculated. The results show that the proposed flight schedule adjustment, i.e., demand
management of flight schedules at a strategic level, can reduce the queuing delays for arrival and departure
flights to improve the airport’s operating efficiency and airport transfer opportunities at the same time
without reducing the number of flights and affecting the mission connection of the aircraft. We also
observed that for the Urumqi airport case, an increase of maximal schedule displacement did not lead to
a significant improvement in the performance metrics that we calculated. The proposed model can be easily
implemented in other hub airports as well. Our research provides a decision support tool so that airlines,
airports, and air navigation service providers can work collaboratively to adjust the schedule to improve the
competitiveness of hub airports.
Funding information: This research is supported by the National Natural Science Foundation for Young
Scientist of China under Grant 61603396.
Conflict of interest: The authors state no conflict of interest.
References
[1] Malighetti P, Paleari S, Redondi R. Connectivity of the European airport network: “self-help hubbing” and business
implications. J Air Transp Manag. 2008;14(2):53–65.
[2] Gillen D, Morrison WG. Regulation, competition and network evolution in aviation. J Air Transp Manag. 2005;11(3):161–74.
[3] Kotegawa T, Fry D, DeLaurentis D, Puchaty E. Impact of service network topology on air transportation efficiency. Transp
Res Part C Emerg Technol. 2014;40:231–50.
[4] Lordan O, Sallan JM, Simo P. Study of the topology and robustness of airline route networks from the complex network
approach: a survey and research agenda. J Transp Geogr. 2014;37:112–20.
[5] Lordan O, Sallan JM, Escorihuela N, Gonzalez-Prieto D. Robustness of airline route networks. Phys A Stat Mech Appl.
2016;445:18–26.
[6] Dennis N. Scheduling strategies for airline hub operations. J Air Transp Manag. 1994;13:131–44.
[7] Dennis N. Airline hub operations in Europe. J Transp Geogr. 1994;24:219–33.
[8] Dennis N. Developments of hubbing at European airports. Air Space Europe. 2001;3(1–2):51–5.
[9] Wit BJD. Temporal configurations of European airline networks. J Air Transp Manag. 2005;11(3):185–98.
[10] Burghouwt G, Veldhuis JG. The competitive position of hub airports in the transatlantic market. J Air Transp.
2006;11(1):106–30.
[11] Burghouwt G, Redondi R. Connectivity in air transport networks: an assessment of models and applications. J Transp Econ
Policy. 2013;47(1):35–53.
[12] Sopadang A, Suwanwong T. Airport connectivity evaluation: the study of Thailand. International Conference on Industrial
Engineering and Operations Management. Detroit, Michigan, USA: IEOM Society International; 2016. p. 188–95.
[13] Li W. A method to construct flight bank for hub airports. Nanjing: Nanjing University of Aeronautics and
Astronautics; 2010.
[14] Huang J, Wave-system JEWang. Structures of airport hubs and spatial patterns of possible indirect connections. Sci Geogr
Sin. 2018;38(11):1750–8.
[15] Wang W, Wang CJ. Temporal-spatial network of flight schedule in hub airport: a case study of Beijing International Airport.
ACTA Geogr Sin. 2013;68(6):762–74.
[16] Yang XSH, Qi L. Study on evaluation of the transfer level of hub airport. China Sci Pap. 2015;10(7):803–7.
[17] Swaroop P, Zou B, Ball MO, Hansen M. Do more U.S. airports need slot controls? A welfare based approach to determine
slot levels. Transp Res Part B. 2012;46(9):1239–59.946 Mei Tao et al.
[18] Churchill AM, Lovell DJ, Mukherjee A, Ball MO. Determining the number of airport arrival slots. Transp Sci.
2013;47(4):526–41.
[19] Pyrgiotis N, Odoni A. On the impact of scheduling limits: a case study at newark liberty international airport. Transp Sci.
2015;501:150–65.
[20] Doganis R, Dennis N. Lessons in hubbing. Airl Bus. 1989;3:42–7.
[21] Danesi A. Measuring airline hub timetable co-ordination and connectivity: definition of a new index and application to a
sample of European hubs. Eur Transp. 2006;34(5):54–74.
[22] Jacquillat A, Queuing A. Model of airport congestion and policy implications at JFK and EWR. Cambridge, MA:
Massachusetts Institute of Technology; 2012.You can also read