Firstsource Solutions - Looking beyond FY23 weakness Revert to 'double digit' revenue growth post FY23 - JMFL Research Portal
←
→
Page content transcription
If your browser does not render page correctly, please read the page content below

9 May 2022

 INDIA | IT SERVICES |
 COVERAGE INITIATION

                    Firstsource Solutions
                    Looking beyond FY23 weakness

Revert to 'double digit'
revenue growth post FY23

Emerging stronger
in the Healthcare business

Initiate with BUY
and TP of INR 165.
Implying 47% upside.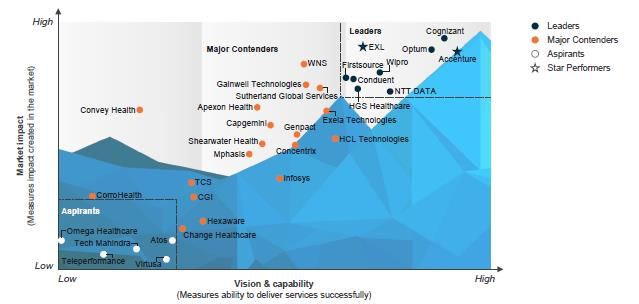
09 May 2022

INDIA | IT SERVICES
COVERAGE INITIATION

                           Table of Contents                                                         Page No.
                           Introduction                                                                  3
                           Focus Charts                                                                  4
                           Mortgage & Collections business                                               5
                           Healthcare business                                                           8
                           CMT business & BFS ex mortgage                                                11
                           New leadership                                                                13
                           Global peer comparison                                                        14
                           Case study: TaskUs                                                            16
                           Financial Analysis                                                            18
                           Valuation                                                                     19
                           Financial Tables                                                              20

                                                Firstsource (FSOL) is a part of the RP – Sanjiv Goenka group and is a
                                                leading provider of customized Business Process Management (BPM)
                                                services. Firstsource provides bespoke services and solutions to its
                                                customers across Banking and Financial Services, Healthcare,
                                                Communications, Media and Technology and other diverse industries. It
                                                operates 36 delivery centers across four geographies – US, UK,
                                                Philippines and India – to serve 100+ leading enterprises globally,
                                                including 17 Fortune 500 and 9 FTSE 100 companies.

   RECENT REPORTS

       Persistent Systems:         IT Services: Accenture  IT Services: BFS growing   Infosys: All eyes on the IT Services: The Global Lens
      Fortifying the growth      2QFY22: Solid for now but ahead of company yet              guidance                - Dec’21 quarter
           momentum               macro needs watching               again!

    JM Financial Institutional Securities Limited                                                                                 Page 2
09 May 2022

 INDIA | IT SERVICES |
 COVERAGE INITIATION

                                                             Firstsource Solutions
                                                     Looking beyond FY23 weakness
                                                                                          Mortgage weakness to keep overall growth in check even as other
   After seeing a 17.5% USD revenue CAGR over FY20-22,                                    segments do well: After recording a strong 17.5% USD revenue
                                                                                          CAGRR between FY20-22, Firstsource’s YoY revenue growth in FY23
   Firstsource will experience significant moderation in revenue
                                                                                          will be more modest due to the weakness in the Mortgage business
   growth in FY23 due to the sharp decline in the mortgage                                even as other segments continue to do well. Firstsource’s FY23
   business due to the higher interest rate cycle. However we like                        revenue growth outlook of 7-10% YoY cc growth captures the sharp
   Firstsource for the solid improvement and progress made on                             decline in Mortgage even as company is seeing steady growth in UK
                                                                                          BFS & Digital Collections. This will even pull down margins after a 120
   other segments of the portfolio (read: Healthcare, Diversification                     bps improvement on EBIT margins through FY20-22. We however
   beyond top client in the CMT vertical etc). This will help                             expect FSOL to revert to a ’double digit’ growth trajectory from FY24
   Firstsource to revert to a ‘double digit’ revenue growth                               onwards and forecast a 12% revenue CAGR over FY23E-25E.
   trajectory starting FY24 again.(note that company is guiding for                       Emerging stronger in the Healthcare business: Firstsource’s Healthcare
   a 18-22% YoY growth in FY23 ex Mortgage and acquisitions).                             business has grown by 28% YoY in FY22 aided by the strong organic
                                                                                          traction in the Payer segment. Company’s strong growth here has
                                                                                          been aided by revamped sales/solutioning team along with focus on
   A 44% correction over the past 6 months, makes valuations
                                                                                          new offerings like Digital Intake Platform which have helped in market
   attractive at
Firstsource Solutions                                                                                                            9 May 2022

Key Charts
  Exhibit 1. Mortgage revenue grew strongly during FY19-22 aided by        Exhibit 2. Payers now account for ~50% of revenue within the
  the macro cycle                                                          Healthcare segment

 Source: Company, JM Financial                                             Source: Company, JM Financial

  Exhibit 3. Healthcare revenue grew 28%+ YoY in FY22                      Exhibit 4. CMT revenue rose by 17% YoY in FY22 aided by growth
                                                                           beyond the top client

 Source: Company, JM Financial                                             Source: Company, JM Financial

  Exhibit 5. Firstsource is likely to return to ‘double digit’ growth in   Exhibit 6. EBIT margin likely to decline in FY23 after a 120 bps
  FY24 after seeing tepid growth in FY23                                   improvement over FY20-22

 Source: Company, JM Financial                                             Source: Company, JM Financial

JM Financial Institutional Securities Limited                                                                                        Page 4
Firstsource Solutions                                                                           9 May 2022

    Mortgage business to fall sharply and drag company wide growth in FY23

    The mortgage industry has benefited hugely from the low interest rate environment in
    the last couple of years. Interest rates globally were cut in the wake of the pandemic to
    give a boost to the economy. Consequently, mortgage loans saw a sharp uptick in the
    past two years. The mix between Home purchase finance and Refinance was 65%/35%
    in 2017; this reversed completely in 2020 during the pandemic to 37%/63% due to the
    favourable interest rate environment. The growth rates for both refinance and new home
    purchases have been at multi-year highs. FSOL reaped the benefits of this demand
    environment as it grew its mortgage business from USD 48mn in FY19 to USD 216mn in
    FY22, a CAGR of 64%.

Exhibit 7. Mortgage revenue grew strongly in FY19-22 aided by the macro cycle

Source: Company, JM Financial

Exhibit 8. Mortgage mix shifting in favour of servicing as originations slowdown

Source: Company, JM Financial

JM Financial Institutional Securities Limited                                                       Page 5
Firstsource Solutions                                                                             9 May 2022

     However, the tide is turning. In 2HCY21, central banks across the world started to
     gradually increase interest rates to counter inflation, which has reached record levels in
     many parts of the globe. As a result, mortgage outstanding is expected to go down,
     especially the refinance market; new home purchase financing still remains strong and is
     expected to grow. Consequently, the mix is changing again; in 2021, purchase increased
     to 41% and refinance was at 59%. Due to this, FSOL’s extraordinary growth in mortgage
     has started to taper off and the company is diversifying into newer areas in BFS to drive
     overall growth of its BFS segment (its largest segment). While the loan origination
     segment has been hit, the servicing segment remains strong for the company.

Exhibit 9. Refinancing volumes coming off after the sharp jump in CY20

Source: Mortgage Bankers Association

     The collections segment performed well in the past, growing ~17% CAGR in FY18-22,
     helped by the government stimulus programmes in the US. However, with lockdowns and
     contraction in discretionary spends, the card industry witnessed a decline in spending,
     charge-off rates, and credit card delinquencies, all of which impacted industry volume
     and, resultantly, the company’s business as well. Delinquencies and charge-off rates have
     fallen to record low levels. However, as vaccinations lead to a gradual return to normalcy
     in most countries, a revival of discretionary activities is expected to drive credit card
     spends back to pre-pandemic levels. Consequently, as spending increases, delinquencies
     are also expected to rise; thus, a recovery is expected in this segment. Latest data from
     the New York Fed suggest that credit card spends are picking up already with credit card
     balance increasing by USD 52bn in 4QCY21, which was the largest quarterly increase
     ever. Still, data show the balance is USD 71bn below pre-pandemic levels.

JM Financial Institutional Securities Limited                                                         Page 6
Firstsource Solutions                                                                             9 May 2022

Exhibit 10. Collections revenue expected to pick up as delinquencies start to increase

Source: Company, JM Financial

    Additionally, Firstsource has made an acquisition in this space – a company called
    American Recovery Inc. or ARSI, a leading player in the legal network collections market.
    This will help Firstsource build its capabilities in the debt collection industry in legal
    collections, where the company has limited expertise. The number of debt collection cases
    is rising rapidly in the US and has grown by 55% in the last five years (under Texas
    Supreme Court jurisdiction). With interest rates increasing, the cost of servicing the debt
    goes up and so does the probability of default. This acquisition will help FSOL leverage
    that opportunity.

    Also, the company has worked hard to expand its capabilities to the FinTech market,
    especially in the Buy Now Pay Later (BNPL) segment. This segment is amongst the fastest
    growing ones and potentially another attractive market opportunity. The company is
    recording healthy wins in the fintech space every quarter.

Exhibit 11. Firstsource has seen broad-based client additions in recent quarters
Client additions                                BFS        Healthcare              CMT

4QFY22                                          8              6                    2

3QFY22                                          5              1                    3

2QFY22                                          5              5                    3

1QFY22                                          9              5                    2

4QFY21                                          4              3                    4

3QFY21                                          10             5                    3

2QFY21                                          11             4                     -

1QFY21                                          6              4                    1
Source: Company, JM Financial

JM Financial Institutional Securities Limited                                                         Page 7
Firstsource Solutions                                                                              9 May 2022

    Healthcare business faring well and should gather pace

    Firstsource is amongst the few BPM providers that caters to both the Provider and the
                                                                               nd
    Payer segments in the Healthcare industry. The Healthcare vertical is the 2 largest vertical
    for the company. The Payer segment includes the Health Insurance companies and Health
    Plans while the Provider segment represents the Hospitals and the Medical Equipment
    Manufacturers. Firstsource works with six of the top 10 Health plans and over 1,000+
    hospitals in the US. The Provider segment has accounted for a majority share of
    Firstsource’s revenue from the Healthcare vertical due to legacy reasons. However, under
    the current leadership, this is changing.

Exhibit 12. Firstsource has comprehensive offerings across the Healthcare space

Source: Company, JM Financial

    Firstsource’s Healthcare revenue rose by 28% YoY in FY22 after declining by ~4% YoY in
    FY21. This strong performance has been aided by solid growth in the Payer / Health Plan
    segment even as the Provider segment has continued to suffer due to the delay in
    elective procedures. We note that the Payer segment has grown by 30%+ over FY20-
    22E. The Healthcare Payer segment is expected to account for >50% of the Healthcare
    business in FY22 (vs. ~36% in FY20).

JM Financial Institutional Securities Limited                                                          Page 8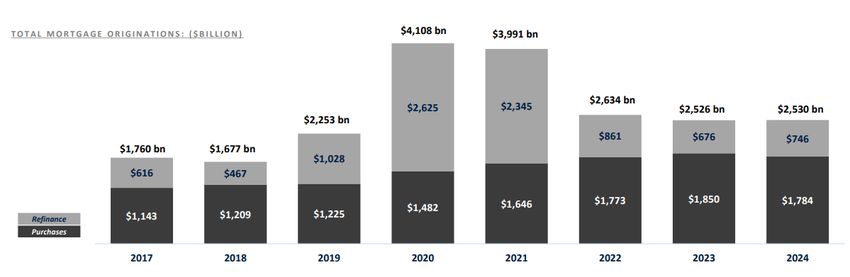
Firstsource Solutions                                                                                9 May 2022

Exhibit 13. Healthcare revenue grew 28%+ YoY in FY22

Source: Company, JM Financial

Exhibit 14. Payers now account for ~50% of revenue within the Healthcare segment

Source: Company, JM Financial

    Firstsource’s performance in the Healthcare vertical has been helped by a number of
    initiatives taken under the current CEO after he took over in Sep’19. These include
    bifurcating the Healthcare business into the Provider and the Payer (Health Plan and
    Healthcare services). The company has also rebooted its organisational structure by hiring
    external talent across sales, solutioning, tech and delivery. In addition, it has laid special
    emphasis on creating platform solutions to address client needs. In this regard, Sympraxis,
    which is a digital intake platform for member engagement, care management and risk
    and compliance has helped Firstsource secure a large USD 22mn, 5-year deal at new top
    5 Health Plan customers. Besides, the depth of the client relationships that the new
    leadership in the segment brought has helped revitalize growth both from new clients
    and existing clients. We have seen Firstsource also win a large USD 100mn+ TCV deal in
    the BPaaS segment against Tier I IT Services players.

JM Financial Institutional Securities Limited                                                            Page 9
Firstsource Solutions 9 May 2022
Firstsource is differentiating itself by creating digital channels and focusing on a ‘Digital
First, Digital now’ approach rather than an FTE-based model. The company has a
dedicated automation CoE and provides end-to-end automation services and digitisation
across functional areas. Firstsource’s investments and success in the segment have been
acknowledged by industry leaders with the company recognised amongst the ‘Leaders’ in
Everest Group’s Healthcare Payers PEAK Matric Assessment 2022 study.
Exhibit 15. Firstsource’s recent successes in the Healthcare Payer space is being recognised by
industry analysts
Source: Everest Group
Exhibit 16. Everest research suggests both significant success in clients serviced as well as FTE
growth in the Payer segment
Source: Everest Group; 1- 12months ending June 30 of any particular year
Even as the Healthcare Payer business does well on the back of new customer
acquisitions, the Healthcare Provider business is likely to recover as the Covid-led impact
over the past 24 months on elective treatments wanes. We note that the company has
further strengthened its offerings on the Healthcare Provider side through acquisitions
such as PatientMatters. This acquisition provides Patient Advocacy Services and a front-
end RCM SaaS platform to cater to the Patient Responsibility and Self Pay segment. It also
provides strength in large markets such as Texas and New York. The company has
continued to win new clients in the segment through the last 18 months. The Provider
business should rebound both on the back of recovery in elective procedures as well as
the expansion in new customers.
JM Financial Institutional Securities Limited Page 10Firstsource Solutions 9 May 2022
Diversifying beyond the top client in the CMT vertical
Historically, FSOL’s business in the CMT vertical has been centered on its top client. Given
the market share that FSOL enjoys at the top client, there is limited room to expand
business further as far as this client is concerned. Under the current leadership, FSOL has
been trying to diversify the business by going after new logo wins both in North America
and UK. The company has been doubling down on the Streaming market and expanding
its footprint in the US market with a focus on Media and tech industries.
Although growth has been on a low base, this business has grown strongly through FY21
and FY22. We note that CMT revenue (ex-Sky) grew by 50% YoY and 56.3% YoY in
FY21 and FY22 respectively. We continue to expect this to be a significant driver of
growth within the CMT vertical as the company continues to open new logos and scale
its business beyond the top client. We highlight that the company has continued to win
new logos in the CMT segment in recent quarters, lending confidence on its growth
diversification in this vertical.
Exhibit 17. CMT revenue rose by 27% YoY in FY22 aided by growth beyond the top client
Source: Company, JM Financial
Financial services ex-mortgage still growing at a steady clip
BFSI is the largest vertical for Firstsource and accounted for 52%/49.5% of its revenue in
FY21/22. Firstsource works with three of the top 6 UK retail banks, four of the top 10
mortgage service providers and four of the top 10 lenders in the US market. It focuses on
several segments in BFS, including:
(1) retail banking (customer experience, transaction processing),
(2) mortgages (loan processing, servicing, title and valuations),
(3) complaints and remediation (complaints handling, fraud management),
(4) collections and recoveries (credit card collections, auto and student loan collections)
and
(5) commercial finance (invoice factoring, risk management).
JM Financial Institutional Securities Limited Page 11Firstsource Solutions 9 May 2022
Exhibit 18. Firstsource’s key offerings in the Financial Services space
Source: Company, JM Financial
FSOL’s revenue in the financial services vertical grew by 51%+ YoY in c/c terms in FY21.
While this stupendous growth in the financial services vertical during FY21 was aided by
the cyclical upswing in the mortgage business, the company has continued to see a
steady growth through the period in the BFSI portfolio outside of Mortgage as well. We
note that the financial services ex-mortgage revenue grew by 12% CAGR in USD terms
over FY20-22. The company is staying focused on chasing adjacent areas of growth
within the financial services vertical rather than going after any new segments. In this
regard, it is working closely with fintechs and helping them design operations and
participate in their growth journey. Firstsource has partnered with five fintechs during the
last two quarters.
Exhibit 19. BFSI revenue (ex-mortgage) have grown by 12% over FY20-22
Source: Company, JM Financial
JM Financial Institutional Securities Limited Page 12Firstsource Solutions 9 May 2022
New leadership leading the charge
The leadership team of Firstsource has been revamped significantly after the current CEO
Mr Vipul Khanna took over in Sep’19. Vipul is himself a BPO veteran, having had prior
stints at Fidelity and UBS Global Services, and he has played a pivotal role in scaling up
Cognizant’s BPO business during his decade long stint at the company.
The key hires for Firstsource include Venkatgiri Vandali (joined in Feb’20, industry veteran
with prior stints at Cognizant, Infosys and GE), Prashant Nandella (joined in Jul’20; prior
stints with Cognizant, UBS, DE Shaw and HP), Sundara Sukavanam (joined in Feb’20;
another industry veteran having worked at CTSH and Wipro), and Deb Biswas (joined in
Feb'2021 Prior stints with Genpact, Linedata & HCLT).
Exhibit 20. Firstsource’s senior leaderships has been reinforced in recent years
Name Designation Background
Vipul joins Firstsource from Cognizant Digital Operations where he led a start-up practice into a $2bn, top-5 global BPO
Vipul Khanna MD and CEO business. Prior to Cognizant, he was the CEO of UBS’s Internal Service Company. Vipul is a Chartered Accountant, and a
Cost and Management Accountant
Prashant joined FSOL in Jul'20. A BPO industry veteran, Prashant has had stints at HP, DE Shaw, UBS and CTSH. In his last
role at CTSH, Prashant was the Global Delivery Head, Digital Operations for Retail & Consumer goods, Travel &
Prashant Nandella COO
hospitality, Manufacturing & logistics and Energy & Utility operations in additional to Banking & Financial Services and
Hyderabad Location Head roles
Dinesh Jain is the Chief Financial Officer at Firstsource, and has been with the business from its inception. A commerce
Dinesh Jain President and CFO graduate from Jodhpur University, India, Dinesh is also a chartered accountant from the ICAI, India and a cost accountant
from the ICWAI, India
Venkatgiri Vandali Head- Healthcare & Life sciences Joined FSOL in Feb'20. Prior stint with CTSH where he was VP and Head, Healthcare BPAAS
Randal. Shafer EVP and Head- Hospitals Business A FSOL veteran who joined the company through the MedAssist acquisition. Promoted to the current role in Dec'20
An old timer at FSOL (been with the company since 2002), Arjun has been leading the Collections business for
Arjun Mitra President-Collections
Firstsource since 2016
Steve Schachter Head-Mortgage Came in through the ISGN acquisition in 2016. Promoted to the Head of Mortgage business in Oct'20
Sundara joined FSOL in Feb'20 as the CDO. Sundara is an industry veteran having worked at CTSH and Wipro. In his last
Sundara Sukavanam Chief Digital Officer
assignment at CTSH, Sundara was VP, Intelligent Automation and Tech
Joined FSOL as CHRO in Feb'2021. Prior stints with Stanchart bank as Global Head- People Capability -Delivery and HDFC
Shuchika Sahay Chief Human Resources Officer
Standard Life Insurance
Raji joined from Attune Technologies where she was the global head of marketing. She started her career with Procter &
Rajlakshmi Raghavan Head-Marketing & Communications Gamble and has been associated with McCann Erickson, Eventus India, Ajuba Solutions, Region Holdings and
TalentSprint. Raji is an INSEAD alumnus and has a post graduate degree in Mass Communication and Journalism
Source: Company, JM Financial
Firstsource’s CEO was granted options totaling 10.06mn shares (1.4% of the equity)
through a mix of tenure- and performance-based options. The performance-linked
options account for ~81% of the total options and are linked to achievement of certain
levels of PBT and will vest in 2HFY24.
Exhibit 21. Performance-linked options account for 81% of the total options for the CEO
Grants under Tenure Based Structure
No. of Stock Options Vesting Date Vesting Conditions
11,86,624 01-Oct-21 Continued employment
7,19,966 01-Oct-23 Continued employment
Grants under Performance Based Structure
No. of Stock Options Vesting Date Vesting Conditions
81,59,614 01-Oct-23 Achievement of Profits Before Tax **
Source: Company, JM Financial, ** Performance period may be further defined in consultation with the Nomination & Remuneration
Committee
The leadership refresh and the renewed focus on addressing inherent issues are
beginning to bear fruit in terms of improved traction in the Healthcare Payer business, as
detailed above, as well as the new logo additions across both Financial Services and CMT
verticals as the company tries to diversify the business beyond the top client.
JM Financial Institutional Securities Limited Page 13Firstsource Solutions 9 May 2022
On course for steady growth beyond the mortgage-led weakness in FY23
Firstsource has seen 17.5% USD revenue CAGR over FY20-22 albeit helped significantly
by the cyclical upswing in the mortgage business. It has also seen success in growing the
Healthcare Payer business, which is likely to account for a majority of the revenue from
the Healthcare vertical for the 1st time in its history. In addition, the company is seeing
traction with new clients, which will help drive diversification in the CMT vertical. The
Healthcare Provider business has struggled through FY20-22 due to the Covid-led impact
on elective surgeries but is likely to see a rebound from FY23 onwards.
However, the company will likely face significant pressure in mortgage origination and
refinance volumes as interest rates move up, which is likely to be a significant headwind
to overall revenue growth and will keep overall revenue growth in single digits in FY23
even as other segments of the portfolio do well. We see FSOL returning to ‘double digit’
YoY revenue growth trajectory beyond FY23 and bake in 12% USD revenue CAGR during
FY23E-25E.
Exhibit 22. Firstsource is likely to return to ‘double digit’ growth from FY24 after seeing tepid
growth in FY23
Source: Company, JM Financial
Global BPM companies seeing increase in demand as industries embrace digital
The Covid-19 crisis has not only accelerated the adoption of digital across industries, it is
also boosting demand for digital customer experience management. With the growth
seen in the digital natives (e.g., Fintech, Food Delivery, Cab Delivery, etc.) and the
significant increase in online sales across industries, the businesses need to invest
significantly in providing the right customer experience. This is all the more important as
the digital native client base expands, because the customer experience for this set of
clients is a critical customer retention and growth lever rather than just a cost centre.
Further, the increased adoption of remote working driven by the pandemic has resulted in
greater client confidence on a less structured work environment, resulting in more
outsourcing opportunities. Further, the tight talent market conditions due to the low US
unemployment are also resulting in greater outsourcing demand for BPM players.
We note that the commentary from pure play BPM players such as EXL Services (EXLS US,
Unrated) and WNS Services (WNS US, Unrated) suggests a few aspects - larger deal sizes,
shorter decision making, and robust new client additions. These companies confirm that
they are seeing larger contracts, faster decision making (‘sales cycle which was typically
12-18 months has reduced to ~6 months even for Digital Operations’). In addition, they
confirm the increased business traction , resulting in higher net new client additions. EXL
also updated its medium-term aspirations recently: (1) The company now expects 7-9%
JM Financial Institutional Securities Limited Page 14Firstsource Solutions 9 May 2022
YoY growth (vs. 6-8% earlier) in Digital Operations and 15-20% YoY growth in the
Analytics business (vs. 13-15% earlier), translating into a medium-term overall growth
trajectory of 11-13% YoY (vs. 10%+ p.a.). EXL Services also expects earnings growth to
outpace revenue growth over the medium term.
Exhibit 23. Commentary from Global BPM peers quite encouraging in recent times
Company Name Quarter Comments
We're seeing large contracts not only in our data analytics business, but also in our digital operations and digital solutions business, and that's
because clients are engaging with us much more holistically. And in the past, the sales cycle might have typically been a 12 to 18 month sales
EXL Services 1QCY22
cycle for a digital operations deal. So frankly, larger contracts, faster decision making, many more services that we can provide to our clients and
it's a very demand-rich target environment right now. Today, it's about six months in terms of that speed.
Have updated our medium-term growth target for Digital Operations to 7-9% YoY growth (vs. 6-8% earlier) and Analytics to 15-20% YoY
Exl Services 4QCY21
growth( vs. 13-15% earlier) thereby increasing our overall growth outlook to 11-13% (vs. 10%+ earlier)
Today, we continue to see increased demand for BPM solutions as clients look to leverage technology and automation to help transform their
WNS Services 4QFY22
business models as well as achieve their strategic goals.
Pipeline is robust in terms of size and broadness across multiple verticals. Seeing many more larger deals flowing into the pipeline , some of
WNS Services 3QFY22 which may end up being amongst the top 10 very quickly. We are seeing the ability to add additional processes improve. Taking lesser time than
it used to.
Source: Company, JM Financial
Exhibit 24. BPM peers also seeing strong client additions in recent times
New clients Added CY19 CY20 CY21
WNS 29 33 36
EXL Services 28 45 58
Task Us 27 36 41
Source: Company, JM Financial
This is also amply reflected in the revenue growth upgrade cycle enjoyed by the above-
mentioned companies over the past 12 months. Exhibit 24 and 25 below highlights how
the Street has been upgrading revenue growth assumptions. We note that EXL recently
upgraded its CY22 revenue growth outlook to 17-19% USD revenue growth (vs. 14-17%
YoY USD revenue growth earlier).
Exhibit 25. WNS: Change in EPS and revenue estimates for FY23 and FY24
Source: Bloomberg
JM Financial Institutional Securities Limited Page 15Firstsource Solutions 9 May 2022
Exhibit 26. EXL Services: Change in EPS and revenue estimates for FY23 and FY24
Source: Bloomberg
Case study: TaskUs, the high-growth leader in the Digital Customer experience space
TaskUS (TASK US, Unrated) is a new age Digital Customer experience company focused
on serving high-growth technology companies. The company has a global, omni-channel
delivery model and prides itself as a ‘Digitally Native’ Outsourcer that was ‘born on the
web and grew up in the cloud’. It is adept at executing work in digital channels such as
chat, native in-app messaging, SMS and social channels and suggests that 95% of the
revenue was delivered from non-voice digital channels. The company believes that its
agility and the ability to get the job done quickly is reflected in the fact that the average
time between the signing of a new client and starting work with the client was 14 days in
2021 (as compared to running into months for the older CX firms).
TaskUS has seen strong revenue growth trajectory in recent years and has grown by
~60% CAGR over CY17-CY21 with revenue of USD 760mn in CY21. While TaskUS has
been saying that it is confident of sustaining 25% YoY growth over the medium term,
the company’s CY22 revenue guidance of USD 980mn-USD 1bn implies 30.1% YoY
growth at the mid-point of the guidance. As of CY21-end, the company served over 100
clients spanning numerous industry segments within the Digital Economy including e-
Commerce, Fintech, Food delivery and ride sharing, Gaming, HiTech, HealthTech, Social
Media and Streaming Media. The top 10 clients accounted for 62% of revenue in CY21
with the top 2 clients Facebook/Meta and Doordash accounting for 27% and 11% of
revenue respectively in CY21.
JM Financial Institutional Securities Limited Page 16Firstsource Solutions 9 May 2022 Exhibit 27. TaskUS has seen revenue grow by ~60% CAGR over CY17-21 Source: Company, JM Financial JM Financial Institutional Securities Limited Page 17
Firstsource Solutions 9 May 2022
Financial Analysis
Strong revenue growth: Revenue grew at a CAGR of 13.8% from FY18-22 aided by
strong demand in the mortgage business. Going forward, we expect the mortgage
business to slow down, which will be offset by growth in other segments, primarily
healthcare. Hence, we build in revenue CAGR of 9.7% over FY22-25E.
EBIT margins to improve steadily: EBIT margin is steadily increasing although we expect
margins to take a hit in FY23 on account of subdued revenue growth and the drag from
mortgage ramp-downs due to timing delays between revenue rundown and headcount
/cost rationalisation. We, however, expect margins to improve over FY23E-25E
Exhibit 28. We forecast 9.7% revenue CAGR over FY22-25E Exhibit 29. EBIT margin likely to decline in FY23 after a 120 bps
improvement over FY20-22
Source: Company, JM Financial Source: Company, JM Financial
Strong PAT growth: PAT margin is expected to increase by ~280bps to 9.9% in FY25
from ~7% in FY21. Absolute PAT is likely to grow by ~21% CAGR during FY21-25E
aided by growth in EBIT and benefits of financial leverage.
Strong free cash flows: Cash flow conversion has been improving steadily. CFO/EBITDA
improved from c.69% in FY18 to c.73.3% in FY22.
Dividend payout trends: The company has also been increasing its payout ratio over the
years. It paid out 44% as dividend in FY22 compared to 53% in FY21; the payout ratio
was 38% in FY18.
Exhibit 30. Profit margin likely to improve over FY23E-25E Exhibit 31. Cash generation has been quite robust for FSOL
Source: Company, JM Financial Source: Company, JM Financial
JM Financial Institutional Securities Limited Page 18Firstsource Solutions 9 May 2022 Valuation Valuations cheap after the recent correction: FSOL has corrected by ~44 % over the past 6 months due to the likely hit in the mortgage business because of higher interest rates. While the drag from the mortgage business will limit overall revenue growth to single digits in FY23, we see Firstsource returning to ‘double digit’ growth from FY24 aided by strong growth in the Healthcare business and greater diversification in the CMT vertical. We look beyond the FY23 weakness and find valuations attractive at
Firstsource Solutions                                                                                                                               9 May 2022

 Financial Tables (Consolidated)
  Income Statement                                                      (INR mn)        Balance Sheet                                                      (INR mn)
  Y/E March                      FY21A      FY22A     FY23E     FY24E       FY25E       Y/E March                      FY21A    FY22A    FY23E    FY24E       FY25E
  Net Sales                     50,780     59,212    62,196    69,435       78,146      Shareholders’ Fund             27,993   30,329   32,528   35,863      40,207
  Sales Growth                   23.9%     16.6%      5.0%     11.6%        12.5%         Share Capital                 6,961    6,970    6,970    6,970       6,970
  Other Operating Income             0          0         0         0              0      Reserves & Surplus           21,032   23,360   25,558   28,893      33,237
  Total Revenue                 50,780     59,212    62,196    69,435       78,146      Preference Share Capital           0        0        0        0           0
  Cost of Goods Sold/Op. Exp    34,672     39,468    40,498    44,546       49,903      Minority Interest                  5        4        4        4           4
  Personnel Cost                     0          0         0         0              0    Total Loans                     5,213   10,097    9,997    9,897       9,797
  Other Expenses                  8,117    10,145    12,059    13,294       14,848      Def. Tax Liab. / Assets (-)    -3,044   -1,859   -1,859   -1,859      -1,859
  EBITDA                          7,990     9,599     9,639    11,595       13,395      Total - Equity & Liab.         30,167   38,571   40,669   43,905      48,148
  EBITDA Margin                  15.7%     16.2%     15.5%     16.7%        17.1%       Net Fixed Assets               29,976   37,466   37,047   37,003      36,960
  EBITDA Growth                  27.1%     20.1%      0.4%     20.3%        15.5%         Gross Fixed Assets           17,482   20,482   22,882   25,782      28,882
  Depn. & Amort.                  2,064     2,494     2,819     2,944        3,143        Intangible Assets            21,948   27,208   27,208   27,208      27,208
  EBIT                            5,927     7,105     6,821     8,651       10,252        Less: Depn. & Amort.          9,454   10,225   13,043   15,987      19,131
  Other Income                      13          6        63        57         121         Capital WIP                      0        0        0        0           0
  Finance Cost                     522        639       808       808         808       Investments                      943     1,300    1,300    1,300       1,300
  PBT before Excep. & Forex       5,417     6,471     6,075     7,899        9,565      Current Assets                 13,864   15,503   18,510   23,674      30,228
  Excep. & Forex Inc./Loss(-)        0          0         0         0              0      Inventories                      0        0        0        0           0
  PBT                             5,417     6,471     6,075     7,899        9,565        Sundry Debtors                5,767    6,446    7,668    8,560       9,634
  Taxes                            702      1,106     1,154     1,501        1,817        Cash & Bank Balances          1,373     898     1,641    4,841       9,275
  Extraordinary Inc./Loss(-)     -1,099         0         0         0              0      Loans & Advances              4,060    5,000    6,134    6,848       7,465
  Assoc. Profit/Min. Int.(-)         0          -8        0         0              0     Other Current Assets           2,664    3,159    3,067    3,424       3,854
  Reported Net Profit             3,617     5,374     4,921     6,399        7,747      Current Liab. & Prov.          14,616   15,698   16,188   18,072      20,339
  Adjusted Net Profit             4,716     5,374     4,921     6,399        7,747        Current Liabilities              0        0        0        0           0
  Net Margin                      9.3%      9.1%      7.9%      9.2%         9.9%         Provisions & Others          14,616   15,698   16,188   18,072      20,339
  Diluted Share Cap. (mn)         707.2     705.5     705.5     705.5        705.5      Net Current Assets               -752     -195    2,322    5,602       9,889
  Diluted EPS (INR)                 6.7        7.6      7.0       9.1         11.0      Total – Assets                 30,167   38,571   40,669   43,905      48,148
  Diluted EPS Growth             37.2%     14.2%      -8.4%    30.0%        21.1%      Source: Company, JM Financial
  Total Dividend + Tax           1,928      2,382     2,723     3,063        3,404
  Dividend Per Share (INR)          2.9        3.5       4.0      4.5          5.0
Source: Company, JM Financial

 Cash Flow Statement                                                    (INR mn)
                                                                                        Dupont Analysis
 Y/E March                      FY21A      FY22A     FY23E     FY24E       FY25E
                                                                                        Y/E March                      FY21A    FY22A    FY23E    FY24E       FY25E
 Profit before Tax               5,417     6,471     6,075     7,899        9,565
                                                                                        Net Margin                      9.3%     9.1%     7.9%     9.2%        9.9%
 Depn. & Amort.                  2,064     2,494     2,819     2,944        3,143
                                                                                        Asset Turnover (x)                1.4      1.6      1.5      1.5         1.6
 Net Interest Exp. / Inc. (-)   -1,111         -6      -63       -57         -121
                                                                                        Leverage Factor (x)               1.3      1.3      1.4      1.3         1.3
 Inc (-) / Dec in WCap.          4,856     -1,032    -1,775      -79         147
 Others                             0           0        0         0            0       RoE                            16.9%    18.4%    15.7%    18.7%       20.4%

 Taxes Paid                     -1,186        80     -1,154    -1,501      -1,817
 Operating Cash Flow            10,039     8,007     5,903     9,207       10,917       Key Ratios
 Capex                          -3,331     -9,984    -2,400    -2,900      -3,100       Y/E March                      FY21A    FY22A    FY23E    FY24E       FY25E
 Free Cash Flow                  6,709     -1,977    3,503     6,307        7,817       BV/Share (INR)                   41.4     44.6     47.8     52.7        59.1
 Inc (-) / Dec in Investments     -821      -357         0         0            0       ROIC                           15.9%    17.0%    14.2%    17.7%       21.0%
 Others                            13           6       63        57         121        ROE                            16.9%    18.4%    15.7%    18.7%       20.4%
 Investing Cash Flow            -4,139    -10,335    -2,337    -2,843      -2,979       Net Debt/Equity (x)               0.1      0.3      0.2      0.1         0.0
 Inc / Dec (-) in Capital         339      2,337     2,198     3,335        4,344       P/E (x)                          16.8     14.7     16.1     12.3        10.2
 Dividend + Tax thereon         -3,617     -5,374    -4,921    -6,399      -7,747       P/B (x)                           2.7      2.5      2.3      2.1         1.9
 Inc / Dec (-) in Loans         -3,157     4,884      -100      -100         -100       EV/EBITDA (x)                    10.0      8.8      8.7      7.0         5.7
 Others                             0           7        0         0            0       EV/Sales (x)                      1.6      1.4      1.4      1.2         1.0
 Financing Cash Flow            -6,435     1,854     -2,823    -3,163      -3,504       Debtor days                        41       40      45       45          45
 Inc / Dec (-) in Cash            -534      -475       742     3,200        4,434       Inventory days                      0        0        0       0           0
 Opening Cash Balance            1,907     1,373       898     1,641        4,841       Creditor days                       0        0        0       0           0
 Closing Cash Balance            1,373       898     1,641     4,841        9,275      Source: Company, JM Financial
Source: Company, JM Financial

JM Financial Institutional Securities Limited                                                                                                              Page 20
Firstsource Solutions 9 May 2022
APPENDIX I
JM Financial Inst itut ional Secur ities Lim ited
Corporate Identity Number: U67100MH2017PLC296081
Member of BSE Ltd., National Stock Exchange of India Ltd. and Metropolitan Stock Exchange of India Ltd.
SEBI Registration Nos.: Stock Broker - INZ000163434, Research Analyst – INH000000610
Registered Office: 7th Floor, Cnergy, Appasaheb Marathe Marg, Prabhadevi, Mumbai 400 025, India.
Board: +9122 6630 3030 | Fax: +91 22 6630 3488 | Email: jmfinancial.research@jmfl.com | www.jmfl.com
Compliance Officer: Mr. Sunny Shah | Tel: +91 22 6630 3383 | Email: sunny.shah@jmfl.com
Definition of ratings
Rating Meaning
Buy Total expected returns of more than 10% for large-cap stocks* and REITs and more than 15% for all other stocks, over the next twelve
months. Total expected return includes dividend yields.
Hold Price expected to move in the range of 10% downside to 10% upside from the current market price for large-cap* stocks and REITs and
in the range of 10% downside to 15% upside from the current market price for all other stocks, over the next twelve months.
Sell Price expected to move downwards by more than 10% from the current market price over the next twelve months.
* Large-cap stocks refer to securities with market capitalisation in excess of INR200bn. REIT refers to Real Estate Investment Trusts.
Research Analyst(s) Certification
The Research Analyst(s), with respect to each issuer and its securities covered by them in this research report, certify that:
All of the views expressed in this research report accurately reflect his or her or their personal views about all of the issuers and their securities; and
No part of his or her or their compensation was, is, or will be directly or indirectly related to the specific recommendations or views expressed in this research
report.
Important Disclosures
This research report has been prepared by JM Financial Institutional Securities Limited (JM Financial Institutional Securities) to provide information about the
company(ies) and sector(s), if any, covered in the report and may be distributed by it and/or its associates solely for the purpose of information of the select
recipient of this report. This report and/or any part thereof, may not be duplicated in any form and/or reproduced or redistributed without the prior written
consent of JM Financial Institutional Securities. This report has been prepared independent of the companies covered herein.
JM Financial Institutional Securities is registered with the Securities and Exchange Board of India (SEBI) as a Research Analyst and a Stock Broker having trading
memberships of the BSE Ltd. (BSE), National Stock Exchange of India Ltd. (NSE) and Metropolitan Stock Exchange of India Ltd. (MSEI). No material disciplinary
action has been taken by SEBI against JM Financial Institutional Securities in the past two financial years which may impact the investment decision making of the
investor.
JM Financial Institutional Securities renders stock broking services primarily to institutional investors and provides the research services to its institutional
clients/investors. JM Financial Institutional Securities and its associates are part of a multi-service, integrated investment banking, investment management,
brokerage and financing group. JM Financial Institutional Securities and/or its associates might have provided or may provide services in respect of managing
offerings of securities, corporate finance, investment banking, mergers & acquisitions, broking, financing or any other advisory services to the company(ies)
covered herein. JM Financial Institutional Securities and/or its associates might have received during the past twelve months or may receive compensation from
the company(ies) mentioned in this report for rendering any of the above services.
JM Financial Institutional Securities and/or its associates, their directors and employees may; (a) from time to time, have a long or short position in, and buy or sell
the securities of the company(ies) mentioned herein or (b) be engaged in any other transaction involving such securities and earn brokerage or other
compensation or act as a market maker in the financial instruments of the company(ies) covered under this report or (c) act as an advisor or lender/borrower to,
or may have any financial interest in, such company(ies) or (d) considering the nature of business/activities that JM Financial Institutional Securities is engaged in,
it may have potential conflict of interest at the time of publication of this report on the subject company(ies).
Neither JM Financial Institutional Securities nor its associates or the Research Analyst(s) named in this report or his/her relatives individually own one per cent or
more securities of the company(ies) covered under this report, at the relevant date as specified in the SEBI (Research Analysts) Regulations, 2014.
The Research Analyst(s) principally responsible for the preparation of this research report and members of their household are prohibited from buying or selling
debt or equity securities, including but not limited to any option, right, warrant, future, long or short position issued by company(ies) covered under this report.
The Research Analyst(s) principally responsible for the preparation of this research report or their relatives (as defined under SEBI (Research Analysts) Regulations,
2014); (a) do not have any financial interest in the company(ies) covered under this report or (b) did not receive any compensation from the company(ies) covered
under this report, or from any third party, in connection with this report or (c) do not have any other material conflict of interest at the time of publication of this
report. Research Analyst(s) are not serving as an officer, director or employee of the company(ies) covered under this report.
While reasonable care has been taken in the preparation of this report, it does not purport to be a complete description of the securities, markets or
developments referred to herein, and JM Financial Institutional Securities does not warrant its accuracy or completeness. JM Financial Institutional Securities may
not be in any way responsible for any loss or damage that may arise to any person from any inadvertent error in the information contained in this report. This
report is provided for information only and is not an investment advice and must not alone be taken as the basis for an investment decision.
JM Financial Institutional Securities Limited Page 22Firstsource Solutions 9 May 2022
The investment discussed or views expressed or recommendations/opinions given herein may not be suitable for all investors. The user assumes the entire risk of
any use made of this information. The information contained herein may be changed without notice and JM Financial Institutional Securities reserves the right to
make modifications and alterations to this statement as they may deem fit from time to time.
This report is neither an offer nor solicitation of an offer to buy and/or sell any securities mentioned herein and/or not an official confirmation of any transaction.
This report is not directed or intended for distribution to, or use by any person or entity who is a citizen or resident of or located in any locality, state, country or
other jurisdiction, where such distribution, publication, availability or use would be contrary to law, regulation or which would subject JM Financial Institutional
Securities and/or its affiliated company(ies) to any registration or licensing requirement within such jurisdiction. The securities described herein may or may not be
eligible for sale in all jurisdictions or to a certain category of investors. Persons in whose possession this report may come, are required to inform themselves of
and to observe such restrictions.
Persons who receive this report from JM Financial Singapore Pte Ltd may contact Mr. Ruchir Jhunjhunwala (ruchir.jhunjhunwala@jmfl.com) on +65 6422 1888 in
respect of any matters arising from, or in connection with, this report.
Additional disclosure only for U.S. persons: JM Financial Institutional Securities has entered into an agreement with JM Financial Securities, Inc. ("JM Financial
Securities"), a U.S. registered broker-dealer and member of the Financial Industry Regulatory Authority ("FINRA") in order to conduct certain business in the
United States in reliance on the exemption from U.S. broker-dealer registration provided by Rule 15a-6, promulgated under the U.S. Securities Exchange Act of
1934 (the "Exchange Act"), as amended, and as interpreted by the staff of the U.S. Securities and Exchange Commission ("SEC") (together "Rule 15a-6").
This research report is distributed in the United States by JM Financial Securities in compliance with Rule 15a-6, and as a "third party research report" for
purposes of FINRA Rule 2241. In compliance with Rule 15a-6(a)(3) this research report is distributed only to "major U.S. institutional investors" as defined in Rule
15a-6 and is not intended for use by any person or entity that is not a major U.S. institutional investor. If you have received a copy of this research report and are
not a major U.S. institutional investor, you are instructed not to read, rely on, or reproduce the contents hereof, and to destroy this research or return it to JM
Financial Institutional Securities or to JM Financial Securities.
This research report is a product of JM Financial Institutional Securities, which is the employer of the research analyst(s) solely responsible for its content. The
research analyst(s) preparing this research report is/are resident outside the United States and are not associated persons or employees of any U.S. registered
broker-dealer. Therefore, the analyst(s) are not subject to supervision by a U.S. broker-dealer, or otherwise required to satisfy the regulatory licensing
requirements of FINRA and may not be subject to the Rule 2241 restrictions on communications with a subject company, public appearances and trading
securities held by a research analyst account.
JM Financial Institutional Securities only accepts orders from major U.S. institutional investors. Pursuant to its agreement with JM Financial Institutional Securities,
JM Financial Securities effects the transactions for major U.S. institutional investors. Major U.S. institutional investors may place orders with JM Financial
Institutional Securities directly, or through JM Financial Securities, in the securities discussed in this research report.
Additional disclosure only for U.K. persons: Neither JM Financial Institutional Securities nor any of its affiliates is authorised in the United Kingdom (U.K.) by the
Financial Conduct Authority. As a result, this report is for distribution only to persons who (i) have professional experience in matters relating to investments
falling within Article 19(5) of the Financial Services and Markets Act 2000 (Financial Promotion) Order 2005 (as amended, the "Financial Promotion Order"), (ii)
are persons falling within Article 49(2)(a) to (d) ("high net worth companies, unincorporated associations etc.") of the Financial Promotion Order, (iii) are outside
the United Kingdom, or (iv) are persons to whom an invitation or inducement to engage in investment activity (within the meaning of section 21 of the Financial
Services and Markets Act 2000) in connection with the matters to which this report relates may otherwise lawfully be communicated or caused to be
communicated (all such persons together being referred to as "relevant persons"). This report is directed only at relevant persons and must not be acted on or
relied on by persons who are not relevant persons. Any investment or investment activity to which this report relates is available only to relevant persons and will
be engaged in only with relevant persons.
Additional disclosure only for Canadian persons: This report is not, and under no circumstances is to be construed as, an advertisement or a public offering of the
securities described herein in Canada or any province or territory thereof. Under no circumstances is this report to be construed as an offer to sell securities or as
a solicitation of an offer to buy securities in any jurisdiction of Canada. Any offer or sale of the securities described herein in Canada will be made only under an
exemption from the requirements to file a prospectus with the relevant Canadian securities regulators and only by a dealer properly registered under applicable
securities laws or, alternatively, pursuant to an exemption from the registration requirement in the relevant province or territory of Canada in which such offer or
sale is made. This report is not, and under no circumstances is it to be construed as, a prospectus or an offering memorandum. No securities commission or
similar regulatory authority in Canada has reviewed or in any way passed upon these materials, the information contained herein or the merits of the securities
described herein and any representation to the contrary is an offence. If you are located in Canada, this report has been made available to you based on your
representation that you are an ‚accredited investor‛ as such term is defined in National Instrument 45-106 Prospectus Exemptions and a ‚permitted client‛ as
such term is defined in National Instrument 31-103 Registration Requirements, Exemptions and Ongoing Registrant Obligations. Under no circumstances is the
information contained herein to be construed as investment advice in any province or territory of Canada nor should it be construed as being tailored to the
needs of the recipient. Canadian recipients are advised that JM Financial Securities, Inc., JM Financial Institutional Securities Limited, their affiliates and authorized
agents are not responsible for, nor do they accept, any liability whatsoever for any direct or consequential loss arising from any use of this research report or the
information contained herein.
JM Financial Institutional Securities Limited Page 23You can also read