FIRST QUARTER 2022 Investor Presentation - CatchMark Investor Relations
←
→
Page content transcription
If your browser does not render page correctly, please read the page content below

FIRST QUARTER 2022 Investor Presentation
FORWARD-LOOKING STATEMENTS

This presentation contains forward-looking statements within the meaning of Section 27A of the Securities Act of 1933 and Section 21E of the Securities Exchange
Act of 1934, as amended. Such forward-looking statements can generally be identified by our use of forward-looking terminology such as "may," "will," "expect,"
"intend," "anticipate," "estimate," "believe," "continue," or other similar words. However, the absence of these or similar words or expressions does not mean that a
statement is not forward-looking. Forward-looking statements are not guarantees of performance and are based on certain assumptions, discuss future
expectations, describe plans and strategies, contain projections of results of operations or of financial condition or state other forward-looking information.
Forward-looking statements in this presentation include, but are not limited to, that we seek to capture the highest value per acre and to generate sustainable
yields through disciplined management and superior stewardship of its exceptional resources; that we expect to capitalize on increasing housing and
repair/remodel demand which should lead to higher lumber and OSB consumption and better pricing; that we will seek to grow Adjusted EBITDA and long-term
NAV through stepped up timberland acquisitions while continuing to adhere to our stringent underwriting criteria; that overall deal activity is expected to grow
over the next two to three quarters; that will seek additional income-generating and value creation opportunities from environmental initiatives that could
represent up to 20% of future cash available for distribution; that we will diversify our sources of Adjusted EBITDA; that we ensure good stewardship of the
environment; that the improving overall asset quality and increasing share of sawtimber in our harvest mix enhances prospects for future revenue growth; that
recent significant mill investment should lead to greater, near-term price appreciation; that U.S. South pine demand metrics continue to increase through 2025;
that through disciplined management and superior stewardship, we seek to maximize stable and growing cash flow through all phases of the business cycle; that
strong relationships and supply agreements help secure dependable outlets for CatchMark harvests; that in light of unprecedented retail demand, timberland
sales are expected to range between 2% and 3% of fee timberland acreage; that we seek to maintain balance sheet flexibility for opportunistic investments and to
manage potential revenue volatility with an aim to lower overall leverage in the near-term; our ESG ambitions; and our guidance with respect to our anticipated
2022 results. Forward-looking statements involve risks and uncertainties that could cause actual results to differ materially from our historical experience and our
present expectations, including, but not limited to (i) the supply of timberlands available for acquisition that meet our investment criteria may be less than we
currently anticipate; (ii) we may be unsuccessful in winning bids for timberland that are sold through an auction process; (iii) we may not be able to access external
sources of capital at attractive rates or at all; (iv) potential increases in interest rates could have a negative impact on our business; (v) timber prices may not
increase at the rate we currently anticipate or could decline, which would negatively impact our revenues; (vi) we may not generate the harvest volumes from our
timberlands that we currently anticipate; (vii) the demand for our timber may not increase at the rate we currently anticipate or could decline due to changes in
general economic and business conditions in the geographic regions where our timberlands are located, including as a result of the COVID-19 pandemic and the
measures taken as a response thereto; (viii) a downturn in the real estate market, including decreases in demand and valuations, may adversely impact our ability
to generate income and cash flow from sales of higher-and-better use properties; (ix) we may not be able to make large dispositions of timberland in capital
recycling transactions at prices that are attractive to us or at all; (x) our dividends are not guaranteed and are subject to change; (xi) the markets for carbon
sequestration credits, wetlands mitigation banking and solar projects are still developing and we maybe unsuccessful in generating the revenues from
environmental initiatives that we currently expect or in the timeframe anticipated; (xii) our share repurchase program may not be successful in improving
stockholder value over the long-term; (xiii) our joint venture strategy may not enable us to access non-dilutive capital and enhance our ability to make acquisitions;
and (xiv) the factors described in Part I, Item 1A Risk Factors of our Annual Report on Form 10-K for the fiscal year ended December 31, 2021 and our other filings
with Securities and Exchange Commission. Accordingly, readers are cautioned not to place undue reliance on these forward-looking statements, which speak only
as of the date of this presentation. We undertake no obligation to update our forward-looking statements, except as required by law.

                                                                                                                                                                    2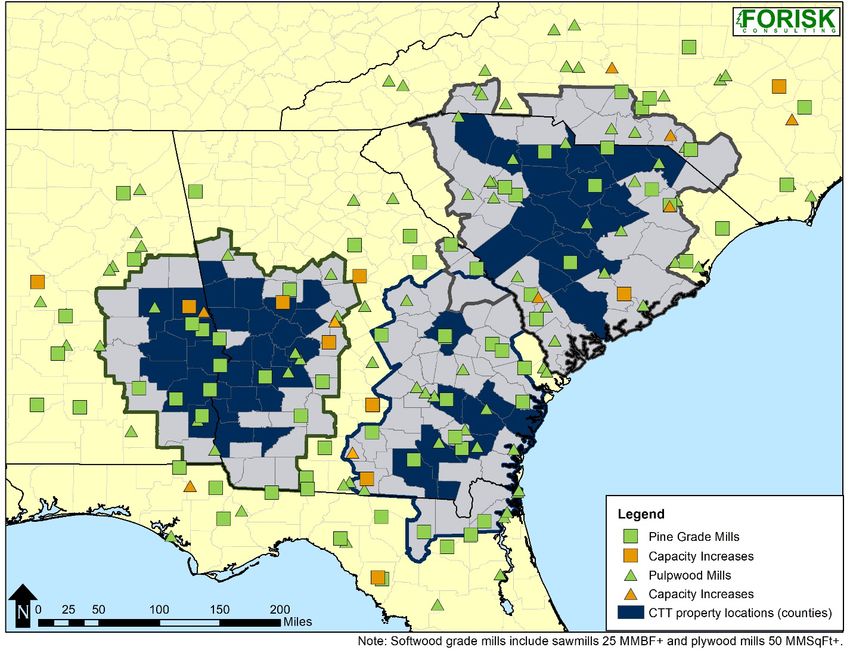
TABLE OF CONTENTS

SECTION                                                                                                                                PAGE
CatchMark Overview                                                                                                                         4

Strategic Priorities to Drive Growth                                                                                                       11

Prime Timberlands                                                                                                                          18

High-Demand Mill Markets                                                                                                                   23

Superior Stewardship                                                                                                                       29

Capital Strategy                                                                                                                           36

Commitment to ESG Best Practices                                                                                                           39

Summary                                                                                                                                    47

Appendix                                                                                                                                   50

In this presentation (1) “CatchMark” refers to CatchMark Timber Trust, Inc., a Maryland corporation that has elected to be taxed as a real estate investment trust (NYSE:
CTT), (2) “Triple T” refers to TexMark Timber Treasury, L.P., a Delaware limited partnership that is a joint venture that was managed by CatchMark and in which
CatchMark held a common limited partnership interest through October 14, 2021, and (3) “Dawsonville Bluffs” refers to Dawsonville Bluffs, LLC, a Delaware limited
liability company that is a joint venture managed by CatchMark and in which CatchMark holds a 50% limited liability company interest.

                                                                                                                                                                      3
CATCHMARK OVERVIEW

                     4
Maximizing Value of Exceptional Timberlands
      through Superior Stewardship
THREE PILLAR BUSINESS MODEL
CatchMark (NYSE: CTT) invests in prime timberlands located in the nation’s leading mill markets, seeking to
capture the highest value per acre and to generate sustainable yields through disciplined management and
superior stewardship of its exceptional resources.

               PRIME                           HIGH-DEMAND                           SUPERIOR
            TIMBERLANDS                        MILL MARKETS                        STEWARDSHIP

                                                                             Optimizing results through
                                        Expanding acquisition activity    disciplined management, which
     Acquiring and owning prime
                                          and harvest operations in           historically has produced
    timberlands through prudent
                                       leading mill markets in the U.S.   industry-leading productivity on
     and disciplined allocation of
                                         South, the nation’s premier       a per-acre basis, and the value
                capital
                                               timber basket                realization of environmental
                                                                                      initiatives

                         STRATEGIC FOCUS DRIVES STABLE AND PREDICTABLE CASH FLOW

                                                                                                              6
KEY FACTS

FIRST PURE-PLAY                                           U.S. South                              STRONG                 Ample Liquidity:
  TIMBER REIT
                                                                                                                                               $
                                                                                                    balance sheet
                                                          Focused                                                        $281
 Simple strategy focused
entirely on investing in and                              365,300                                    SOLID               MILLION
  managing timberlands                                    acres (3/31/2022)                         capital position     (3/31/2022)

2021 Total                                                                                    HIGHEST
                                                                              100%
                                                                                                                                         Significant
Distributions Paid:                                                                           HARVEST
                                                                                              PRODUCTIVITY &                             PRICING
$23.3                                                         of timberlands located in       HARVEST EBITDA                           PREMIUMS
MILLION                                                           TOP 7 MARKETS               per acre vs. peers
                                                                                                                             over Southwide averages
68% CAD payout ratio                                                                          (U.S. South)

DELIVERED WOOD
SALES:                                                                             Superior                              STRATEGIC PROXIMITY
                                                                                                         INDUSTRY
72%                                                                SITE INDEX:                            LEADING
                                                                                                                         TO MILLS:
                                                                                                                         38 MILES
of total timber
sales volume
                                                                                        75         Customers/End Users
                                                                                                                         Average Haul Distance

                                                                    POSITIVE
                                   4:1                                                                                     50%            57%
                    Four seedlings
                                                            NET CARBON IMPACT
                                                                       (MtCO2e/year)          100%                         Executive        All

                                                             1.15 Million
                                                                                                                            Officers     Employees
                  planted for every                                                           SFI Certified
                    tree harvested                                  (2020 U.S. South)                                            ARE WOMEN

                                                                                                                                                  7
 As of or for the year ended 12/31/2021 unless otherwise noted.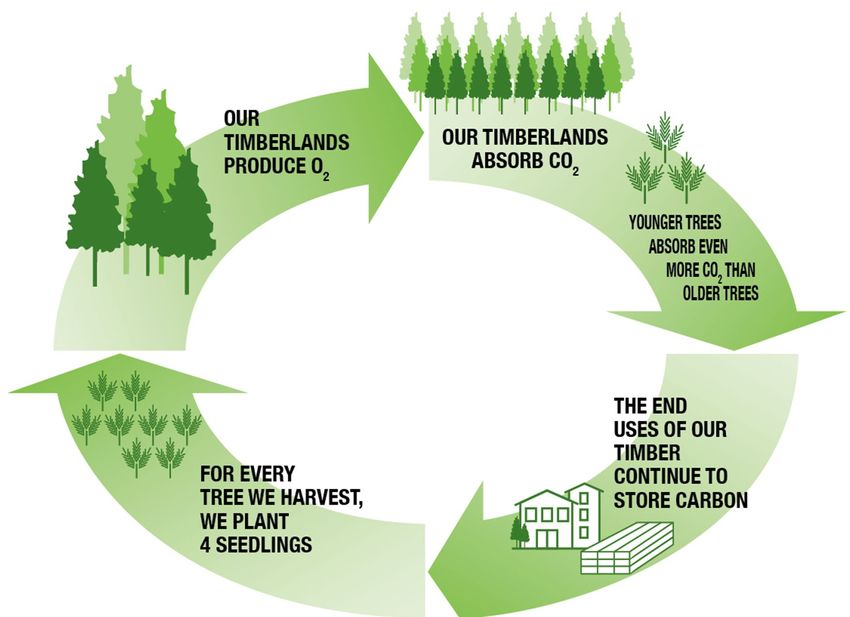
PRIME TIMBERLANDS, PREMIER MARKETS, SUPERIOR STEWARDSHIP

                                           STRATEGIC FOCUS DRIVES PREDICTABLE AND SUSTAINABLE PERFORMANCE

                 PRIME TIMBERLANDS                            HIGH-DEMAND MILL MARKETS                           SUPERIOR STEWARDSHIP

                                                           PROVIDES RELIABLE OUTLET FOR                        GENERATES SUSTAINABLE
     PRODUCES DURABLE REVENUE
                                                             AVAILABLE MERCHANTABLE                            YIELDS THROUGHOUT THE
             GROWTH
                                                                    INVENTORY                                      BUSINESS CYCLE

   ‒ Top Markets: 100% of CatchMark’s                      ‒ Higher Pricing: 8% and 30% increase in       ‒ Supply Agreements: Creditworthy,
     timberlands located in top seven                        pulpwood and sawtimber pricing,                blue-chip customers provide a steady
     markets and 63% located in top three                    respectively.1                                 revenue stream - 41% of 2021 total
     markets.                                                                                               pulpwood harvest volume sold under
                                                           ‒ Significant Pricing Premiums: Realized         supply agreements.
   ‒ Industry Leading Productivity: Highest                  significant premiums over U.S. South-
     productivity per acre among peers while                 wide averages - 37% and 47% for              ‒ Delivered Wood Model: Allows better
     maintaining consistent per acre                         pulpwood and sawtimber, respectively. 2        control of supply chain, producing more
     stocking.                                                                                              stable cash flows with greater visibility -
                                                           ‒ Mill Market Advantages: Market depth           72% of total timber sales volume.
   ‒ New Investments Targets:
                                                             and customer diversity provides ability to
        ‒ Near-term cash accretion and/or                    manage through pandemic-related              ‒ Environmental Sustainability: Maintain
          long-term accretive portfolio                      disruptions, seasonal mill outages and         SFI certification for all fee timberlands;
          attributes                                         inclement weather.                             issued inaugural ESG and Carbon
        ‒ Bolt-on existing portfolio transactions                                                           reports.
        ‒ Potential for environmentally-focused
          income opportunities.

As of 12/31/2021 unless otherwise noted.
1.     Q1 2022 compared to Q1 2021.                                                                                                                       8
2.     For Q1 2022.
DEMAND DRIVERS
 CatchMark expects to capitalize on increasing housing and repair/remodel demand driven by demographic
 and aging housing trends which should lead to higher lumber and OSB consumption and better pricing.

                US Housing Starts Recovery Still Has Years to Run                                             US Wood Products Consumption by End-Use Sector
Starts in M
                                                                                        Million m3
                      Single-Family                             Multifamily                               New Residential Construction                    Residential Improvements
   2.5                5-Year Moving Average                                                200            Industrial Production                           Nonresidential Construction

     2
                                      Approximately 75% of housing starts
                                       comprised of single-family homes,                    150
                                        using 3-5x the amount of wood.
   1.5

     1                                                                                      100

   0.5
                                                                                             50

     0
          00   02     04        06    08    10   12   14   16     18   20     22   24         0
                                                                                                   10    11    12   13    14   15   16   17     18    19 20 21 22 23 24 25 26

          Stronger Housing Market Will Push Southern Sawtimber Demand Higher Growth and Drain,                                                                                    Inventory,
                                                                                                                    U.S. South Sawtimber Inventory Stabilizes
                                                                                        BBF Int'l 1/4"                                                                           BBF Int'l 1/4"
  BBF Int'l 1/4"
    25                                                                                       30                      Drain               Growth                Inventory              350
                         Lumber            Plywood    Pulp       OSB     Other
                                                                                             25                                                                                       300
    20
                                                                                                                                                                                      250
                                                                                             20
     15                                                                                                                                                                               200
                                                                                              15
                                                                                                                                                                                      150
     10
                                                                                              10
                                                                                                                                                                                      100
      5
                                                                                               5                                                                                      50

      0                                                                                       0                                                                                       0
           08 09 10        11    12 13 14 15 16 17 18 19 20 21 22 23 24 25                         00    02     04       06    08   10     12        14   16   18   20     22   24
                                                                                                                                                                                            9
   Source: Forest Economic Advisors
100% COMMITTED TO ESG BEST PRACTICES
CatchMark is committed to incorporating sustainable practices into operations, seeking to produce more
profitable and beneficial results for all stakeholders. In addition, Environmental, Social and Governance (ESG)
initiatives are integrated into all business and management practices.

                  ENVIRONMENTAL                                          SOCIAL                                               GOVERNANCE

   Our dedication to environmental stewardship is   CatchMark focuses on ensuring a safe and               Corporate governance policies promote the
   evidenced by our strong commitment to            healthy workplace. We provide high-quality             long-term interests of stockholders based on
   sustainable forestry. CatchMark’s expansive      benefits to our employees, including healthcare        accountability, integrity and trust.
   environmental policies address:                  and wellness initiatives, time-off for volunteering,
                                                                                                           ‒   Programs and policies aimed at advancing
                                                    and a charitable matching program. We also
    ̶   Forest certifications and best management                                                              ESG and engaging stakeholders
                                                    provide regular training opportunities and have
        practices                                   established a scholarship program for children of      ‒   Strict code of business conduct and ethics
    ̶   Wildlife conservation                       employees.
                                                                                                           ‒   Whistleblower policy
    ̶   Soil and water                              ‒   CatchMark values diversity in the workplace:
    ̶   Chemical usage                                  50% of our executive officers are women and        ‒   Other expansive policies that address:
                                                        57% of all employees are women                         Election of directors, risk oversight, political
    ̶   Fire management
                                                                                                               contributions, conflicts of interest
    ̶   Climate change                              ‒   24% of our employees are members of an
    ̶   Contractor training and certification           ethnic or racial minority

                                                                                                                                                                  10
STRATEGIC PRIORITIES TO DRIVE GROWTH
11STRATEGIC PRIORITIES
CatchMark is focused on our tested and proven business model with a clear track to generate long-term growth.
DISCIPLINED ACQUISITIONS OF PRIME TIMBERLANDS
• Grow Adjusted EBITDA and long-term NAV
through stepped-up timberland acquisitions
while continuing to adhere to our stringent
underwriting criteria.
‒ Small Tract Program: Smaller, off-market
transactions with proximity to existing
holdings.
‒ Larger Acquisitions: High-quality
industrial timberland properties with a
target transaction size ranging from $5
million to $50 million.
ENVIRONMENTAL INITIATIVES
• Recognizing the key role that forests play in
protecting the environment, seek
environmentally-focused income opportunities.
‒ Wetlands mitigation banking
‒ Solar projects
‒ Carbon sequestration
12DISCIPLINED GROWTH THROUGH ACQUISITIONS OF PRIME TIMBERLANDS
CatchMark will seek to grow Adjusted EBITDA and long-term Net Asset Value through stepped-up timberland
acquisitions, both through the small tract and larger transactions programs. while continuing to adhere to our
stringent underwriting criteria.
Acquisition Focus Targeted Areas
• Execute both small tract and larger transactions up
to approximately $50 million per deal
• Focus in and around leading U.S. South mill markets
where we already have a major presence, building
additional scale at the local level
• Maintain our industry-leading Harvest EBITDA per
acre while maintaining stable merchantable
inventory per acre
• Seek high allocation of pine plantations with strong
site indices and above average operability
Transaction Characteristics
• Near-term cash accretive: Secure high
merchantable stocking levels with an older average
age
• Long-term accretive portfolio attributes: Deals that
complement long-term portfolio objectives that
balance portfolio age class distribution and
productivity
• Potential for providing environmentally-focused
income opportunities
13PROVEN TRACK RECORD OF ACQUISITIONS
To further its growth trajectory, CatchMark is fully engaged in seeking investment opportunities and has a
proven track record of acquisitions throughout the U.S. South.
RECENT DEALS UNDER PSA
As of 5/1/2022
# of Deals: 2
Total Acres: 2,400
Total Price: Approx. $5M
Location: AL and SC
Attributes: Long-term portfolio accretive
HISTORICAL ACQUISITIONS UNDER $50M
2014 – 2021
# of Deals: 20
Total Acres: 143,147
Total Price: $270.9M
Average deal price: $13.5M
Average acres: 7,200
$/Acre: $1,893
Total Stocking (Tons): 7.3M
Stocking (Tons/Acre): 51
Seeing active deal opportunities in target markets in U.S. South
with overall deal activity expected to grow over next two to three quarters
14DISCIPLINED ACQUISITION PROCESS
CatchMark employs a disciplined five-step process in analyzing and assessing potential new investments to
help ensure prudent decision making and successful long-term outcomes.
MILL/ UPDATE
1. 2. 3. 4. 5.
MODELING/ FIELD DUE FORMALIZED
MARKET MODELING/
ANALYSIS DILIGENCE APPROVAL
STUDY ANALYSIS
• Growth/drain ratios • Comp sales analysis • Detailed inventory • Update all analyses • Rigorous review by and
• Mill consumption and • Harvest modeling and DCF measurement, following field due necessary approval from
end-use products analysis with management verification diligence Board of Directors and/or
• Cost curves of mills cost and CAPEX • Evaluate site Executive Committee
assumptions, reviewing: productivity and
• Stocking levels and age historical management
class distribution
• Allocation of pine
plantation acres
• Site Index
• Operability
• Harvest Variability
• CAD yield & IRR analysis
• Harvest EBITDA / Acre
• Wood/Fiber Supply
Agreements
• Environmental
Opportunities
15ENVIRONMENTAL INITIATIVES
CatchMark will seek additional income-generating and value creation opportunities from environmental
initiatives that could represent up to 20% of future cash available for distribution.
CARBON SEQUESTRATION SOLAR WETLANDS MITIGATION BANKING
Advance solar leasing initiatives Identify and execute on
Execute carbon offset projects
which help produce energy and wetlands mitigation banking
on lower operability, non-core
reduce greenhouse emissions in opportunities in existing
tracts
a sustainable manner portfolio and future acquisitions
16EVOLUTION OF ADJUSTED EBITDA
Planned growth path highlights CatchMark’s diversifying Adjusted EBITDA from harvest operations, real estate
and environmental initiatives.
Adjusted EBITDA Breakdown1
Near-to-Mid-Term Long-Term Targets
Targets
Harvest
Harvest
Real Estate Real Estate
Environmental Investment Environmental
Investment
Initiatives Management Initiatives
Management
17
1. Excluding Corporate/Non-Allocated.PRIME TIMBERLANDS
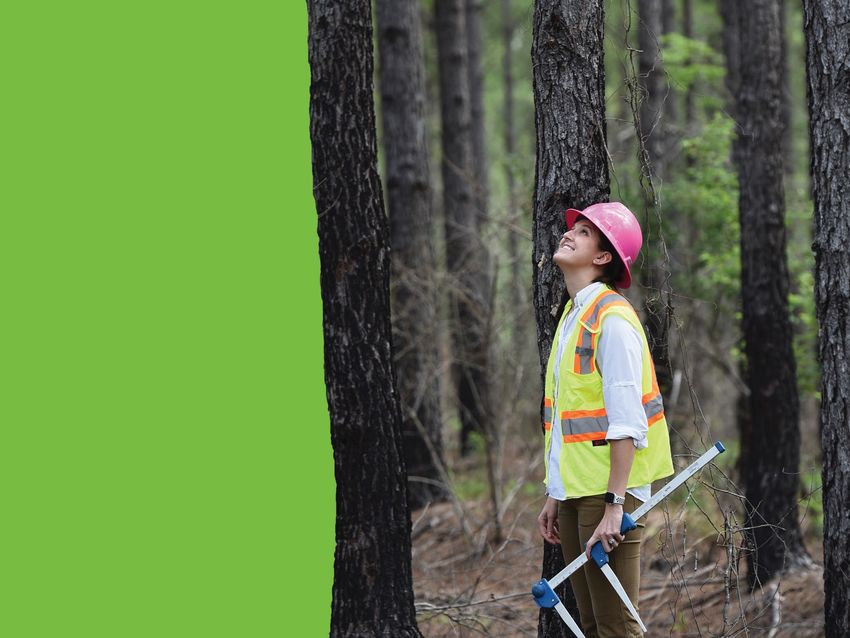
18PRIME TIMBERLANDS
Our portfolio comprises 365,3001 acres of timberland located in the nation’s best timber markets in the U.S.
South, where we implement our sustainable harvesting strategy to produce durable yields while ensuring
good stewardship of the environment.
Acreage as of 3/31/2022 WHAT WE GROW:
72% PINE BY ACREAGE
Alabama 66,900
Georgia 231,200 INVENTORY VOLUME:
South Carolina 67,200 54% SAWTIMBER / 46% PULPWOOD
TOTAL 365,300
TONS OF MERCHANTABLE TIMBER: 14.6 MILLION
AVERAGE PINE PLANTATION AGE: 12
AVERAGE SITE INDEX: 75
DELIVERED WOOD SALES: 70% / STUMPAGE: 30%
STRATEGIC PROXIMITY TO MILLS:
38 MILES - AVERAGE HAUL DISTANCE
CATCHMARK HAS THE HIGHEST HARVEST PRODUCTIVITY AND HARVEST EBITDA PER ACRE AMONG ITS PEERS
As of or for the year ended 12/31/2021 unless noted otherwise. 19
1, As of 3/31/2022.IMPROVED U.S. SOUTH TIMBERLAND ASSETS
CatchMark has significantly improved timberland asset quality and enhanced productivity through silviculture
techniques, acquisitions and sales that increase overall merchantable tons per acre and sawtimber mix.
Sawtimber % Increased Sawtimber Mix2
55%
• Acquired 266,900 of fee acres for $638.3 million.
• Increased merchantable inventory by 11.8 million
50%
tons1.
• Acquired high-quality assets:
45%
• Average 44 tons per acre merchantable
inventory
40%
• 75% pine plantation by acreage
• 54% sawtimber by tons (more valuable
product due to higher pricing than pulpwood) 35%
2014 2015 2016 2017 2018 2019 2020 2021 2022
• Improved average site index for inventory from 68
to 75.
% Pine Plantation Acres – Site Index Distribution
• Higher site index generates greater harvest 30%
1/1/2014, Avg SI=68 1/1/2022, Avg SI=75
yields
25%
• Deployed genetically-improved seed stock
20%
• 80% of replanted acres utilized 2nd generation
or better genetically-improved seedlings 15%
10%
5%
0%SUPERIOR HARVEST PRODUCTIVITY IN U.S. SOUTH
CatchMark delivers the highest productivity per acre among its peers, diversified age profile and consistent
stocking per acre through prime acquisitions and sustainable forest management.
Harvest Tons / Acre Harvest Productivity1 Stocking Tons / Acre Stocking
6.0 55
5.5 WY
CTT 50 PCH
5.0
4.5 45
4.0 WY 40
CTT
3.5 PCH
RYN 35 RYN
3.0
2.5 30
2014 2015 2016 2017 2018 2019 2020 2021 2014 2015 2016 2017 2018 2019 2020 2021
Acres2 Forest Age Class Profile (Pine)
As of 12/31/2021
80,000
Natural Pine and Hardwood Acre 3 Pine Plantation Acre 4
60,000
40,000
20,000
0
0-2 3-5 6-8 9-11 12-14 15-17 18-20 21-23 24+
As of or for the year ended 12/31 of each year.
Source: Company 10-K filings. Southern timberland only. CatchMark, Weyerhaeuser, and Rayonier use the same definition of merchantable age on Southern timber. Weyerhaeuser’s productivity is calculated using fee harvest
volume over fee acres (total harvest volume on all acres not publicly disclosed).
1. 2020 harvest tons per acre includes 0.1 million tons harvested under a timber reservation entered into in connection with the capital recycling disposition of our Southwest portfolio in late 2018. This timber reservation expired
in late 2020.
2. Acres presented in the graph includes fee timberland only, excludes 10,500 acres of non-forest land.
3. Natural Pine and Hardwood represents acres that have been seeded by standing older pine trees near the site through the natural process of seeds dropping from the cones of the older trees. Natural pine sites generally include
some mix of natural occurring hardwood trees as well. 21
4. Pine Plantation represents acres planted or to be planted with pine seedlings to maximize the growth potential and inventory carrying capacity of the soils. Planted pine acre inventory is devoted to pine species only.MARKET OUTPERFORMANCE - PRICING PREMIUMS
CTT Markets1 Premium Over Non-CTT Markets
Pine Pulpwood2 Pine Chip-N-Saw2
40%
60% Avg Premium = $3.18 Avg Premium = $2.61
Current Premium = $4.39 Current Premium = $2.39
30%
50%
20%
40%
10%
30%
0%
20% 2014 2015 2016 2017 2018 2019 2020 2021 2022
2014 2015 2016 2017 2018 2019 2020 2021 2022
Pine Sawtimber2
30%
Avg Premium = $2.29 CURRENT CATCHMARK PRICING PREMIUMS
Current Premium = $3.49 VS TIMBERMART-SOUTH
20%
Pulpwood + 37%
10%
Sawtimber3 + 47%
0%
2014 2015 2016 2017 2018 2019 2020 2021 2022
As of 3/31/2022 unless noted otherwise. 3. Includes chip-n-saw and sawtimber.
1. CTT markets: AL2, GA2, SC2 22
2. Price represents simple average prices as reported by TimberMart-South.HIGH-DEMAND MILL MARKETS
23HIGH-DEMAND MILL MARKETS
CatchMark strategically invests in the U.S. South, the largest active wood basin in the world, located near
leading mill markets to facilitate strong relationships with customers and secure reliable outlets for harvests.
Market Ranking CTT Acres1 % of CTT
• Mills cluster near prime timberlands where
Georgia 2 #3 231,200 63%
CatchMark invests by design.
• Ongoing mill expansions and greenfield projects South Carolina 2 #6 67,200 18%
promise to ramp up demand further, reduce
Alabama 2 #7 66,900 19%
supply and increase prices over time.
• Significant presence of leading lumber producers 365,300 100%
provides access to creditworthy counterparties.
• Access to forester pools provides competitive
labor costs.
• Proximity to transport routes and mills creates
cost efficiencies from shorter haul distances.
100% OF CATCHMARK’S TIMBERLANDS ARE LOCATED IN THE TOP SEVEN MARKETS 1
1. By acreage as of 3/31/2022. Source: TimberMart-South. Represents simple averages of quarterly state and submarket stumpage prices through 2021 as reported by TimberMart-South. Ranking calculated using 60% of
each market's pine pulpwood pricing and 40% of each market's pine sawtimber pricing. 24HIGH-DEMAND MILL MARKETS WITH STRONG FUNDAMENTALS
CatchMark targets investments in markets with favorable current and long-term supply/demand fundamentals.
25
Source: Forisk Consulting LLC, February 2022.NEW U.S. SOUTH MILL INVESTMENT
Recent significant mill investment has concentrated in regions with significant supply overhang as well as near
better labor markets and/or end-user markets; such investment should lead to greater, near-term price
appreciation for proximate CatchMark holdings.
Capital Investments in Wood-Using Assets
$ Millions South North West
10,000
8,000
6,000
4,000
2,000
0
2016 2017 2018 2019 2020 2021
Capital Investments (2016 – 2021)
South: $23.5 Billion
North: $7.6 Billion
West: $4.3 Billion
26
Source: Forisk Consulting LLC, February 2022.GROWING DEMAND IN CATCHMARK MARKETS
COASTAL
Consumption
CURRENT DEMAND # of Mills
(M tons)
Pulpwood 41 13.0
Pine Grade 66 8.4
TOTAL 107 21.4
Consumption
INCREMENTAL DEMAND # of Mills
(M tons)
Pulpwood 1 0.2
Pine Grade 0 0.5
TOTAL 1 0.7
SOUTH CENTRAL
Consumption
CURRENT DEMAND # of Mills
(M tons)
Pulpwood 39 9.1
Pine Grade 57 8.6
TOTAL 96 17.7
Consumption
INCREMENTAL DEMAND # of Mills
(M tons)
Pulpwood 1 0.3
Pine Grade 1 1.0
TOTAL 2 1.3
Note: New mills includes East Alabama Lumber reopening.
MID-ATLANTIC
Consumption
CURRENT DEMAND # of Mills
(M tons)
Pulpwood 56 11.4
Pine Grade 66 9.3
TOTAL 122 20.7
Consumption
INCREMENTAL DEMAND # of Mills
(M tons)
Pulpwood 2 1.0
Pine Grade 0 0.3
TOTAL 2 1.3
Note: New mils includes West Fraser reopening the Fairfax, SC OSB mill.
27
Source: Forisk Consulting LLC, February 2022.U.S. SOUTH DEMAND INCREASES THROUGH 2025
U.S. South pine demand metrics continue to increase through 2025.
28
Source: Forisk Consulting LLC, April 2020.SUPERIOR STEWARDSHIP
29SUPERIOR STEWARDSHIP THROUGH DISCIPLINED MANAGEMENT
Through disciplined management and superior stewardship, we seek to maximize stable and growing cash
flow through all phases of the business cycle and have outperformed industry peers significantly on a Harvest
EBITDA per acre basis .
INDUSTRY OUTPERFORMANCE
• Actively manage timberlands to realize maximum U.S. South Harvest EBITDA1 Per Acre (2015 - 2021)
organic growth and harvest profitability through $85
CTT
sustainable practices $80
• Utilize best-in-class foresters to manage holdings $75
$70
• Proactively manage customers and prospective RYN
$65
end-users
$60
• Maximize revenues by strategically utilizing: $55 NCREIF
• Supply agreements $50 PCH
• Delivered wood sales $45 WY
• Harvest mix $40
• Identify, prioritize and market HBU property sale $35
2015 2016 2017 2018 2019 2020 2021
• Divest non-core timberlands
• Generate non-timber revenue from:
• Environmental initiatives: carbon sequestration,
wetlands mitigation banking, solar projects
• Hunting/recreational leases
• Asset management
SIGNIFICANTLY OUTPERFORMS INDUSTRY PEERS ON A HARVEST EBITDA PER ACRE BASIS IN U.S. SOUTH
30
1. See definition of Adjusted EBITDA, a non-GAAP measure, reconciliation of net income (loss) to Adjusted EBITDA and Adjusted EBITDA by Segment in Appendix. NCREIF data includes all segments of EBITDA.DELIVERED WOOD SALES ADVANTAGES
CatchMark’s emphasis on delivered wood sales — 72% of total timber sales volume—to creditworthy
counterparties, keeps better control of supply chain, producing more stable cash flows with greater visibility.
Delivered Wood Sales Volume
100%
• Delivered wood sales allow CatchMark to direct
the harvesting/delivering of wood to end-users. 80%
• CatchMark works in concert with loggers to
60%
secure more profitable outcomes.
40%
• By focusing activity in top-tier mill markets and
using delivered sales, CatchMark establishes
20%
direct relationships with leading end-users and
becomes a preferred supplier. 0%
2014 2015 2016 2017 2018 2019 2020 2021
• With a finite number of loggers to work with, our
Delivered % of total volume Stumpage % of total volume
model helps control our supply chain. Loggers
benefit from higher utilization rates — mitigating
our risk and theirs. Delivered Wood Sales of Pure-Play Timberland REITs
Delivered Wood Sales as % of Total Volume
2016 2017 2018 2019 2020 2021
CTT 64% 74% 80% 71% 63% 72%
RYN1 39% 34% 40% 33% 41% 40%
31
1. Source: Rayonier, 2021 10-K.INDUSTRY LEADING CUSTOMERS/END USERS
Strong relationships and supply agreements with leading lumber producers and paper/packaging
manufacturers help secure dependable outlets and pricing for CatchMark’s harvests.
Relationships with the following companies account
for 67% of CatchMark’s annual timber sales revenue1:
Canfor Top five lumber producer in North America.
Georgia-Pacific Top 10 lumber producer in North America, #3 pulp/paper producer in the U.S.
Interfor Top five lumber producer in North America.
International Paper World’s largest pulp and paper company.
M.C. Dixon Leading regional producer of SYP lumber.
New-INDY Regional leader in lightweight linerboard production.
West Fraser Top five lumber producer in North America.
WestRock 2nd largest American packaging company.
32
1. For the year ended 12/31/2021.LONG-TERM SUPPLY AGREEMENTS
CatchMark employs long-term supply agreements with creditworthy mill operators, establishing stable
baseload demand and corresponding cash-flow visibility, lowering risk in down markets and providing inflation
protection.
• Initial agreement terms range between 10 and 25
years. 41%
of 2021 Total Pulpwood Harvest Volume from Supply Agreements with:
• Quarterly pricing adjustments capture market
pricing.
International Paper WestRock
(IP) (WRK)
• Agreements include fuel pricing adjustments,
Net Sales $19.4B1 $18.7B2
mitigating impact from inflation.
Moody’s: Baa2 Moody’s: Baa2
• Effectively all volume is pulpwood. Credit Rating3
S&P: BBB S&P: BBB
• 95% of CatchMark acres in regions covered by Consumer
Mill Type Pulp/Paper
agreements are located close to mills (within a packaging, lumber
75-mile radius). Food, beverage,
Healthcare,
merchandising
Uses printing, writing,
displays, building
consumer products
products
Demand Outlook Stable Stable
1. For fiscal year ended 12/31/2021,
2. For fiscal year ended 9/30/2021.
3. As of 4/25/2022. 33VALUE CHAIN
Once we harvest our trees, we replant within a period of one year. Harvested trees are transported, processed
and utilized in a variety of uses, which in many cases transfers a portion of the carbon contained within the trees
into its end-uses where it is stored.
Where Our Harvest Shows Up1
Building
Paper and Materials
Packaging 49%
51%
34
1. End uses of timber represents CatchMark’s 2021 timber sales based on volumes.LAND SALE STRATEGY SUPPLEMENTS PORTFOLIO RETURNS
In light of unprecedented retail demand, annual timberland sales are expected to range between 2% and 3% of
fee timberland acreage.
Disposition Strategy Land Sale Revenue and Acres Sold
Thousands
• Sales price per acre increased more than 10% over Land Sales $ % of Fee Acre
$20,000 2.5%
2020 despite lower stocking characteristics due
to unprecedented retail demand. $18,000
2.0%
$16,000
• Targeted potential sales include tracts: 1.5%
$14,000
̶ With low merchantable volume, high $12,000 1.0%
bottomland components, or $10,000
access/operability issues 0.5%
$8,000
̶ With little to no near-term income $6,000 0.0%
2016 2017 2018 2019 2020 2021
̶ Lacking proximity to other holdings
Land Sales Data
̶ Which are non-contiguous and where a parcel
split could increase HBU potential and create 2016 2017 2018 2019 2020 2021
a superior timber parcel Price per acre1 $1,718 $1,924 $2,064 $1,920 $1,689 $1,867
Margin1 17% 29% 23% 14% 21% 31%
Stocking (tons/acre)2 20 27 26 37 26 21
Premium (Discount) of
Stocking to CTT Portfolio (51%) (36%) (38%) (14%) (38%) (49%)
Avg at 1/1 each year
Pine Stocking (tons/acre)2 8 14 19 12 14 8
Premium (Discount) of Pine
Stocking to CTT Portfolio (70%) (48%) (31%) (56%) (48%) (69%)
Avg at 1/1 each year
1. Excludes value of timber reservations. 35
2. Stocking refers to merchantable timber inventory per acre. CatchMark considers 15-year or older pine as merchantable.CAPITAL STRATEGY
36SOLID CAPITAL POSITION
CatchMark’s stronger balance sheet, solid capital position, ample liquidity and significantly lower leverage
support ongoing operations and growth initiatives.
Liquidity1 Credit Facilities and Maturity Schedule1
Millions Acquisition facilities LOC Cash
Total Credit Facilities of $553.6 Million
$300
Millions
Weighted-Average Life of Outstanding Debt is 3.6 Years
$27.4M $200
$250 Debt Available Outstanding
$35M
$150M Acquisition
$200 Facility
$150 $125.6M
Term Loan
$150
$281 M $84.7M
$89.7M
$218.6M Term Loan
$100 Term Loan
$100 No debt maturities
$68.6M
until late 2024.
$50 Term Loan
Well-laddered
maturity schedule. $35M
$0 $50 LOC
$0
2022 2023 2024 2025 2026 2027
CAD2 Payout Ratio 2017-2021 Average
CTT 77%
RYN 77%
WY 91%
PCH 76%3
Source: 2021 Company filings.
STRONG BALANCE SHEET, SOLID CAPITAL POSITION, AMPLE LIQUIDITY
1. As of 3/31/2022.
2. See definition of Cash Available for Distributions (CAD), a non-GAAP measure, in Appendix. See Appendix for our reconciliation of cash provided by operating activities to CAD.
3. Excludes special dividend made related to the Potlatch Deltic merger to satisfy distribution requirements under the REIT rules. 37CAPITAL STRATEGY
CatchMark seeks to maintain balance sheet flexibility for opportunistic investment and to manage through
potential revenue volatility with an aim to lower overall leverage in the near-term.
Credit Metrics
Capital Allocation Priorities
Fixed charge coverage ratio1 5.0x
• Maintaining healthy liquidity and ample working
capital Net Debt2/Adjusted EBITDA3,4 5.3x
Net Debt2/Enterprise value5 40%
• Maintain stable, attractive debt profile
Weighted average cost of debt6 2.95%
• Identifying strategic acquisitions and
Interest rate mix7 Fixed: 92% / Floating: 8%
environmentally-focused income opportunities
• Deliver fully-covered quarterly dividends
Net Debt-to-Adjusted EBITDA
• Opportunistically make share repurchases
Reduced leverage by $260M or 45%
since Triple T and Bandon initial investments
12.0
Capital Sources $129M of Direct
Acquisitions Capital Recycling of $105M
$200M paired with $90M of Direct
• Competitive and flexible debt; utilize active interest 10.0 Triple T Acquisitions and $3M
rate risk management strategy to target the mix of Investment of Share Repurchases
fixed and floating borrowings
8.0 7.8x
• Public sale of stock or other securities
• Tax-advantaged UPREIT partnership units 6.0 Capital
Recycling of 5.3x
$20.9M.
• Partnerships to access private equity Capital Recycling
4.0 Public Equity Raises of $129M of $25.4M and full
• Redeploy capital recycling proceeds into higher- paired with $72M of Direct year of asset
Acquisitions management fees Bandon and
yielding timberlands fitting strategic objectives 2.0 from Triple T. Oglethorpe capital
recycling dispositions
and Triple T exit
0.0
Q1 16 Q3 16 Q1 17 Q3 17 Q1 18 Q3 18 Q1 19 Q3 19 Q1 20 Q3 20 Q1 21 Q3 21 Q1 22
1. Calculated using trailing twelve-month Adjusted EBITDA divided by trailing twelve-month cash paid for interest 4. Adjusted EBITDA is a non-GAAP measure. See page 53 for the reconciliation of net income (loss) to Adjusted
as of 3/31/2022. This calculation differs from the calculation of the fixed charge ratio covenant under our credit EBITDA.
facilities and should not be viewed as an indication of compliance with such covenant. 5. Enterprise value is based on equity market capitalization as of 3/31/2022 plus net debt.
2. Net debt equals outstanding borrowings net of cash on hand as of 3/31/2022. 6. After consideration of effects of interest rate swaps and patronage refund as of 3/31/2022. 38
3. Trailing twelve-month Adjusted EBITDA as of 3/31/2022. 7. As of 3/31/2022.COMMITMENT TO ESG BEST PRACTICES
39OUR COMMITMENT TO ESG BEST PRACTICES
We have outlined the following core principles that underscore CatchMark’s dedication to ESG:
1. Adhere to environmental, social, health and safety laws, regulations
and standards.
2. Promote environmental protection, enhance biodiversity and
conservation and meet the highest standards in forestry, measured
through forest certification.
3. Respect and promote human rights in accordance with the UN
Guiding Principles on Business and Human Rights across our
operations and the communities where we operate.
4. Provide and maintain a safe and healthy workplace for all workers
(including vendors, contractors, temporary employees and
volunteers) as well as customers, visitors and members of the public.
5. Promote the long-term interests of shareholders through
comprehensive corporate governance practices including risk
management/oversight; code of ethics; strict compliance with anti-
corruption and bribery regulations and other applicable laws and
regulations.
6. Engage in public initiatives that promote sustainability, especially
those addressing climate change.
7. Promote ESG awareness among employees, contractors and
throughout the supply chain.
8. Regularly communicate ESG performance and progress to
stakeholders.
40ESG AMBITIONS
ENVIRONMENTAL • Continue to maintain 100% SFI (or other third party) certifications
on all timberlands
• Enhance processes to track, report and benchmark environmental data
• Undertake climate change scenario analysis
• Further evaluate other environmentally-friendly uses of our timberlands,
i.e., carbon sequestration, wetlands mitigation banking, and solar projects
• Expand environmental due diligence on all new acquisitions
SOCIAL
• Proactively engage with communities where we operate
• Enhance contractor safety protocols and incident tracking
• Encourage increased participation in charitable matching and employee
volunteer programs
• Enhance and formalize professional development opportunities
for employees
GOVERNANCE
• Expand materiality assessment to include third-party input
• Advance Enterprise Risk Assessment (ERA) system and reporting
• Formalize training programs for employees and contractors with
respect to our Code of Business Conduct and Ethics, ESG and
Diversity and Inclusion
• Recognize and commit to applicable UN Sustainable Development Goals
• Expand ongoing framework and guidelines for ESG reporting
41RESPONSIBLE ENVIRONMENTAL STEWARDSHIP
Conscientious forest management serves investors by promoting a healthier environment and enhancing the
potential market value of our timberland assets.
FOREST CERTIFICATIONS
All of our timberlands have been third-party audited and certified in
100% 8M+
accordance with Sustainable Forestry Initiative® (“SFI”) standards.1
WILDLIFE
CatchMark is committed to providing a diverse range of habitats that benefit
ALL OUR FEE TIMBERLANDS WE PLANTED MORE THAN a variety of wildlife species within the context of intensive forest
ARE CERTIFIED SUSTAINABLE 8 MILLION TREES IN 2021 management.
BY THE SUSTAINABLE FOREST
INITIATIVE® SOIL
Our objective is to practice state-of-the-art forest management by deploying
silvicultural treatments in a site-specific fashion to reduce soil limitations to
tree growth and at the same time, take deliberate efforts to protect the soil
from damage.
WATER
Forests and watersheds play a critical role in capturing, storing and filtering
water used by people and wildlife. We adhere to all regulatory requirements
4:1 65M+
and deploy best practices to protect the water in our forests.
CLIMATE CHANGE
In our evaluation of climate change, we consider the positive impact that
FOR EVERY TREE WE SINCE 2013, WE’VE PLANTED forests have in capturing carbon, intercepting water, and stabilizing soils,
HARVEST, MORE THAN thereby mitigating negative effects on the environment. We do, however,
WE PLANT FOUR SEEDLINGS1 65 MILLION TREES also recognize the risks to society and CatchMark from the effects of climate
change and are deliberately taking steps to mitigate those risks.
CONTRACTOR TRAINING AND CERTIFICATION
All third-party forestry contractors are required to be trained in the
appropriate Best Management Practices for logging, road building,
chemical, fertilization and tree planting activities.
* SFI Re-certification Audit (2021) 42
1. Excludes trees harvested in thinning operations.CATCHMARK’S FORESTS:
A POSITIVE IMPACT TOWARDS CLIMATE SOLUTIONS
43CATCHMARK’S POSITIVE NET CARBON IMPACT - 2020
=
TOTAL NET CARBON SEQUESTERED (MtCO2e/year)
1.15 Million
CO2 EMISSIONS FROM1: GREENHOUSE GAS EMISSIONS FROM1:
More than 129.8M 250,977 passenger
gallons of gasoline vehicles driven for one year.
or
consumed.
2.9M miles driven by an
1.27M+ pounds of coal average passenger vehicle.
burned
All data as of 12/31/2020. Extracted from CatchMark 2020 Carbon Report. 44
1. Source: U.S. EPA Greenhouse Gas Equivalencies Calculator. https://www.epa.gov/energy/greenhouse-gas-equivalencies-calculatorSOCIAL RESPONSIBILITY
CatchMark considers the impact of our operations on the well-being of employees, contractors, suppliers and
the communities in which we operate. We also focus on ensuring a safe and healthy workplace and doing
business in accordance with UN Guiding Principles on Business and Human Rights.
50% 57% 24%
Executive All of Our Employees are
Officers Employees Members of an Ethnic
or Racial Minority
are WOMEN
16 Hours 9.7%
Average Annual
Low Average
Training/Education
Employee Turnover
per Employee
OUR EFFORTS AND POLICIES AIM TO PROVIDE QUALITY BENEFITS AND DEVELOPMENT, A WORK ENVIRONMENT OF DIVERSITY AND
INCLUSION, AND WAYS TO GIVE BACK IN LOCAL COMMUNITIES WHERE WE OPERATE
45
As of or for the year ended 12/31/2021.GOVERNANCE BEST PRACTICES
CatchMark’s corporate governance policies promote the long-term interests of shareholders. Accountability,
integrity and trust are paramount at CatchMark. In addition, our overall approach to risk management
preserves our business value and enables us to deliver results to our stakeholders.
Highlights of Corporate Governance Framework
̶ Annual election of all directors ̶ Stockholders have right to amend bylaws
̶ Average director tenure of 4.5 years1 ̶ Independent director stock ownership guidelines
̶ Majority voting with plurality carve-out for ̶ Board diversity policy
contested elections
̶ Regular executive sessions of independent
̶ Risk oversight by the Board and Committees directors
̶ Five of six directors are independent ̶ Director continuing education policy
̶ Annual Board and Committee self-evaluations ̶ Related person transactions policy
̶ Separate independent Chairman and CEO ̶ All directors attended at least 75% of 2021 meetings
̶ No supermajority voting ̶ Annual say-on-pay advisory votes
̶ Anti-hedging and anti-pledging policy ̶ Stockholder engagement
̶ No stockholder rights plan
̶ Executive officer stock ownership guidelines
ACCOUNTABILITY, INTEGRITY AND TRUST ARE PARAMOUNT AT CATCHMARK
For the year ended 12/31/2021 unless otherwise noted. 46
1. As of April 2022.SUMMARY
47THREE PILLAR BUSINESS MODEL
CatchMark (NYSE: CTT) invests in prime timberlands located in the nation’s leading mill markets, seeking to
capture the highest value per acre and to generate sustainable yields through disciplined management and
superior stewardship of its exceptional resources.
PRIME HIGH-DEMAND SUPERIOR
TIMBERLANDS MILL MARKETS STEWARDSHIP
Optimizing results through
Expanding acquisition activity disciplined management, which
Acquiring and owning prime
and harvest operations in historically has produced
timberlands through prudent
leading mill markets in the U.S. industry-leading productivity on
and disciplined allocation of
South, the nation’s premier a per-acre basis, and the value
capital
timber basket realization of environmental
initiatives
STRATEGIC FOCUS DRIVES STABLE AND PREDICTABLE CASH FLOW
48HIGHLY EXPERIENCED MANAGEMENT TEAM
CatchMark’s seasoned leadership provides significant industry experience and capability to help realize
company objectives and growth plan.
Brian M. Davis, Chief Executive Officer and President Todd Reitz, Chief Resources Officer
• More than 25 years of experience in business and financial • More than 20 years in the timber industry
services, and has held key roles in finance, treasury, and strategy. • Atlantic South Regional Marketing Manager for Weyerhaeuser
• Senior Vice President and Chief Financial Officer of Wells with operational oversite for all log and pulpwood production
Timberland from East Alabama to Virginia
• Various finance roles with SunTrust Bank and CoBank, delivering • Previous roles with Weyerhaeuser, Plum Creek and Stone
capital market solutions – advisory, capital raising, and financial Container Corporation – extensive marketing, harvesting,
risk management to public and private companies. silviculture and business development experience across the U.S.
South from East Texas to Virginia.
Ursula Godoy-Arbelaez, Chief Financial Officer Lesley H. Solomon, General Counsel and Corporate Secretary
• 20 years of experience in treasury, finance, risk management and • Over 20 years experience in REIT industry
accounting with a focus on the timber and real estate industry. • Former partner with Alston & Bird
• Previously company’s Vice President and Treasurer, focusing on • Experience representing public and private companies and
strategic planning, establishing and implementing company goals investment banks in equity and debt financings and mergers and
and objectives. acquisitions with a focus on real estate investment trusts and
• Past senior financial and accounting roles at the company’s financial institutions.
predecessors, Wells Timberland Management Organization (Wells • Specialist in public company compliance with SEC regulations,
TIMO) and Wells Real Estate Funds, as well as Deloitte & Touche, stock exchange policies, Dodd-Frank and Sarbanes-Oxley
LLP. requirements.
Glen F. Smith
Donald L. Warden
John D. Capriotti Chief Accounting Officer
Vice President, Real Estate
Vice President, Acquisitions Vice President and
and Alternative Income
Assistant Secretary
49APPENDIX
50DEFINITIONS OF NON-GAAP MEASURES
Adjusted EBITDA: Earnings before Interest, Taxes, Depletion, and Amortization (“EBITDA”) is a non-GAAP measure of operating performance. EBITDA is defined by
the SEC however, we have excluded certain other expenses which we believe are not indicative of the ongoing operating results of our timberland portfolio, and we
refer to this measure as Adjusted EBITDA. As such, our Adjusted EBITDA may not be comparable to similarly titled measures reported by other companies and
should not be considered in isolation or as an alternative to, or substitute for net income, cash from operations, or other financial statement data presented in our
consolidated financial statements as indicators of our operating performance. Due to the significant amount of timber assets subject to depletion, significant
income (losses) from unconsolidated joint ventures based on HLBV, and the significant amount of financing subject to interest and amortization expense,
management considers Adjusted EBITDA to be an important measure of our financial performance. Adjusted EBITDA has limitations as an analytical tool and should
not be considered in isolation or as a substitute for analysis of our results as reported under U.S. GAAP. Some of the limitations are:
‒ Adjusted EBITDA does not reflect our capital expenditures, or our future requirements for capital expenditures;
‒ Adjusted EBITDA does not reflect changes in, or our interest expense or the cash requirements necessary to service interest or principal payments on, our debt;
and
‒ Although depletion is a non-cash charge, we will incur expenses to replace the timber being depleted in the future, and Adjusted EBITDA does not reflect all
cash requirements for such expenses.
‒ Although HLBV income and losses are primarily hypothetical and non-cash in nature, Adjusted EBITDA does not reflect cash income or losses from
unconsolidated joint ventures for which we use the HLBV method of accounting to determine our equity in earnings.
‒ Adjusted EBITDA does not reflect the cash requirements necessary to fund post-employment benefits or transaction costs related to acquisitions, investments,
joint ventures or new business initiatives, which may be substantial.
Due to these limitations, Adjusted EBITDA should not be considered as a measure of discretionary cash available to us to invest in the growth of our business. Our
credit agreement contains a minimum debt service coverage ratio based, in part, on Adjusted EBITDA since this measure is representative of adjusted income
available for interest payments.
Cash Available for Distribution (CAD): Cash provided by operating activities adjusted for capital expenditures (excluding timberland acquisitions), working capital
changes, cash distributions from unconsolidated joint ventures and certain cash expenditures that management believes do not directly reflect the core business
operations of our timberland portfolio on an on-going basis, including costs required to be expensed by GAAP related to acquisitions, transactions, joint ventures or
new business activities.
512022 OUTLOOK
COMPANY GUIDANCE 2022 Guidance
Harvest volume (‘000 tons) 1,600 - 1,800
Sawtimber mix 45% - 50%
Land sales (‘000) $15,000 - $17,000
Asset management fees (‘000) $2,000
Net income (loss) (‘000) $(5,000) - $(7,000)
Adjusted EBITDA (‘000)1 $35,000 - $41,000
All numbers shown in thousands.
1. Adjusted EBITDA is a non-GAAP measure. See Appendix for our reconciliation to net income (loss).
52RECONCILIATION OF NET INCOME (LOSS) TO ADJUSTED EBITDA
(in thousands) TTM as of
3/31/2022 2021 2020 2019 2018 2017 2022 Guidance
Net income (loss) $62,138 $58,403 $(17,538) $(93,321) $(122,007) $(13,510) $(5,000) - (7,000)
Add:
Depletion 20,153 23,729 29,112 28,064 25,912 29,035 15,000 – 17,000
Interest expense1 10,001 10,232 12,070 17,058 13,643 10,093 10,000
Amortization1 2,411 2,622 3,255 1,786 2,821 1,270 2,000
Income tax expense (benefit) 675 675 658 (1,127) — — —
Depletion, amortization, and basis of
timberland and mitigation credits sold
103 126 151 3,823 4,195 865 —
included in loss from unconsolidated joint
ventures2
Basis of timberland sold, lease terminations
11,399 9,325 13,606 14,964 13,053 10,112 12,000 - 14,000
and others3
Stock-based compensation expense 3,136 2,904 3,836 2,790 2,689 2,786 3,000
(Gain) loss from large dispositions4 (24,208) (24,208) (1,274) (7,961) 390 — —
HLBV loss from unconsolidated joint
— — 5,000 90,450 109,550 — —
ventures5
Gain on sale of unconsolidated joint venture
(35,000) (35,000) — — — — —
interests
Post-employment benefits6 33 41 2,324 — — — —
Other7 475 558 865 380 (460) 1,319 —
Adjusted EBITDA $51,316 $49,407 $52,065 $56,906 $49,786 $41,970 $35,000 – 41,000
Debt $300,000 $300,000 $442,705 $458,555 $478,619 $337,619
Cash 27,395 22,963 11,924 11,487 5,614 7,805
Net Debt $272,605 $277,037 $430,781 $447,068 $473,005 $329,814
Net Debt to Adjusted EBITDA 5.3x 5.6x 8.3x 7.9x 9.5x 7.9x
1. For the purpose of the above reconciliation, amortization includes amortization of deferred financing costs, amortization of operating lease assets and liabilities, amortization of intangible lease assets, and amortization of
mainline road costs, which are included in either interest expense, land rent expense, or other operating expenses in the accompanying consolidated statements of operations.
2. Reflects our share of depletion, amortization, and basis of timberland and mitigation credits sold of the unconsolidated Dawsonville Bluffs joint venture.
3. Includes non-cash basis of timber and timberland assets written-off related to timberland sold, terminations of timberland leases and casualty losses.
4. Large dispositions are sales of blocks of timberland properties in one or several transactions with the objective to generate proceeds to fund capital allocation priorities. Large dispositions may or may not have a higher or
better use than timber production or result in a price premium above the land’s timber production value. Such dispositions are infrequent in nature, are not part of core operations, and would cause material variances in
comparative results if not reported separately.
5. Reflects HLBV (income) losses from the Triple T joint venture, which is determined based on a hypothetical liquidation of the underlying joint venture at book value as of the reporting date.
6. Reflects one-time, non-recurring post-employment benefits associated with the retirement of our former CEO, including severance pay, payroll taxes, professional fees, and accrued dividend equivalents paid in installments over
agreed-upon periods of time.
7. Includes certain cash expenses paid, or reimbursement received, that management believes do not directly reflect the core business operations of our timberland portfolio on an on-going basis, including post-employment
benefits and costs required to be expensed by GAAP related to acquisitions, transactions, joint ventures or new business initiatives. 53ADJUSTED EBITDA BY SEGMENT
(in thousands) 2021 2020 2019 2018 2017
Timber sales $72,467 $72,344 $72,557 $69,455 $71,353
Other revenue 4,129 4,120 4,632 5,279 5,066
(-) Contract logging and hauling costs (30,172) (30,103) (31,129) (31,469) (31,108)
(-) Forestry management expenses (6,982) (6,892) (6,691) (6,283) (6,758)
(-) Land rent expense (292) (447) (524) (660) (621)
(-) Other operating expenses (6,006) (7,577) (6,460) (6,303) (5,264)
(+) Other1 1,037 2,745 1,285 1,172 1,187
Harvest EBITDA $34,181 $34,190 $33,670 $31,191 $33,855
Timberland sales $14,090 $15,642 $17,572 $17,520 $14,768
(-) Cost of timberland sales (9,664) (12,290) (15,067) (13,512) (10,423)
(+) Basis of timberland sold 8,929 11,396 14,054 12,380 9,890
Real Estate EBITDA $13,355 $14,748 $16,559 $16,388 $14,235
Asset Management Fees $11,475 $12,184 $11,948 $5,603 $108
Unconsolidated Joint Venture EBITDA 809 425 4,801 6,828 2,003
Investment Management EBITDA $12,284 $12,609 $16,749 $12,431 $2,111
Total Operating EBITDA $59,820 $61,547 $66,978 $60,010 $50,201
(-) General and administrative expense $(13,452) $(16,225) $(13,300) $(12,425) $(11,660)
(+) Stock-based compensation 2,372 3,419 2,527 2,356 1,956
(+) Interest Income 2 51 204 262 113
(+) Post-employment benefits 41 2,324 - - -
(+) Other1 624 949 497 (417) 1,360
Corporate EBITDA $(10,413) $(9,482) $(10,072) $(10,224) $(8,231)
Adjusted EBITDA $49,407 $52,065 $56,906 $49,786 $41,970
1. Other includes (a) non-cash items: amortization, depreciation, stock-based compensation, casualty loss, and other timber asset basis removed; and (b) certain cash expenses that management believes do not directly reflect 54
the core business operations of our timberland portfolio on an on-going basis, including costs required to be expensed by GAAP related to acquisitions, transactions, joint ventures or new business activities.CASH AVAILABLE FOR DISTRIBUTION (in thousands, except for per-share data) 2021 2020 2019 2018 2017 Cash Provided by Operating Activities $47,169 $40,455 $32,942 $29,796 $27,419 Capital expenditures (excluding timberland acquisitions) (4,908) (5,527) (4,178) (4,571) (5,617) Working capital change (3,152) 528 2,817 3,751 1,136 Distributions from unconsolidated joint ventures 157 455 3,830 4,744 - Post-employment benefits 41 2,324 Interest paid under swaps with other-than-insignificant financing element (5,772) (4,328) (115) - - Other 558 865 381 (460) 1,319 Cash Available for Distribution1 $34,093 $34,772 $35,677 $33,260 $24,257 Adjusted EBITDA2 $49,407 $52,065 $56,906 $49,786 $41,970 Interest paid (10,232) (12,070) (17,058) (13,643) (10,093) Capital expenditures (excluding timberland acquisitions) (4,908) (5,527) (4,178) (4,571) (5,617) Income taxes paid (205) - - - - Distributions from unconsolidated joint ventures 840 729 4,808 8,516 - Adjusted EBITDA from unconsolidated joint ventures (809) (425) (4,801) (6,828) (2,003) Cash Available for Distribution1 $34,093 $34,772 $35,677 $33,260 $24,257 Dividends paid $23,326 $26,263 $26,269 $25,601 $21,349 Weighted-average shares outstanding, end of period 48,420 48,816 49,038 47,937 39,751 Dividends per Share $0.48 $0.54 $0.54 $0.54 $0.54 Cash from Operating Activities Payout Ratio3 49% 65% 80% 86% 78% CAD Payout Ratio4 68% 76% 74% 77% 88% 1. Cash Available for Distribution is a non-GAAP measure. See Appendix for our definition of Cash Available for Distribution. 2. Adjusted EBITDA is a non-GAAP measure. See Appendix for our definition of Adjusted EBITDA and reconciliation of net income (loss) to Adjusted EBITDA. 3. Calculated as dividends paid divided by cash provided by operating activities. 55 4. Calculated as dividends paid divided by cash available for distribution.
You can also read