Financial Overview & Path to Creating Value in Colombia Value Creation & Ecuador - October 2021 - Gran Tierra Energy
←
→
Page content transcription
If your browser does not render page correctly, please read the page content below

Financial Overview
Creating Value     & Path to
               in Colombia
Value Creation
& Ecuador
October 2021

                               1
General Advisory                                                                                              performance and production, liquidity and access to capital, future plans when oil prices increase, the
                                                                                                              Company’s strategies and results thereof, the Company’s operations including planned operations, the
The information contained in this presentation does not purport to be all-inclusive or contain all            use and the benefits of government programs, the Company’s expectations regarding its
information that readers may require. You are encouraged to conduct your own analysis and review of           environmental, social and governance program, the impact of the COVID-19 pandemic, disruptions to
Gran Tierra Energy Inc. (“Gran Tierra”, “GTE”, or the “Company”) and of the information contained in          operations and the decline in industry conditions. Statements relating to “reserves” are also deemed to
this presentation. Without limitation, you should read the entire record of publicly filed documents          be forward-looking statements, as they involve the implied assessment, based on certain estimates and
relating to the Company, consider the advice of your financial, legal, accounting, tax and other              assumptions, including that the reserves described can be profitably produced in the future.
professional advisors and such other factors you consider appropriate in investigating and analyzing
the Company. You should rely only on the information provided by the Company and not rely on parts            Among the important factors that could cause actual results to differ materially from those indicated by
of that information to the exclusion of others. The Company has not authorized anyone to provide you          the forward-looking statements in this presentation are: the continued impact of the COVID-19
with additional or different information, and any such information, including statements in media articles    pandemic and the procedures imposed by governments in response thereto; disruptions to local
about Gran Tierra, should not be relied upon. No representation or warranty, express or implied, is           operations; the decline and volatility in oil and gas industry conditions and commodity prices; the
made by Gran Tierra as to the accuracy or completeness of the information contained in this document,         actions of OPEC and non-OPEC countries; prices and markets for oil and natural gas are unpredictable
and nothing contained in this presentation is, or shall be relied upon as, a promise or representation by     and volatile; the accuracy of productive capacity of any particular field; the timing and impact of any
Gran Tierra.                                                                                                  resumption of operations; Gran Tierra’s operations are located in South America and unexpected
                                                                                                              problems can arise due to guerilla activity or local blockades or protests; technical difficulties and
An investment in the securities of Gran Tierra is speculative and involves a high degree of risk that         operational difficulties may arise which impact the production, transport or sale of our products;
should be considered by potential purchasers. Gran Tierra’s business is subject to the risks normally         geographic, political and weather conditions can impact the production, transport or sale of our
encountered in the oil and gas industry and, more specifically, certain other risks that are associated       products; the ability of Gran Tierra to execute its business plan and realize expected benefits from
with Gran Tierra’s operations and current stage of development. An investment in the Company’s                current initiatives (including a reduction of the capital program); the risk that unexpected delays and
securities is suitable only for those purchasers who are willing to risk a loss of some or all of their       difficulties in developing currently owned properties may occur; the ability to replace reserves and
investment and who can afford to lose some or all of their investment. You should carefully consider the      production and develop and manage reserves on an economically viable basis; the accuracy of testing
risks described under the heading “Risk Factors” and elsewhere in the Company’s Annual Report on              and production results and seismic data, pricing and cost estimates (including with respect to
Form 10-K for the year ended December 31, 2020 and in the Company’s other SEC filings available at            commodity pricing and exchange rates); the risk profile of planned exploration activities; the effects of
www.grantierra.com.                                                                                           drilling down-dip; the effects of waterflood and multi-stage fracture stimulation operations; the extent
In this presentation, unless otherwise indicated, all dollar amounts are expressed in US dollars and all      and effect of delivery disruptions, equipment performance and costs; actions by third parties; the timely
production and reserves are working interest before royalties (“WI”). Please see the appendices to this       receipt of regulatory or other required approvals for our operating activities; the failure of exploratory
presentation for important advisories relating to the Company’s presentation of oil and gas information,      drilling to result in commercial wells; unexpected delays due to the limited availability of drilling
oil and gas activities and financial information, including the presentation of non-GAAP measures.            equipment and personnel; the risk that current global economic and credit market conditions may
                                                                                                              impact oil prices and oil consumption more than Gran Tierra currently predicts, which could cause Gran
Forward-Looking Information Cautionary Advisory                                                               Tierra to further modify its strategy and capital spending program; volatility or declines in the trading
                                                                                                              price of our common stock or bonds; the risk that Gran Tierra does not receive the anticipated benefits
This presentation contains opinions, forecasts, projections, and other statements about future events or
                                                                                                              of government programs, including government tax refunds; Gran Tierra’s ability to comply with
results that constitute forward-looking statements within the meaning of the United States Private
                                                                                                              financial covenants in its credit agreement and indentures and make borrowings under its credit
Securities Litigation Reform Act of 1995, Section 27A of the Securities Act of 1933, as amended, and
                                                                                                              agreement; and the risk factors detailed from time to time in Gran Tierra’s periodic reports filed with the
Section 21E of the Securities Exchange Act of 1934, as amended, and financial outlook and forward
                                                                                                              Securities and Exchange Commission, including, without limitation, under the caption "Risk Factors" in
looking information within the meaning of applicable Canadian securities laws (collectively, “forward-
                                                                                                              Gran Tierra’s Annual Report on Form 10-K for the year ended December 31, 2020, many of which are
looking statements”). All statements other than statements of historical facts included in this
                                                                                                              beyond the Company’s control. These filings are available on the SEC website at http://www.sec.gov
presentation regarding our financial position, estimated quantities and net present value of reserves,
                                                                                                              and on SEDAR at www.sedar.com. Although the current guidance, capital spending program and long
business strategy, plans and objectives for future operations, capital spending plans and those
                                                                                                              term strategy of Gran Tierra are based upon the current expectations of the management of Gran
statements preceded by, followed by or that otherwise include the words “believe,” “expect,”
                                                                                                              Tierra, should any one of a number of issues arise, Gran Tierra may find it necessary to alter its
“anticipate,” “forecast,” “budget,” “will,” “estimate,” “target,” “project,” “plan,” “should,” “guidance”,
                                                                                                              business strategy and/or capital spending program and there can be no assurance as at the date of this
"strives" or similar expressions are forward-looking statements. Such forward-looking statements
                                                                                                              presentation as to how those funds may be reallocated or strategy changed and how that would impact
include, but are not limited to, the Company's expectations regarding the Company’s guidance,
                                                                                                              Gran Tierra's results of operations and financial position. Forecasts and expectations that cover multi-
including future production, operating netback, EBITDA, free cash flow, and funds flow from operations,
                                                                                                              year time horizons or are associated with 2P reserves inherently involve increased risks and actual
its capital program, including the timing of its drilling and workover plan, the reduction in costs and the
                                                                                                              results may differ materially.
benefits of reduced capital spending and G&A expenses, the benefits of derivative transactions, well
Forward-Looking Information Cautionary Advisory (continued)
The forward-looking statements contained in this presentation are based on certain assumptions made
by Gran Tierra based on management's experience and other factors believed to be appropriate. Gran
Tierra believes these assumptions to be reasonable at this time, but the forward-looking statements are
subject to risk and uncertainties, many of which are beyond Gran Tierra's control, which may cause
actual results to differ materially from those implied or expressed by the forward looking statements. In
particular, the unprecedented nature of the current economic downturn, pandemic and industry decline
may make it particularly difficult to identify risks or predict the degree to which identified risks will impact
Gran Tierra's business and financial condition. All forward-looking statements are made as of the date
of this presentation and the fact that this presentation remains available does not constitute a
representation by Gran Tierra that Gran Tierra believes these forward-looking statements continue to
be true as of any subsequent date. Actual results may vary materially from the expected results
expressed in forward-looking statements. Gran Tierra disclaims any intention or obligation to update or
revise any forward-looking statements, whether as a result of new information, future events or
otherwise, except as expressly required by applicable law.
The estimates of future production, EBITDA, net cash provided by operating activities (described in this
presentation as “cash flow”), free cash flow, operating netback, net debt, total capital and certain
expenses or costs set forth in this presentation may be considered to be future-oriented financial
information or a financial outlook for the purposes of applicable Canadian securities laws. Financial
outlook and future-oriented financial information contained in this presentation about prospective
financial performance, financial position or cash flows are provided to give the reader a better
understanding of the potential future performance of the Company in certain areas and are based on
assumptions about future events, including economic conditions and proposed courses of action, based
on management’s assessment of the relevant information currently available, and to become available
in the future. In particular, this presentation contains projected operational and financial information and
development activity expectations for 2021. These projections contain forward-looking statements and
are based on a number of material assumptions and factors set out above. Actual results may differ
significantly from the projections presented herein. These projections may also be considered to
contain future-oriented financial information or a financial outlook. The actual results of Gran Tierra’s
operations for any period will likely vary from the amounts set forth in these projections, and such
variations may be material. See above for a discussion of the risks that could cause actual results to
vary. The future-oriented financial information and financial outlooks contained in this presentation have
been approved by management as of the date of this presentation. Readers are cautioned that any
such financial outlook and future-oriented financial information contained herein should not be used for
purposes other than those for which it is disclosed herein. The Company and its management believe
that the prospective operational and financial information has been prepared on a reasonable basis,
reflecting management’s best estimates and judgments, and represent, to the best of management’s
knowledge and opinion, the Company’s expected course of action. However, because this information
is highly subjective, it should not be relied on as necessarily indicative of future results.

GRAN TIERRA SNAPSHOT
                                   Independent international exploration and production
  100%                                 company with assets in Colombia & Ecuador
     Oil
                             2020 Reserves1                                                                           1P                                    2P                                    3P
                               MMBOE                                                                                   79                                  133                                   174
Diversified                    RLI (years)2                                                                            10                                    17                                    22
 High-quality
 asset base                    NPV10 BT (US $bn)                                                                     $1.2                                  $2.0                                  $2.6
                               NPV10 AT (US $bn)                                                                     $1.0                                  $1.6                                  $2.0

  +95%                         NAV10 BT/share (US$)                                                                 $1.15                                $3.25                                 $5.02

  Operated
  Production                                                                                                                                                                          Updated Budget
                 2021 Budget3                                                                                                   Previous Budget
                                                                                                                                                                                     (released July 2021)

                 Brent Oil Price ($/bbl)                                                                                                      61.00                                                69.00
    30                                                                                                                                                                                                                                                                                      GTE
   Blocks        Total Company Production (bopd)                                                                                    28,000-30,000                                        27,500-28,500
                 Operating                Netback4               ($ million)                                                               310-330                                              340-360                                                                                    NYSE AMEX
                 EBITDA4 ($ million)                                                                                                       255-275                                              265-285                                                                                       LSE
                                                                                                                                                                                                                                                                                              TSX
   2 MM          Cash Flow5 ($ million)                                                                                                    205-225                                              215-235
 Gross Acres
                 Total Capital ($ million)                                                                                                 130-150                                              130-150

                                          High quality conventional portfolio - 100% oil & over 95% operated
                1.   Based on shares outstanding at December 31, 2020 and GTE McDaniel December 31, 2020 Reserves Report. See appendix for McDaniel Brent oil price forecast.
                2.   Calculated using average Q4 2020 WI production of 21,907 BOEPD.                                                                                                                                                                                                                   4
                3.   See Gran Tierra guidance press release dated May 4, 2021 and Gran Tierra press release dated July 12, 2021 for more details and disclaimers.
                4.   Operating netback and earnings before interest, taxes and depletion, depreciation and accretion ("EBITDA") are non-GAAP measures and do not have a standardized meaning under GAAP. Refer to "Non-GAAP Measures" in the guidance press release dated July 12, 2021.
                5.   Cash flow” refers to line item “net cash provided by operating activities” under generally accepted accounting principles in the United States of America ("GAAP").
2021 – RETURNING TO FREE CASH FLOW

              Q2/2021 Financial                                                                                       Q2/2021 Operational                                                                                   On Track To Deliver Strong
               Achievements                                                                                             Achievements                                                                                              Results in 2021
                                                                                             •       Acordionero – continued cost reductions &
•   Laser Sharp Focus on Reducing Debt: credit                                                       record pace-setting wells                                                                                       •      Revised Guidance Due to Strong Brent
    facility continues to be paid down – during Q2/21 an                                                • Prudent reservoir management of the                                                                               Pricing
    additional $5 MM was repaid, lowering balance to                                                       waterflood has restored production,                                                                                 • 2021 Cash Flow1 of $215-235 MM
    $175 MM and cash & cash equivalents of $22 MM                                                          demonstrates effectiveness of waterflood                                                                            • 2021 Free Cash Flow1 of $75-95 MM
    (on June 30, 2021)                                                                                  • Average cost per well has decreased 38%                                                                              • H2/2021 Free Cash Flow1 of $100-120
                                                                                                           since 2019; pacesetter well of 10.9 days                                                                                MM
•   Significant & Structural Cost Reductions: cost                                                         (spud to on production, total cost of
    reductions achieved due to structural improvements                                                     $1.9MM)                                                                                                   •      Accelerated Debt Reduction Underway
    & reductions are expected to be maintained as oil                                                                                                                                                                         • GTE expects RBL to be paid down to a
    prices recover further:                                                                  •       Costayaco – drilling campaign compete                                                                                        balance of $60-80 MM by YE21
        • Operating expenses down 9% q-o-q                                                             • CYC 43 well on production; CYC 42 & CYC
        • This decrease is operating expenses was                                                          44 to start production August 2021.                                                                       •      Continue to optimize waterfloods & increase
            achieved mainly by lower power generation                                                                                                                                                                       recovery factors
            costs in Acordionero                                                             •       Moqueta & Suroriente – returning to activity
                                                                                                       • Workover program underway

                                  GTE is returning to growth and is on track to deliver strong results in 2021
                       1.   “Cash flow” refers to line item “net cash provided by operating activities” under generally accepted accounting principles in the United States of America ("GAAP"). Free cash flow is calculated based off of the midpoint of cash flow less the midpoint of capital. Free cash
                            flow is a non-GAAP measure and does not have a standardized meaning under GAAP and is defined as cash flow less projected 2021 capital spending. Refer to "Non-GAAP Measures" in the appendix. See Gran Tierra press release dated July 12, 2021 for more
                                                                                                                                                                                                                                                                                                               5
                            details and disclaimers.
NO NEAR-TERM MATURITIES, HEDGING PROGRAM IN PLACE
Maturity Profile & Debt Instruments
US$215MM Committed Credit Facility due $75
2022
- GTE currently in full compliance with all $300 $300
covenants & expects full compliance with
all applicable financial covenants
$140
US$300MM of 2025 Senior Notes
- Coupon of 6.25% p.a. 2020 2021 2022 2023 2024 2025 2026 2027
Draw (Oct. 08, 2021) Undrawn RBL Capacity USD bonds
US$300MM of 2027 Senior Notes
- Coupon of 7.75% p.a.
Brent Hedging Program
Type of Instrument Volume Sold Put Purchased Put Sold Call Swap Price
& Period1 (bopd) ($/bbl) 1 ($/bbl) 1 ($/bbl) 1 ($/bbl) 1
3-Ways: July 1, to December 31, 2021 7,000 47.14 57.14 68.95 n/a
Swaps: July 1, to December 31, 2021 3,000 n/a n/a n/a 56.75
No near-term maturities, hedging program expected to protect GTE against further oil price volatility
1. Weighted Average ICE Brent. 6
GTE UNIQUELY POSITIONED FOR VALUE CREATION

                                                                     World class
  Sustainable          Robust free cash         Disciplined
                                                                    development
business model               flow and             financial
                                                                     and low risk        Going Beyond
with significant       attractive returns    strategy; prudent
                                                                    exploration in        Compliance
value in booked           in supportive        discretionary
                                                                     four proven
 reserves base           fiscal regimes      capital programs
                                                                   onshore basins

                                                                                          Meaningful and
    1P reserves
                                                Focused on                              sustainable impact
  underpin value;      Returning to growth                          Extensive seismic
                                               balance sheet                                 within the
  clear path to 2P      in 2021, flexible,                            and well data
                                              protection, long-                         communities where
and 3P exploitation;    progressive fiscal                          across expansive
                                                 term value                             we operate, with a
     world class            regimes                                 acreage position
                                                preservation                            continued focus on
hydrocarbon basins
                                                                                         reducing emissions

                         Top-tier conventional assets in onshore world class basins
                                                                                                              7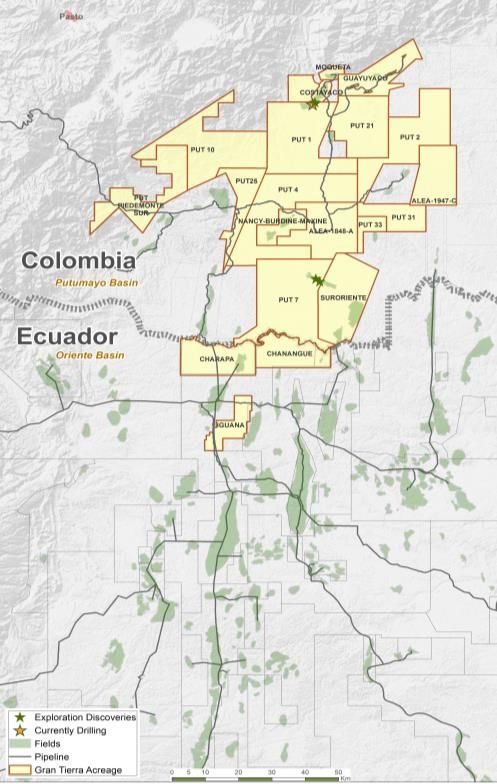
2021 KEY OBJECTIVES                                                                                                                                                                                                                       Continue to optimize waterfloods & increase recovery factors
                                                                                                                                                                                                                                           Increase reserves with minimal capital expenditures

                                                                                                                                             Updated Budget
2021 Budget 1                                                                   Previous Budget
                                                                                                                                                  (released July 2021)
                                                                                                                                                                                                                                             Direct free cash flow to debt reduction
Brent Oil Price ($/bbl)                                                                                 61.00                                                        69.00                                                                   Forecasted YE net debt4 to annualized Q4/21 EBITDA2 1.6-1.8x
Total Company Production (bopd)                                                                 28,000-30,000                                                27,500-28,500
Operating Netback2 ($ million)                                                                        310-330                                                      340-360
EBITDA2 ($ million)                                                                                   255-275                                                      265-285                                                                       Brent oil price with narrow Colombian oil differentials
Cash Flow3 ($ million)                                                                                205-225                                                      215-235                                                                       100% oil production
Total Capital ($ million)                                                                             130-150                                                      130-150
Free Cash Flow3 ($million)                                                                              65-75                                                        75-95
RBL Balance @ Dec.31/2021 ($ million)                                                                                70-90                                                        60-80                                                          Maintain sharp focus on costs
‘21 YE Net Debt4 to Ann.Q4/21 EBITDA2                                                                               1.9-2.1                                                      1.6-1.8                                                         Acordionero drill and complete costs below $2 MM per well
Number of Development Wells (gross)                                                                                  14-18                                                        14-18
                                                                                                                                             Updated Budget
                                                                                 Previous Budget
Expenses ($/bbl)                                                                                                                                  (released July 2021)

 Transportation and Quality Discount                                                                     8.00-10.00                                                 8.00-10.00
 Royalties                                                                                                8.00-9.00                                                11.00-13.00
Oil and Gas Sales Price ($/bbl)                                                                         42.00-44.00                                                47.00-49.00
 Operating Costs                                                                                        11.00-13.00                                                12.00-14.00
 Transportation (Pipeline)                                                                                0.90-1.10                                                  0.90-1.10
Operating Netback5 ($/bbl)                                                                              29.00-31.00                                                33.00-35.00
 General and Administrative                                                                               1.50-2.50                                                  1.50-2.50
 Interest and Financing                                                                                   4.50-5.00                                                  4.50-5.00
 Taxes                                                                                                         0.00                                                       0.00
                     1.   See Gran Tierra press release dated July 12, 2021 for more details and disclaimers.
                     2.
                     3.
                          Operating netback and earnings before interest, taxes and depletion, depreciation and accretion ("EBITDA") are non-GAAP measures and do not have a standardized meaning under GAAP. Refer to "Non-GAAP Measures" in the guidance press release dated May 4, 2021 and the press release dated July 12, 2021.
                          Cash flow” refers to line item “net cash provided by operating activities” under generally accepted accounting principles in the United States of America ("GAAP"). Free cash flow is calculated based off of the midpoint of cash flow less the midpoint of c apital. Free cash flow is a non-GAAP measure and does not have a standardized meaning under GAAP and is
                                                                                                                                                                                                                                                                                                                                                                                                   8
                          defined as cash flow less projected 2021 capital spending. Refer to "Non-GAAP Measures" in the appendix.
                     4.   "Net debt" is a non-GAAP measure and does not have a standardized meaning under GAAP. Refer to "Non-GAAP Measures" in the guidance press release dated July 12, 2021.
                     5.   Operating netback per bbl is a non-GAAP measure and does not have a standardized meaning under GAAP. Refer to "Non-GAAP Measures" in the press release dated July 12, 2021.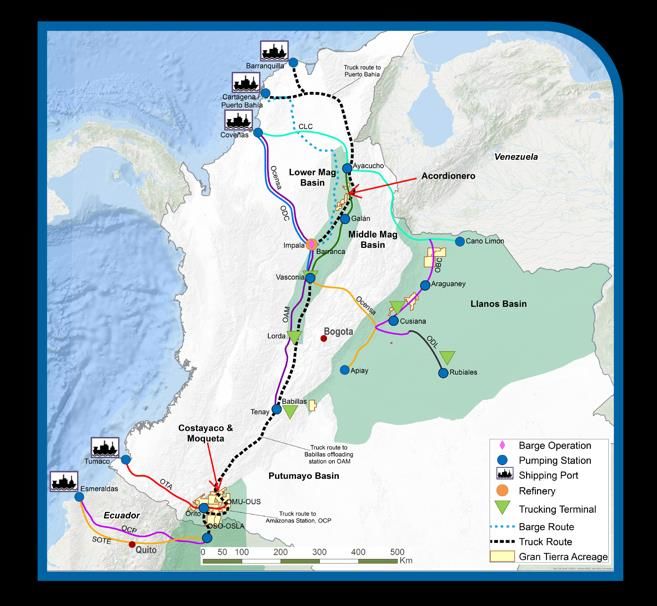
GRAN TIERRA’S FOCUSED STRATEGY

                             STRATEGY                                                       TACTICS
        Proven, Under-Explored Conventional                                          Apply Proven Technology
                        Hydrocarbon Basins                                           GTE has been able to reduce drilling
      World-class exploration program targeting large prospect                       times/costs by ~40%
        inventory across proven plays in Colombia & Ecuador

 Access to Established Infrastructure
  Large spare capacity in pipelines & trucking, leads to
   strong oil prices linked to Brent, short cycle times &
                                                                                              Focus On Balance
                          quick access to world markets                                       Sheet Protection
                                                                                               2021 capital program is a balanced,
                                                                                               returns-focused program, hedges in place,
Strong, Stable Economic Environment                                                            and significant reduction in operating and
Pro-Western governments that ensure contract sanctity,                                         G&A costs in 2020
  rule of law & encourage foreign direct investment and
                                 resource development
                                                                                     Maintain Flexibility & Control
               Highly Competitive Fiscal Regime                                      the Allocation of Capital
    Flexible, progressive fiscal regimes with sliding scale royalty                   95%+ operated asset base allows
          or contractor take that are among the best in the world                     disciplined capital allocation, pace setting

                    Colombia & Ecuador are an excellent fit for Gran Tierra’s strategy and tactical plan
                                                                                                                                     9
GTE’S CONTRIBUTION AS AN E&P COMPANY

    Maximize Value
    GTE’s mandate is to develop high
    value resource opportunities in
    order to deliver top-quartile returns

    Social Investments
    GTE aims to have a meaningful and
    sustainable impact through social
    investments within the communities
    near where it operates

    Continuous Improvement
    Continued focus on operational
    excellence, safety, and reduction of
    emissions

       Disciplined approach as an E&P company – strengthen, return, accelerate, reinvest
                                                                                           10
CAPITAL ALLOCATION PRINCIPLES & FRAMEWORK
Principles Framework
DISCIPLINED APPROACH TO • Fund growth program through internally generated cash flows
MANAGING LEVERAGE • Targeting 2022 net debt1 to EBITDA1 of under 1.5x
RETURNS DRIVEN CAPITAL • Investments target a minimum IRR of 20% (AT) full cycle
ALLOCATION • New investments must compete for capital against other
opportunities in our extensive portfolio
• Low capital requirements and low declines from high quality assets
GENERATE FREE CASH FLOW under waterflood are expected to generate significant free cash
flow over the next five years
GTE has a disciplined approach to maximizing shareholder returns and is focused on delivering sustainable free cash flow growth
1. "Net debt" and “EBITDA” are non-GAAP measure and do not have a standardized meaning under GAAP. Refer to "Non-GAAP Measures" in the appendix. 11HSE IS A KEY PRIORITY AT GTE
2020 Achievements 0.14 LTIF 0.35
TRIF
0.12
• GTE achieved its BEST SAFETY 0.3
RECORD, achieving its first year with an 0.1 0.25
Lost Time Incident Frequency (LTIF) of 0.08 0.2
zero, during which the Company logged 0.06 0.15
15 MM LTI-free person-hours 0.04 0.1
0.02 0.05
• Robust COVID-19 response included
0 0
medical, risk & quarantining controls 2016 2017 2018 2019 2020 2016 2017 2018 2019 2020
HSE is an integral part of GTE culture - continued focus on operational excellence, safety, and stakeholder returns
1. LTIF: Lost Time Incident Frequency. LTIF = ((Fatalities Cases + Lost Time Incident Cases) / Man Hours) x 200000 MH. 12
2. TRIF: Total Recordable Incident Frequency. TRIF = ((Fatalities Cases + Lost Time Incident Cases + Restricted Work Cases + Medical Treatment Cases) / Man Hours) x 200000 MH.ENVIRONMENTAL, SOCIAL, GOVERNANCE FACT SHEET
Environmental Social
Gran Tierra has committed to reforesting 1,000 Over 214,000 people participated & benefited from
hectares of land and securing and maintaining GTE’s social investment programs over past 3 years
18,000 hectares of forest through the
NaturAmazonas project Over 20,000 local labour opportunities have been
created by GTE over past 5 years
GTE has planted 838,740 trees and has conserved, Gran Tierra awarded over $39 million to local
preserved or reforested 1,624 hectares of land companies in 2020
For the last 5 years Gran Tierra has voluntarily
released an assessment of its greenhouse gas
Governance
emissions Gran Tierra has established clear policies and has a
specialized Board committee
Won first-place at the 2020 Latin America Green
Awards in the “Fauna” category for the 7 out of 8 board members are independent
"Amazon´s Honey" project
Gran Tierra is committed to transparent corporate
governance practices and discloses payments to
Safety Emissions governments (ESTMA)
In 2020, Gran Tierra had its BEST SAFETY Gran Tierra has taken corrective actions to lower GHG Gran Tierra offers Human Rights awareness and
RECORD, achieving its first year with a Lost Time emissions by reducing the flaring of natural gas through training for employees
Incident Frequency of zero major capital investments in voluntary “Gas-to-Power
projects” Gran Tierra promotes diversity throughout its
Gran Tierra implemented world-class COVID-19
Instead of flaring excess gas GTE converts gas into business and out of its 322 employees, 38% are
standards and prioritized the prevention of the
power at its fields, reducing flare volumes and the women, exceeding the industry average of 22%
spread of COVID-19
associated GHG emissions. The gas-to-power project
at Acordionero field, the company’s single biggest Won award for best gender equality and diversity
producing asset has decreased diesel fuel practices in the industry from the Ministry of Energy
consumption by 85% and National Hydrocarbons Agency in Colombia
Gran Tierra’s 2020 Sustainability Report can be accessed here: www.grantierra.com/ESG 13WATERFLOOD UPDATE
14WATERFLOODING – IMPROVED OIL RECOVERY
Waterflooding practiced since the 1920’s, widest practiced secondary recovery method
GTE utilizes waterflood technology in several key pools, improves recovery by:
– Displacing / sweeping oil towards producing wells
Typical Waterfloods Significantly Increase Production,
– Maintaining / increasing reservoir pressure Recovery Factors & Reserves2
Waterflood Oil Recovery Process Schematic1 Acordionero Cohembi Costayaco
Fill Up
& Moqueta
Start Injection
Increased pressure helps push oil to producing wells
Decline Period
Incline Period
Increasing PIP4
Gas collapse
BOPD
Secondary Oil
Primary Oil
% Waterflood Life
Waterflooding is a technique that can typically double ultimate recovery3
1. Source: SNF Floerger Oil & Gas – “Enhanced Oil Recovery”.
2. Copyright 1991, SPE, from JPT, October 1991. 15
3. https://www.spe.org/en/industry/increasing-hydrocarbon-recovery-factors/
4. PIP: Pump Intake Pressure.
Note: Third party studies presented not a guarantee of results of GTE’s waterflood efforts.WATERFLOODING – CANDIDATE SCREENING
All of Gran Tierra’s assets currently under waterflood greatly exceed success factors as per
Willhite’s waterflood screening criteria1
Asset Overview
Gran Tierra’s assets rank as world-class candidates for waterflooding
GRAN TIERRA ASSETS UNDER WATERFLOOD2
Factors Favourable for Waterflooding1 Acordionero Costayaco Moqueta Cohembi
Initial Oil Saturation > 40% 78% 86% 78% 90%
Oil-Zone Thickness > 15 ft 330 ft 114 ft 160 ft 125 ft
Permeability (Average) > 10 mD 750 mD 225 mD 275 mD 2,500 mD
Reservoir Depth > 1,000 ft 8,000 ft 8,400 ft 3,150 ft 9,100 ft
Viscosity < 15,000 cP 230 cP 1.5 cP 3.6 cP 28 cP
Gran Tierra’s asset characteristics are excellent for waterflooding
1. Willhite. Paul G. Waterflooding. SPE Textbook Series Volume 3. Society of Petroleum Engineers. Richardson, Texas. 1986, p. 112. 16
2. Based on GTE McDaniel December 31, 2020 Reserves Report.WATERFLOODING – MAXIMIZING FIELD RECOVERY1
Size of the bubble represents 2P OOIP in MMBOE under waterflood 2P Original Oil-In-Place2
(MMbbls)
100% 76
Costayaco
178
MM
75% Cohembi MQT 178
179 76 376
MM MM
Water Cut (%)
179
50%
Acordionero Cohembi
INCREASING WF
25% Costayaco Moqueta
Acordionero
376
MATURITY
CMP MM
0%
78
MM ~810 MMbbls 1
2P Original Oil-In-Place (OOIP)
0% 10% 20% 30% 40%
under waterflood in GTE’s four
Recovery Factor (%) biggest oil fields
Waterflood value creation is significant with material remaining recovery available
1. Based on GTE McDaniel December 31, 2020 Reserves Report. 17
2. Based on McDaniel 2P OOIP.COSTAYACO
60,000
WATERFLOOD PERFORMANCE - HISTORICAL
Oil Prod. Rate
Water Prod. Rate Current watercuts:
Production and Injection Rate (barrels per day)
Water Inj. Rate
1 ~25% ACR ~85% CYC
50,000 1P - GLJ YE2010
1 (early life flood ) (later life flood )
2P - GLJ YE2010
1
3P - GLJ YE2010
40,000
30,000 Started
injection
20,000
Waterflood Incremental
Above 1P YE2010 GLJ
10,000
0
Jan-07 Jan-08 Jan-09 Jan-10 Jan-11 Jan-12 Jan-13 Jan-14 Jan-15 Jan-16 Jan-17 Jan-18 Jan-19 Jan-20
2010 YE GLJ - Original Production to YE20
Recoverable (MMbbl) (MMbbl)1 Water injection through water flooding
1P 2P 3P YE20 (McDaniel)
moves 2P and 3P reserves to 1P
36.5 41.2 50.5 55.5
18
1. Based on GTE McDaniel December 31, 2020 Reserves Report.
2. See appendix for “Presentation of Oil & Gas Information” in respect of reserves information that is not as at December 31, 2020.ASSET OVERVIEW
192020 RESERVES1
ACORDIONERO COSTAYACO MOQUETA SURORIENTE
Reserves by Category Reserves by Category Reserves by Category Reserves by Category
100 25 14 12
12 10
80 20
23 10
81 12 8 11
60 15 8
66 18 10 6 9
40 10 12
6 8
4 6
39 4
20 5 2
2
0 0 0 0
1P 2P 3P 1P 2P 3P 1P 2P 3P 1P 2P 3P
(MMBOE) 1P 2P 3P (MMBOE) 1P 2P 3P (MMBOE) 1P 2P 3P (MMBOE) 1P 2P 3P
December 31, 2019 41 75 92 December 31, 2019 10 18 23 December 31, 2019 7 10 12 December 31, 2019 7 11 14
Production 4 4 4 Production 2 2 2 Production 1 1 1 Production 0.5 0.5 0.5
Additions 2 -5 -7 Additions 4 2 2 Additions 2 1 1 Additions -0.5 -2 -3
December 31, 2020 39 66 81 December 31, 2020 12 18 23 December 31, 2020 8 10 12 December 31, 2020 6 9 11
Change (5%) (12%) (12%) Change 20% 0% 0% Change 14% 0% 0% Change (14%) (18%) (21%)
• Achieved 133% PDP Reserves and 100% 1P Reserves Replacement
• Added 11.0 MMBOE of PDP Reserves and 8.3 MMBOE of 1P Reserves
• Realized Finding and Development Costs of $5.06/boe (PDP) and $2.65/boe (1P)
1. Based on GTE McDaniel December 31, 2020 Reserves Report. See appendix for McDaniel Brent oil price forecast.
20ACORDIONERO SNAPSHOT
Key Highlights
Asset Overview
• 100% WI Gran Tierra
• Since acquired in 2016, Acordionero has produced 24MMbbls &
generated ~$190MM of free cash flow (June 30, 2021)
• Increasing water injection has flattened production decline
• Improved reliability due to gas-to-power and increasing pool pressure
Reserves1 Summary PDP 1P 2P 3P
• 2P reserves of 66 MMBOE, 2P OOIP2 of 376 MMBBLS Dec 31, 2020
• Maximizing existing field recovery through execution of
MMBOE1 24 39 66 81
waterflood
OOIP2
357 357 376 395
(MMBBL)
2021 Activity Update
• A workover rig was deployed during Q3/21 to restore existing wells to Recovery
14.6% 18.4% 25.6% 29.6%
Factor (%)
production if they went offline
NPV10 (BT)
$489 $757 $1,205 $1,507
$MM
• Prudent reservoir management of the waterflood has restored
production to an average level of 14,427 BOPD in Q3/21; up 49% NPV10 (AT)
$470 $656 $966 $1,178
$MM
y-o-y
*All figures WI 21
1. Based on GTE McDaniel December 31, 2020 Reserves Report.
2. Based on McDaniel 2P OOIP.COSTAYACO SNAPSHOT
Key Highlights
Asset Overview
• 100% WI Gran Tierra
• Multiple, high-quality stacked reservoirs; oil concentrated in the T &
Kc sandstone reservoirs
• Sandstone light oil peripheral waterflood, carbonates light oil
development
• Favorable conditions for waterflood, mature asset, predictable
performance Summary PDP 1P 2P 3P
Dec 31, 2020
Reserves1
MMBOE1 8 12 18 23
• 2P reserves of 18 MMBOE
OOIP2
178 178 178 178
2021 Activity Update (MMBBL)
• 2021 infill development drilling campaign of 3 oil producers (CYC-42 Recovery
37.4% 38.4% 41.6% 44.7%
and CYC-43 wells drilled March and April; CYC-44 in late April 2021) Factor (%)
NPV10 (BT)
$87 $133 $236 $320
• All three wells started production in Q3/21; increased CYC’s average $MM
production to 6,292 BOPD during Q3/21, up 50% from 4,190 BOPD NPV10 (AT)
$78 $107 $176 $233
$MM
in Q1/21
*All figures WI 22
1. Based on GTE McDaniel December 31, 2020 Reserves Report.
2. Based on McDaniel 2P OOIP. Figures exclude A-Limestone.MOQUETA SNAPSHOT
Key Highlights
Asset Overview
• 100% WI Gran Tierra
• Multiple stacked reservoirs, highly structured, oil concentrated in
the T & Kc reservoirs
• Sandstone light oil waterflood development
Reserves1
• 2P reserves of 10 MMBOE
Summary PDP 1P 2P 3P
2021 Activity Update Dec 31, 2020
MMBOE1 3 8 10 12
• During Q3/21, Gran Tierra completed a budgeted workover
program that was designed to optimize Moqueta’s waterflood, OOIP2
76 76 76 76
(MMBBL)
which may potentially increase the field’s ultimate oil recovery
Recovery
25.8% 30.8% 33.5% 36.9%
Factor (%)
NPV10 (BT)
$35 $85 $110 $137
$MM
NPV10 (AT)
$35 $69 $86 $105
$MM
*All figures WI 23
1. Based on GTE McDaniel December 31, 2020 Reserves Report.
2. Based on McDaniel 2P OOIP.SURORIENTE SNAPSHOT
Key Highlights
Asset Overview
• 52% WI Gran Tierra, 48% Ecopetrol
• GTE became operator in March 2019
• Excellent waterflood response observed to date at the Cohembi field, with
potential to increase production through facility expansion, infill drilling, and
pump optimization
• Contract expires June 2024
Summary PDP 1P 2P 3P
Reserves1 Dec 31, 2020
• 2P reserves of 9 MMBOE
MMBOE1 3 6 9 11
2021 Activity Update OOIP2
223 223 223 223
• Cohembi: facility expansion program is progressing, which is expected to (MMBBL)
allow additional production to be brought online in Q4/21 Recovery
18.9% 21.5% 22.6% 23.4%
Factor (%)
• During Q3/21, a workover rig was deployed to run larger pumps in some oil NPV10 (BT)
$39 $94 $160 $203
well $MM
NPV10 (AT)
$39 $93 $157 $181
• Q3/21 average WI production was 3,513 BOPD, the highest average WI $MM
quarterly rate since Q4/19
*All figures WI 24
1. Based on GTE McDaniel December 31, 2020 Reserves Report.
2. Based on McDaniel 2P OOIP.TRANSPORTATION
25ACCESS TO EXISTING TRANSPORTATION INFRASTRUCTURE
Gran Tierra benefits from large spare capacity in
pipelines & trucking throughout Colombia & Ecuador,
which leads to:
✓ Strong oil prices linked to Brent
✓ Narrow oil price differentials
✓ Short cycle times
✓ Quick access to world markets through major export
terminals
Transportation Export Point
Truck + pipeline Esmereldas (Ecuador)
Putumayo
(Costayaco, Moqueta, Pipeline Tumaco (Colombia)
Others)
Truck + pipeline Coveñas (Colombia)
Truck or truck + barge Cartagena (Colombia)
Middle
Truck Barranquilla (Colombia)
Magdalena
(Acordionero, Others)
Truck + pipeline Coveñas (Colombia)
Gran Tierra benefits from significant oil takeaway capacity & no infrastructure bottlenecks
26EXPLORATION OVERVIEW
27HIGH IMPACT EXPLORATION PORTFOLIO
Putumayo & Oriente: Underexplored, Proven Basins
Colombia’s Putumayo basin is underexplored due to past above-ground security
issues, now mitigated by Peace Agreement
Same geology as Ecuador, where almost 6 billion bbls of oil produced1
• 7 times the area for seismic coverage1 in the Oriente
→ 3,100 km2 vs 20,600 km2
• 6 times higher well density
→ 90 wells/10,000km2 vs 529 wells/10,000km2
• 10 times more fields >20 MMBBL
→ 6 vs 60
Total Basin GTE
Cumulative Original 2P 2020 Net Land
Production1 Reserves1 Production2 Position
Basin1 (Bn bbls) (Bn bbls) (Kbbls/day) (MM acres)
Putumayo
0.5 0.7 19 1.0
Oriente 6.3 10 480 0.1
GTE has built a dominant position across the proven & high-potential Putumayo & Oriente Basins
1. IHS Edin. 28
2. Average January 2020 through October 2020 https://www.anh.gov.co/estadisticas-del-sector/sistemas-integrados-operaciones/estad%C3%ADsticas-producci%C3%B3n. Oriente average production January 2020
through December 2020 ARC/MERNNR.
3. Certain information in this slide may constitute "analogous information" as defined in NI 51-101. Refer to Appendix for "Presentation of Oil & Gas Information - Analogous Information."Financial
APPENDIX Overview & Path to
Value Creation
29MCDANIEL PRICE DECKS
Jan 1, 2021 Oil Price (US$/bbl) Brent Comparison (US$/bbl)
McDaniel, Jan 1 2021 McDaniel, Jan 1 2020
Brent WTI
85
85
80
80
75
75
70
70
65
65
60
60
55
55
50
50
45
45
40
40
2021 2022 2023 2024 2025 2026 2027 2028 2029 2030
2021 2022 2023 2024 2025 2026 2027 2028 2029 2030
1. As per McDaniel’s prices deck assumptions. 30GLOSSARY OF TERMS – NON GAAP
NON-GAAP TERMS
Operating netback: Oil and gas sales less operating and transportation expenses. Operating netback per boe as presented is
defined as oil and gas sales price less forecasts of transportation and quality discount, royalties, operating costs and pipeline
transportation from the Brent oil price forecast.
Funds flow from operations: is defined as net income or loss adjusted for DD&A expenses, asset impairment, goodwill impairment,
deferred tax expense or recovery, stock-based compensation expense, amortization of debt issuance costs, non-cash lease expense,
lease payments, unrealized foreign exchange gains or losses, financial instruments gains or losses, other non-cash losses, cash
settlement of financial instruments and other gains or losses.
EBITDA: Net income adjusted for DD&A expenses, interest expense and income tax expense or recovery.
Cash from operations (CFO): Cash provided by operating activities excluding the impact from operating working capital. Estimated
CFO assumes no operating working capital changes, and therefore CFO equals cash provided by operating activities.
Free cash flow (FCF): GAAP "net cash provided by operating activities" less projected capital spending. Management believes that
free cash flow is a useful supplemental measure for management and investors to in order to evaluate the financial sustainability of the
Company's business.
Net debt: Comprised of working capital surplus, senior notes (gross), and reserves-based credit facility (gross).
Reserve Life Index (RLI): means the reserves for the particular reserve category divided by annualized 2020 fourth quarter
production
These non-GAAP measures do not have a standardized meaning under GAAP. Investors are cautioned that these measures should not be
construed as an alternative to net income or loss or other measures of financial performance as determined in accordance with GAAP. Gran
Tierra's method of calculating these measures may differ from other companies and, accordingly, it may not be comparable to similar
measures used by other companies. These non-GAAP financial measures are presented along with the corresponding GAAP measure so
as to not imply that more emphasis should be placed on the non-GAAP measure.
31GLOSSARY OF TERMS – OIL & GAS
OIL & GAS TERMS
Barrel (bbl)
Barrels of oil per day (bopd)
Thousand cubic feet (Mcf)
Barrels of oil equivalent (BOE)
Barrels of oil equivalent per day (BOEPD)
Million barrels of oil equivalent (MMBOE)
Million barrels of oil (MMBBL)
Billion barrels of oil (BNBBL)
Net after royalty (NAR)
Net present value before tax (NPV BT)
Net present value after tax (NPV AT)
Internal rate of return (IRR)
32NON-GAAP MEASURES
EBITDA & Adjusted EBITDA
EBITDA, as presented, is defined as net income or loss adjusted for depletion, depreciation and accretion ("DD&A") expenses, interest expense and income tax expense or recovery. Adjusted EBITDA, as presented, is defined as EBITDA adjusted for asset
impairment, goodwill impairment, non-cash lease expense, lease payments, unrealized foreign exchange gains or losses, unrealized gains or losses on financial instruments, other gains or losses and stock based compensation expense. Management uses this
financial measure to analyze performance and income or loss generated by our principal business activities prior to the consideration of how non-cash items affect that income, and believes that this financial measure is also useful supplemental information for
investors to analyze performance and our financial results. Gran Tierra is unable to provide a quantitative reconciliation of forward-looking EBITDA to its most directly comparable forward-looking GAAP measure because management cannot reliably predict
certain of the necessary components of such forward-looking GAAP measure.
Funds Flow from Operations and Operating Netback
Funds flow from operations, as presented, is defined as net income or loss adjusted for DD&A expenses, asset impairment, goodwill impairment, deferred tax expense or recovery, stock-based compensation expense, amortization of debt issuance costs, non-
cash lease expense, lease payments, unrealized foreign exchange gains or losses, financial instruments gains or losses, other non-cash losses, cash settlement of financial instruments and other gains or losses. Management uses this financial measure to
analyze liquidity and cash flows generated by Gran Tierra's principal business activities prior to the consideration of how changes in assets and liabilities from operating activities and cash settlement of asset retirement obligation affect those cash flows, and
believes that this financial measure is also useful supplemental information for investors to analyze Gran Tierra's liquidity and financial results.
Operating netback as presented is defined as 2020 oil and gas sales less operating and transportation expenses. Operating netback per boe as presented is defined as oil and gas sales price less 2020 forecasts of transportation and quality discount, royalties,
operating costs and pipeline transportation from the 2020 budget Brent oil price forecast as outlined in the table above. Management believes that operating netback and operating netback per boe are useful supplemental measures for management and
investors to analyze financial performance and provides an indication of the results generated by our principal business activities prior to the consideration of other income and expenses. Gran Tierra is unable to provide a quantitative reconciliation of either
forward-looking operating netback or operating netback per boe to its most directly comparable forward-looking GAAP measure because management cannot reliably predict certain of the necessary components of such forward-looking GAAP measures.
Gran Tierra is unable to provide forward-looking (i) net income and (ii) oil and gas sales, the GAAP measures most directly comparable to the non-GAAP measures funds flow from operations and EBITDA and (ii) operating netback, respectively, due to the
impracticality of quantifying certain components required by GAAP as a result of the inherent volatility in the value of certain financial instruments held by the Company and the inability to quantify the effectiveness of commodity price derivatives used to manage
the variability in cash flows associated with the forecasted sale of its oil production and changes in commodity prices.
Forward-Looking Non-GAAP Measures
This presentation includes forward-looking non-GAAP financial measures as further described herein. These non-GAAP measures do not have a standardized meaning under GAAP. Investors are cautioned that these measures should not be construed as an
alternative to net income or loss or other measures of financial performance as determined in accordance with GAAP. Gran Tierra's method of calculating these measures may differ from other companies and, accordingly, it may not be comparable to similar
measures used by other companies. These non-GAAP financial measures are presented along with the corresponding GAAP measure so as to not imply that more emphasis should be placed on the non-GAAP measure. Gran Tierra is unable to provide forward-
looking net income and oil and gas sales, the GAAP measures most directly comparable to the non-GAAP measures EBITDA and operating netback, respectively, due to the impracticality of quantifying certain components required by GAAP as a result of the
inherent volatility in the value of certain financial instruments held by the Company and the inability to quantify the effectiveness of commodity price derivatives used to manage the variability in cash flows associated with the forecasted sale of its oil production
and changes in commodity prices.
Operating netback as presented is defined as projected 2021 oil and gas sales less projected 2021 operating and transportation expenses. Operating netback per bbl as presented is defined as projected oil and gas sales price less 2021 forecasts of
transportation and quality discount, royalties, operating costs and pipeline transportation from the 2021 budget Brent oil price forecast as outlined in the table above. The most directly comparable GAAP measures are oil and gas sales and oil and gas sales price,
respectively. Management believes that operating netback and operating netback per bbl are useful supplemental measures for management and investors to analyze financial performance and provides an indication of the results generated by our principal
business activities prior to the consideration of other income and expenses. Gran Tierra is unable to provide a quantitative reconciliation of either forward-looking operating netback or operating netback per bbl to its most directly comparable forward-looking
GAAP measure because management cannot reliably predict certain of the necessary components of such forward-looking GAAP measures.
EBITDA as presented is defined as projected 2021 net income adjusted for DD&A expenses, interest expense and income tax expense or recovery. The most directly comparable GAAP measure is net income. Management uses this financial measure to
analyze performance and income or loss generated by our principal business activities prior to the consideration of how non-cash items affect that income, and believes that this financial measure is also useful supplemental information for investors to analyze
performance and our financial results. Gran Tierra is unable to provide a quantitative reconciliation of forward-looking EBITDA to its most directly comparable forward-looking GAAP measure because management cannot reliably predict certain of the necessary
components of such forward-looking GAAP measure.
Free cash flow as presented is defined as GAAP projected "net cash provided by operating activities" less projected 2021 capital spending. The most directly comparable GAAP measure is net cash provided by operating activities. Management believes that free
cash flow is a useful supplemental measure for management and investors to in order to evaluate the financial sustainability of the Company's business. Gran Tierra is unable to provide a quantitative reconciliation of forward-looking free cash flow to its most
directly comparable forward-looking GAAP measure because management cannot reliably predict certain of the necessary components of such forward-looking GAAP measure.
Net Debt as presented is defined as projected working capital at December 31, 2021, less $600 million in senior notes and borrowings under the credit facility. Management believes that net debt is a useful supplemental measure for management and investors
to in order to evaluate the financial sustainability of the Company's business and leverage. The most directly comparable GAAP measure is total debt. Gran Tierra is unable to provide a quantitative reconciliation of forward-looking net debt to its most directly
comparable forward-looking GAAP measure because management cannot reliably predict certain of the necessary components of such forward-looking GAAP measure.
1. Includes net lease payments. 33PRESENTATION OF OIL & GAS INFORMATION
Presentation of Oil & Gas Information
BOEs have been converted on the basis of six thousand cubic feet (“Mcf”) natural gas to 1 barrel of oil. BOEs may be misleading, particularly if used in isolation. A BOE conversion ratio of 6 Mcf: 1 bbl is based on an energy equivalency
conversion method primarily applicable at the burner tip and does not represent a value equivalency at the wellhead. In addition, given that the value ratio based on the current price of oil as compared with natural gas is significantly
different from the energy equivalent of six to one, utilizing a BOE conversion ratio of 6 Mcf: 1 bbl would be misleading as an indication of value. Unless otherwise specified, in this presentation, all production is reported on a WI basis
(operating and non-operating) before the deduction of royalties payable. Per BOE amounts are based on WI sales before royalties. References to a formation where evidence of hydrocarbons has been encountered is not necessarily an
indicator that hydrocarbons will be recoverable in commercial quantities or in any estimated volume. Gran Tierra's reported production is a mix of light crude oil and medium and heavy crude oil for which there is no precise breakdown
since the Company's oil sales volumes typically represent blends of more than one type of crude oil. Well test results should be considered as preliminary and not necessarily indicative of long-term performance or of ultimate recovery.
Well log interpretations indicating oil and gas accumulations are not necessarily indicative of future production or ultimate recovery. If it is indicated that a pressure transient analysis or well-test interpretation has not been carried out, any
data disclosed in that respect should be considered preliminary until such analysis has been completed. References to thickness of "oil pay" or of a formation where evidence of hydrocarbons has been encountered is not necessarily an
indicator that hydrocarbons will be recoverable in commercial quantities or in any estimated volume.
Definitions
In this presentation:
• “2P” are 1P reserves plus probable reserves.
• “3P” are 1P plus 2P plus possible reserves.
• “developed producing reserves” are those reserves that are expected to be recovered from completion intervals open at the time of the estimate. These reserves may be currently producing or, if shut-in, they must have previously
been on production, and the date of resumption of production must be known with reasonable certainty.
• “GAAP” means generally accepted accounting principles in the Unites States of America.
• “NPV” means net present value.
• “NPV10” means NPV discounted at 10%.
• “possible reserves” are those additional reserves that are less certain to be recovered than probable reserves. There is a 10% probability that quantities actually recovered will equal or exceed sum of proved plus probable plus
possible reserves. Possible reserves may be developed or undeveloped.
• “probable reserves” are those unproved reserves that are less certain to be recovered than proved reserves. It is equally likely that actual remaining quantities recovered will be greater or less than sum of estimated proved plus
probable reserves. Probable reserves may be developed or undeveloped.
• “proved developed reserves” or “PDP” are those proved reserves that are expected to be recovered from existing wells and installed facilities or, if facilities have not been installed, that would involve a low expenditure (e.g., when
compared to cost of drilling a well) to put reserves on production. Developed category may be subdivided into producing and non-producing.
• “proved reserves” or “1P” are those reserves that can be estimated with a high degree of certainty to be recoverable. It is likely that actual remaining quantities recovered will exceed estimated proved reserves.
• “reserves” are estimated remaining quantities of oil and natural gas and related substances anticipated to be recoverable from known accumulations, as of a given date, based on: (a) analysis of drilling, geological, geophysical and
engineering data; (b) use of established technology; and (c) specified economic conditions, which are generally accepted as being reasonable. Reserves are classified according to degree of certainty associated with estimates.
• “undeveloped reserves” are those reserves expected to be recovered from known accumulations where a significant expenditure (e.g., when compared to the cost of drilling a well) is required to render them capable of production.
They must fully meet the requirements of the reserves category (proved, probable, possible) to which they are assigned.
Certain terms used in this presentation but not defined are defined in NI 51-101, CSA Staff Notice 51-324 - Revised Glossary to NI 51-101 Standards of Disclosure for Oil and Gas Activities (“CSA Staff Notice 51-324”) and/or the COGEH
and, unless the context otherwise requires, shall have the same meanings herein as in NI 51-101, CSA Staff Notice 51-324 and the COGEH, as the case may be.
Reserves Information
Unless otherwise expressly stated, all reserves values, future net revenue, ancillary information and any measure of oil and gas activities contained in this presentation is as at December 31, 2020 and has been prepared and calculated in
accordance with Canadian National Instrument 51-101 – Standards of Disclosure for Oil and Gas Activities (“NI 51-101”) and the Canadian Oil and Gas Evaluation Handbook (“COGEH”) and derived from a report with an effective date of
December 31, 2020 prepared by McDaniel & Associates Consultants (“McDaniel”), Gran Tierra’s independent qualified reserves evaluator and auditor (the “GTE McDaniel December 31, 2020 Reserves Report”). Any reserves estimate
or related information contained in this presentation as of a date other than December 31, 2020 has an effective date of December 31 of the applicable year and is derived from a report prepared by Gran Tierra’s independent qualified
reserves evaluator and auditor as of such date, and additional information regarding such estimate or information can be found in Gran Tierra’s applicable Statement of Reserves Data and Other Oil and Gas Information on Form 51-
101F1 filed on SEDAR at www.sedar.com.
Gran Tierra's Statement of Reserves Data and Other Oil and Gas Information on Form 51-101F1 dated effective as at December 31, 2020, containing further disclosure of its oil and gas reserves and other oil and gas information in
accordance with NI 51-101 forming the basis of certain items included in this presentation, is available on SEDAR at www.sedar.com. See this document for more details and disclaimers.
34PRESENTATION OF OIL & GAS INFORMATION
Reserves Information (continued)
Estimates of reserves provided in this presentation are estimates only and there is no guarantee that estimated reserves will be recovered. Actual reserves may be greater than or less than estimates provided in this presentation and
differences may be material. All reserves assigned in the GTE McDaniel December 31, 2020 Reserves Report are located in Colombia and Ecuador and presented on a consolidated basis.
Estimates of net present value and future net revenue contained herein do not necessarily represent fair market value. Estimates of reserves and future net revenue for individual properties may not reflect the same level of confidence as
estimates of reserves and future net revenue for all properties, due to the effect of aggregation. There is no assurance that the forecast price and cost assumptions applied by McDaniel in evaluating Gran Tierra’s reserves will be attained
and variances could be material.
All evaluations of future net revenue contained in the GTE McDaniel December 31, 2020 Reserves Report are estimated using forecast prices and costs, arising from the anticipated development and production of reserves, after the
deduction of royalties, operating costs, development costs, production costs and abandonment and reclamation costs but before consideration of indirect costs such as administrative, overhead and other miscellaneous expenses. It should
not be assumed that the estimates of future net revenues presented in the in this presentation represent the fair market value of the reserves. There are numerous uncertainties inherent in estimating quantities of crude oil, reserves and the
future cash flows attributed to such reserves. The reserve and associated cash flow information set forth in the GTE McDaniel December 31, 2020 Reserves Report are estimates only. See the press release dated February 24, 2021 for
more details and disclaimers.
BOEs have been converted on the basis of six thousand cubic feet (“Mcf”) natural gas to 1 barrel of oil. BOEs may be misleading, particularly if used in isolation. A BOE conversion ratio of 6 Mcf: 1 bbl is based on an energy equivalency
conversion method primarily applicable at the burner tip and does not represent a value equivalency at the wellhead. In addition, given that the value ratio based on the current price of oil as compared with natural gas is significantly
different from the energy equivalent of six to one, utilizing a BOE conversion ratio of 6 Mcf: 1 bbl would be misleading as an indication of value.
References to a formation where evidence of hydrocarbons has been encountered is not necessarily an indicator that hydrocarbons will be recoverable in commercial quantities or in any estimated volume. Gran Tierra's reported production
is a mix of light crude oil and medium and heavy crude oil for which there is no precise breakdown since the Company's oil sales volumes typically represent blends of more than one type of crude oil. Well test results should be considered
as preliminary and not necessarily indicative of long-term performance or of ultimate recovery. Well log interpretations indicating oil and gas accumulations are not necessarily indicative of future production or ultimate recovery. If it is
indicated that a pressure transient analysis or well-test interpretation has not been carried out, any data disclosed in that respect should be considered preliminary until such analysis has been completed. References to thickness of "oil
pay" or of a formation where evidence of hydrocarbons has been encountered is not necessarily an indicator that hydrocarbons will be recoverable in commercial quantities or in any estimated volume.
Original oil-in-place (OOIP) refers to the total oil content of an oil reservoir and does not represent reserves or recoverable production, which may be materially less than OOIP estimates.
Oil and Gas Metrics
This presentation contains a number of oil and gas metrics, including free cash flow, finding and development (“F&D”) costs, operating netback, reserve life index and reserves replacement, which do not have standardized meanings or
standard methods of calculation and therefore such measures may not be comparable to similar measures used by other companies and should not be used to make comparisons. Such metrics have been included herein to provide
readers with additional measures to evaluate the Company's performance; however, such measures are not reliable indicators of the future performance of the Company and future performance may not compare to the performance in
previous periods.
• Before tax and after tax free cash flow are non-GAAP terms and are called before tax and after tax future net revenue, respectively, in the GTE McDaniel December 31, 2020 Reserves Report. The non-GAAP term of before tax free
cash flow reconciles to the nearest GAAP term of oil and gas sales, which is called sales revenue in the GTE McDaniel December 31, 2020 Reserves Report. Before tax future net revenue is calculated by McDaniel by subtracting
total royalties, operating costs, future development capital, abandonment and reclamation costs from sales revenue. After tax free cash flow is calculated by McDaniel by subtracting future taxes from before tax future net revenue.
Refer to "Future Net Revenue" in the press release dated February 24, 2021 for the applicable reconciliation. Management uses free cash flow as a measure of the Company's ability to fund its exploration program.
• F&D costs are calculated as estimated exploration and development capital expenditures, excluding acquisitions and dispositions, divided by the applicable reserves additions both before and after changes in future development
(“FDC”) costs. The calculation of F&D costs incorporates the change in FDC required to bring proved undeveloped and developed reserves into production. The aggregate of the exploration and development costs incurred in the
financial year and the changes during that year in estimated FDC may not reflect the total F&D costs related to reserves additions for that year. Management uses F&D costs per BOE as a measure of its ability to execute its capital
program and of its asset quality.
• Operating netback is calculated as described in this presentation. Management believes that operating netback is a useful supplemental measure for investors to analyze financial performance and provide an indication of the results
generated by Gran Tierra's principal business activities prior to the consideration of other income and expenses.
• Reserve life index is calculated as reserves in the referenced category divided by the referenced estimated production. Management uses this measure to determine how long the booked reserves will last at current production rates if
no further reserves were added.
• Reserves replacement is calculated as reserves in the referenced category divided by estimated referenced production. Management uses this measure to determine the relative change of its reserve base over a period of time.
35You can also read