Feeding the Celtic Tiger-Brexit, Ireland and Services Trade By Jun Du and Oleksandr Shepotylo
←
→
Page content transcription
If your browser does not render page correctly, please read the page content below

Lloyds Banking Group Centre for Business Prosperity

Feeding the Celtic Tiger
– Brexit, Ireland and Services Trade

By Jun Du and Oleksandr Shepotylo

Research Paper

May 2021
Feeding the Celtic Tiger
 – Brexit, Ireland and Services Trade

 Jun Du1 and Oleksandr Shepotylo2
 May 2021

1
 Economics, Finance and Entrepreneurship Department, Aston Business School,
Aston University. Email: j.du@aston.ac.uk, Telephone: 07713085539; Twitter:
@jundu1mecom.

2
 Economics, Finance and Entrepreneurship Department, Aston Business School,
Aston University. Email: oshepotylo@aston.ac.uk, Telephone: 01212044792; Twitter:
@shepotylo.

Acknowledgement: We are thankful for the financial support of Lloyds Banking
Group. The views expressed in this paper are those of the authors alone.

 2
Feeding the Celtic Tiger
 – Brexit, Ireland and Services Trade

 Jun Du and Oleksandr Shepotylo
 Abstract

We study the impact of the 2016 Brexit Referendum on the services trade of the
UK and Ireland. Using the synthetic control method, we show that in 2016-2019,
on average, the UK has been losing 9.2% of services exports or 36.7 billion USD
every year. This amounts to 146.8 billion USD between 2016-2019 in total (113.1
billion GBP based on annual average exchange rates). By contrast, Ireland is the
big winner of Brexit. We show that, over the same period, Ireland on average has
boosted its services exports by 23.6% or 41 billion USD every year, generating
extra export value of 164.1 billion USD (144.2 billion EUR / 125.7 billion GBP
based on annual average exchange rates) in total relative to the counterfactual
scenario in which Brexit did not happen. The effect is similar for the UK and even
more pronounced for Ireland when using the synthetic control method on the
quarterly data and difference-in-difference analysis.
 The implication for the short- and medium-term points to the crucial
importance for the UK to develop deeper cooperation with the EU on services
trade. Some aspects, such as data and digital trade, are temporarily covered by
the EU-UK Trade and Cooperation Agreement, but other areas are more
challenging and will require continuous dialogue and hard negotiations, such as
passporting rights for financial services, market access for professional and
business services, and equivalence in both cases, to name a few. In the longer
term though, UK businesses will need to develop their real competitiveness to
counterbalance the disadvantages brought by Brexit. Such competitive edge can
be only be created by productivity and innovation. However, productivity gains
and innovation are most likely to be observed in economies with good access to
markets, which are open to competition in goods and services from the rest of the
world.
 Key words: Brexit, synthetic control, services trade, Ireland, UK
 JEL codes: F14, F15

 3
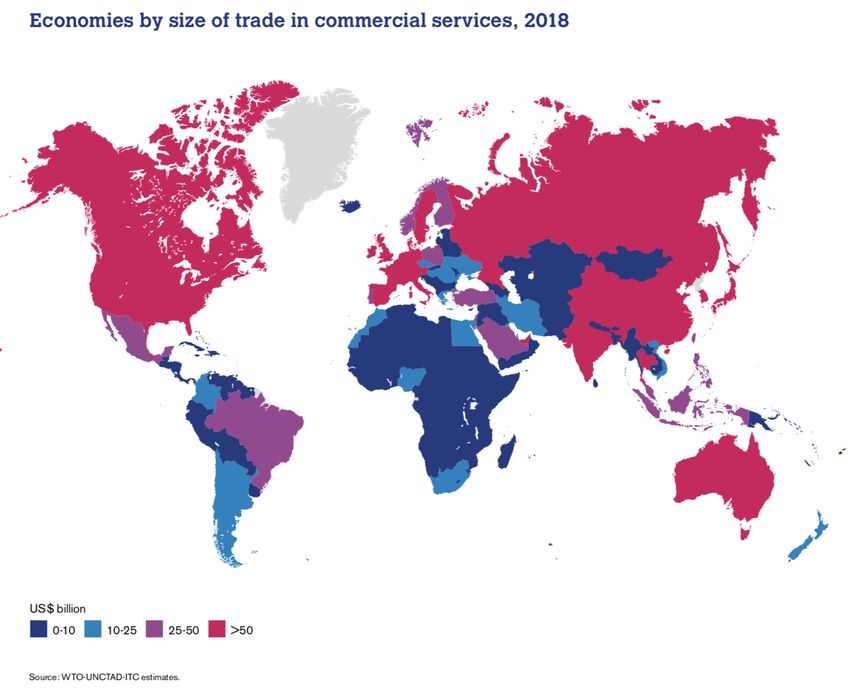
1. Introduction

Services have never been as tradeable as today. Rapid growth of new types of services trade
has been made possible by fast-paced technological development in information and
communications technology (ICT), which has become widely accessible and affordable. What
prevented trade in services from expanding to a larger scale in the past seems less of a barrier
today.

 Indeed, international trade in services is an increasingly important feature of developed
economies. Globally, trade in services created grows rapidly, reaching $5.63 trillion worldwide
in 2018 (WTO, 2019). The UK is the second largest service market in the world behind the US.
In recent decades, the global competition from both advanced economies and emerging
economies has grown fierce; fast-changing technologies and regional production networks in
the developing world disrupt the existing structure of the global value chains (GVCs),
illustrated in Figure 1.

 Figure 1: Economies by size of trade in commercial services, 2018

 Source: WTO-UNCTAD-ITC estimates, published in World Trade Statistical Review 2019, WTO.

 Despite all the stimuli of global trade in services, a confluence of social, economic,
institutional, and political forces have converged to slow down the growth of international
production and services (Ahlstrom et al., 2020). Currently, most experts expect globalisation

 4
to further restructure after two decades of rapid growth up until the 2008 financial crisis and a
following decade of stagnation (Zhan et al., 2020). In Europe, Brexit is one such powerful
factor that hampers trade between the UK and EU after over forty years of close economic
integration across borders.

 What can be learnt about the effects of Brexit in the literature is mostly from studies on
trade in goods. It might have become apparent to the public only in the spring of 2021 how
chaotic and catastrophic Brexit really was to UK trade. However, research has shown that trade
destruction has occurred even prior to that. For example, policy uncertainty around
international trade since the 2016 Brexit referendum has reduced firms’ export participation
(Crowley et al., 2018) and aggregate trade flow (Douch et al., 2018; Graziano et al., 2018). UK
firms, especially smaller ones, have already responded to the Brexit uncertainty by redirecting
their trade away from the close, rich, and previously frictionless EU neighboring markets to
places further afield (Douch et al., 2019). Some of the effects were detectable even before 2016,
when the anticipation of future trade shocks led to tangible changes in trade dynamics (Handley
and Limão 2017; Douch et al., 2018; Douch et al., 2019).1

 A natural question that arises alongside this evidence, and about which we know very
little, is what has happened to UK trade in services since 2016? Has it also been negatively
affected by Brexit, as has been observed for trade in goods? There are good reasons to suspect
that this has been the case, since what caused the trade decline – the uncertainty of the future
trading arrangements between the UK and the EU – applied to trade in goods as well as trade
in services. However, the nature of the uncertainty differed. As for trade in goods, businesses
are concerned with cost inflation introduced by increases in tariff and non-tariff barriers,2 while
for services, there seemed all along to be more confidence that the governments from both
sides would finally achieve some kind of agreement.3 That explains why it was felt surprising

1
 This is known as anticipation effect. Brexit was not the first occasion when such an effect was observed. Freund
and McLaren (1999) show the rising trade years before the EU trade agreement comes into force. The primary
reason for anticipation effect to take effect in policy uncertainty situation is the inherent sunk costs associated
with trade. Firms would have to bear certain costs to export, most notably when entering a new market (Melitz,
2003; Eaton et al, 2011). The costs of searching for partners, developing local knowledge and reputation,
marketing and following legal procedures, cannot be recouped if the firm subsequently withdraw from exporting,
and hence would become sunk costs.
2
 The fear for potential non-tariff barriers seemed secondary compared to that for the WTO tariff schedule in the
case of no deal.
3
 This could be understood by how surprised by the media and businesses after the TCA has been agreed that has
very limited coverage on services.

 5
when the final EU-UK agreement of Brexit terms was announced, with little coverage on
services, just before Christmas 2020.4
 The UK services industries - professional, business and financial services sectors in
particular - contribute significantly to the UK economy in terms of output, value-added
generation and job creation (Douch et al, 2020). These services sectors are important to other
services sectors by cross-supplying important, high-quality intermediate inputs to help
maintain their competitive edge. They are also increasingly crucial to manufacturing firms’
participation of GVCs through competing on adding value to product sales with customized
solutions and integrated “product-service systems" (i.e. servitization processes). The capability
to servitize globally, building on firms’ exporting platforms, has been a key component to UK
traders’ international value proposition.
 Despite the importance of services sectors to the UK economy, to date there has been
limited research on assessing how Brexit has impacted on services trade. In fact, there has been
generally a paucity of research on services trade, either the importance of trade and investment
in services (Buckley & Majumdar, 2018), or the role of policy (Mudambi, 2008). A notable
exception is by Ahmad, Oliver, Limão and Shikher (2020). By modelling the potential risk of
Brexit during 2016-2018, the authors estimate a 20 log points of reduced export values of trade
in services during this period, and a 16 log points of reduced export participation. The paper
concludes that preferential trade agreements increase services trade and, when this is placed
under threat, trade suffers.
 This finding that services trade began to reduce even before the Brexit process actually
mirrors that of trade in goods, and both cases could be explained using the argument of sunk
costs. However, there are important differences between goods and services. While production
is not easy to relocate to another country, services are. Only focusing on the remaining
businesses may underestimate the real effect of Brexit. In fact, anecdotal evidence abounds on
the relocation of UK businesses to Dublin/Ireland, the Netherlands, and other popular EU
destinations. 5 Has Brexit pushed UK businesses, especially multinationals, to relocate
elsewhere in the EU, and hence also their international services business? If it has, where did
these businesses go?

4
 The surprise was widely expressed in the media, for example https://www.ft.com/content/cc6b0d9a-d8cc-
4ddb-8c57-726df018c10e.
5
 See among others, Bloomberg report, and many business services mushrooming since 2016 to help UK
businesses to relocate, for example Company Bureau, Sherwin O’Riordan.

 6

This paper aims to provide some answers to these questions. It fills the gap by
estimating the magnitude of the lost trade in services due to Brexit, taking into account
footloose multinationals. We analyse the most updated annual bilateral exports of services of
179 countries, including UK exports in the period 2010-2019, as well as quarterly total exports
of services of 51 OECD and emerging economies in 2010Q1-2019Q4. Employing a synthetic
control modelling and difference-in-difference approach, we separate the impact of the 2016
Brexit referendum from the long- and short-term fluctuations. This helps us to identify a causal
effect of Brexit on services trade.
 We take a special interest in Ireland when looking for the UK’s ‘lost’ trade due to Brexit.
Sharing close economic, social, and cultural ties with the UK, Ireland has experienced an
exceptional recovery from the last financial crisis and subsequently enjoyed an impressive
boom in its economy, based in part on inward investment and international trade. Especially
since 2015, its services trade has soared, which we show below. Indeed, Ireland has qualities
to attract foreign businesses, ranging from business-friendly policies, low tax, an open society
and global connections. Still, with its largest trading partner breaking away from the EU, some
argue that Ireland’s thriving trade hangs in the balance.6 We examine empirically in this paper
whether Brexit has benefited Ireland.
 In the rest of the paper, we first explore the potential rationales of business relocation,
on the premise that FDI and trade are so tightly linked, with multinationals accounting for the
lion’s share of trade and investment. Using Ireland as a case study, given its leading position
as a destination for investment, we empirically examine the effect of Brexit on the services
trade flow of Ireland. We also carry out mirroring analysis for the services trade flow of the
UK, as well as a battery of identification checks. We discuss the consistent and strong results
emerging from this examination and posit relevant policy and business implications.

 2. Location choice of multinationals
 2.1 Why do some places attract more investment?
Many countries seek inward investment in the hope for generating jobs and value-added.
Indeed, inward investments from foreign countries are highly desirable not only because of the
jobs created, wages increased, outputs produced, tax paid and direct technology transfer to the
host economies. FDI is seen as vital to national and regional development, by also generating

6
 There are worries about the damage of Brexit on Irish economy. The Irish Economic and Social Research
Institute (ESRI) research found that Irish consumers are deeply worried, at https://www.esri.ie/news/irish-
consumer-sentiment-falls-sharply-in-february.

 7
positive spillovers on host countries’ productivity, wages and innovation across supply chains,
through unintended technology transfer, demonstration effects and enhancing competition in
the local market (Blomström et al., 2001). What’s more, at an aggregate economic level, inward
investments, if structured appropriately, can help in modifying local industrial structure (Barry
and Kearney, 2006).
 Why do some countries, regions and cities attract more investments than others? This
question of FDI location is one of the fundamental scholarly pursuits of multidisciplinary fields,
including International trade, International Business (IB) and Economics of Geography
(Iammarino and McCann, 2013). In a nutshell, the early international trade literature explains
FDI activities in terms of the motivation of multinationals to enhance productivity and
efficiency by organising their production activities in different locations. Vertical FDI is
mainly driven by production cost differences between countries (Krugman et al 2018), which
may be wage or cost of materials related, and hence often takes place by developed-economy
multinationals in developing countries. Further, technology as a factor of production (for both
manufacturing and services) has been a key factor to attract vertical FDI. In contract, the
purpose of horizontal FDI is to be closer to customers, hence it is dominated by flows between
developed countries (Krugman et al 2018). This strategy helps firms to save on transport costs
and access to customer recognition. These patterns have changed considerably over time, with
multinational firms also investing in low-cost countries to create export platforms from which
they serve other countries around the world (Helpman, 2006). Hence, developed-economy
multinationals are seen investing frequently in other developed economies as a means of
creating an ecosystem for innovation (Castellani, 2017).
 In a similar vein, earlier literature of IB strategy identifies macro-factors known as
country-specific advantages (CSAs) that drive FDI flow (Vernon, 1966; Dunning, 1958). These
factors largely reflect comparative advantages of countries in production, such as natural
resources, institutional strengths, the purchasing power of consumers and innovation strengths
that attract multinationals to set up foreign subsidiaries (Dunning, 2009).
 Even though the literature since the 1970s has moved away from macro-level questions
about countries, their trade and balance of payments positions, and towards micro-level
operations within firms in directing decisions around FDI (Cantwell, 2009), these macro-
factors or CSAs never left the equation. Different theories which emerged thenceforward are
ultimately concerned with firms’ organisation and governance design to maximise efficiency,
combining CSAs and firm-specific advantages (FSAs). In this framework, multinationals need
to organise themselves internally and internationally to make difficult choices among

 8
alternative strategic investment options when deploying their resources and capabilities to
capitalise on favourable configurations of the host CSAs, which might be accessible cheap
labour, knowledge spillovers accruing to participants in local clusters or a large market for
firms’ outputs (Narula, Verbeke and Yuan, 2021).

 2.2 What attracts FDI to the UK?
Applying the above theories to the UK, it is not hard to understand why Brexit dampens the
desire of multinationals to further invest or even remain in the UK. An easy place of departure
is to understand what attracted FDI to the UK before Brexit and analyse what has been lost in
the breakup.
 The UK is well known as an open and liberal developed economy that is particularly
favourable to trade and investment. In 2015 before the Brexit Referendum, both its outward
(equivalent to 55% of GDP) and inward FDI stocks (equivalent to 46% of GDP) were higher
than the UK share in OECD GDP. It remains among the top four countries in the world in FDI
stock and the No. 1 in Europe, with three-quarters of all inward investment concentrated in the
service sectors. The UK partners with all major markets through either trade or investment,
both foreign multinationals in the UK and UK multinationals around the world. While the
United States, France, the Netherlands, and Japan supply the United Kingdom almost equally
by trade and sales by foreign affiliates, German, Spanish and Chinese firms do so mainly
through trade.7
 The UK economy is of a size and maturity expected by up-scaling investors. As the 5th
largest in the world by the size of its GDP in 2015 8 , its market size and industry growth
performance compare well with other advanced countries, signalling significant potential for
inward investors (Driffield et al., 2013). Not only does the UK have economic ‘gravitas’, it
also connects well to the global market. Exporting is key to the UK economy, with export value
equivalent to around one-third of its GDP, and the country was ranked the 11th largest global
exporter of goods and the 5th largest global importer of goods in 2019. The UK has one of the
highest services contents in its exports at 64%, and the share of investment in services is at the
higher end for OECD economies. It is well-integrated in global value chains, producing a broad,
diversified range of products and services, many of which are sophisticated and highly

7
 The statistics are compiled based on the OECD FDI data, at https://data.oecd.org/fdi/fdi-flows.htm.
8
 IMF World Economic Outlook, available from: http://statisticstimes.com/economy/projected-world-gdp-
ranking.php.

 9
knowledge-intensive, and thereby adding value to its trading partners in 225 countries and
territories (Du et al, 2021).
 Further, the UK has high-quality institutions, being ranked the 8th best place in the
world to do business by the World Bank.9 The World Bank 2020 guide reports that setting up
a business in the UK takes on average 13 days, far ahead of anywhere else in Europe, with the
European average being 32 days. The rules are transparent and enforcement is adequate.
Proactive policies foster international investment through administrative efficiency in order to
promote innovation and achieve sustainable growth. The UK government is a strong advocate
for the rights of all UK companies, regardless of their nationality or that of their owners. In
particular, the UK enjoys a flexible labour market compared to other OECD countries that is
attractive to investors. And its main rate of corporation tax stands at 19 per cent since 2017
which is considerably lower than its main rivals, such as the US (25.8%), Germany (30%),
France (32%) and Japan (30%).10
 Part of the UK’s attractiveness also lies in its agglomeration and knowledge economy.
London has a prominent position not only in the global network of financial, professional and
business services strengths, but also draws in global talents and skills. The deep pool of
expertise and top research and innovation capabilities create favourable conditions to attract
investors.
 Moreover, one of the key value propositions to attract investors to the UK had been its
access to the EU, the largest single market in the world. It is considered an ideal location for
export-platform FDI that aims to access the EU market (Kneller and Pisu, 2004), given the
English language, low corporate tax and stable legislation based on Common Law which
governs international contracts, making the UK (formerly) a natural candidate as a platform
within the EU (Tamberi, 2020). Indeed, the UK government and devolved governments had
been facilitating investment by providing foreign companies with access to the largely
integrated European market. The automotive industry is perhaps the most notable example for
highlighting this integration as a key motive for investing in the UK. 11 It also potentially

9
 See more details at https://www.doingbusiness.org/en/data/exploreeconomies/united-kingdom.
10
 The UK corporation tax (CT) rate will rise from 19 to 25 percent with effect from 1 April 2023, but will
remain the lowest in G7.

11
 Car manufacturers such as Honda and Toyota came to the UK in the 80s aiming to sell to the whole European
market. Hiroaki Nakanishi, chairman of the board of Hitachi, wrote on the Financial Times: `We invested in [the
UK] as the best base for access to the entire EU market'. See article `Japanese investors in Britain depend on the
links to Europe', Hiroaki Nakanishi, May 11 2016, at https://www.ft.com/content/047c7416-12b9-11e6-91da-
096d89bd2173. The Japanese government's letter to the United Kingdom clearly stated that for Japanese firms

 10
explains the subsequent plans for investment in mid-2019 by Japanese carmakers, American
banks and others.

 2.3 Why Brexit could be a deal-breaker
Brexit has altered some of these assumptions. The UK was the top destination for cross-border
mergers and acquisitions involving American tech firms in 2014-17. But in 2018 it tumbled to
eighth place.12 Breinlich et al (2020) has estimated that the Brexit vote had caused a 12% rise
in new investment by British firms in the rest of the EU in the form of green investment or
mergers and acquisitions.
 Businesses located in the UK, both domestic and foreign, might have felt the need to
reallocate their business to the EU to continue accessing the Single Market. One of the key
concerns following the 2016 Brexit referendum was the potential restriction, in the event of
‘no deal’, of the passporting rights of UK financial institutions and other businesses that
enabled cross-border trade in financial services to the EU market. This has since become a
reality and the impact on financial services providers is significant.13
 Furthermore, it was feared the UK’s professional and business services, covering a
range of knowledge-intensive industries and support functions and representing the largest
single export class, would be much-restricted too. As it turns out, this fear has now also become
plainly visible, given the limited market access imposed on professional and business services
sectors by the “national reservations” in the TCA, 14 and the lack of provision for mutual
recognition of professional qualifications that affect accountants, lawyers, architects and the
like.
 In addition, UK businesses that operate across borders will be seriously impacted by
any divergence between data protection laws. Currently, data adequacy is covered by a short-
term arrangement, termed a ‘bridging mechanism’ in the TCA to allow free data flows between
the UK and the EU. However, restrictions of transferring personal data in the future (likely

in the UK frictionless access to the European market is vital for their firms, at
https://www.mofa.go.jp/files/000185466.pdf .

12
 See The Economists, May 9, 2019, How is Brexit affect FDI into Britain?
13
 See the overall assessment of Brexit impact on trade in services at the House of Lords EU Services Sub-
Committee at https://publications.parliament.uk/pa/ld5801/ldselect/ldeucom/248/24802.htm.
14
 TCA 2020 Annex SERVIN-1, Reservation No. 1 maintains that 50% of the management and ownership of any
company established there must reside in the Single Market.

 11
after four years), especially from the EU to the UK, could be a real deal-breaker for a wide
range of services providers.15
 As a result, it may not be surprising that, since the beginning of the Brexit process,
businesses were planning for this eventuality and some chose to relocate. In January 2019, as
reported widely in the media, Barclays bank received legal approval to move €190bn ($213bn)
of assets to Dublin, fearing ‘no deal’. Barclays was by no means the only one, as is revealed
by the recent House of Lords EU Committee: UK-based firms offering services into the EU
have all had to seek to set up new licensed entities on the continent.16 Others that have shifted
substantial parts of their business to affiliates established inside the Single Market include
Scottish Widows (to Luxembourg), Standard Life Aberdeen (Dublin) and Royal Bank of
Scotland (Amsterdam).17 Due to the travel restrictions during the COVID-19 crisis period, the
full extent of firm reallocation may be yet to be materialise.
 Taken together, it is reasonable to assume that any multinational aiming to access the
large EU market will have a strong preference for locating in the EU rather than in the UK.
The existing multinational enterprises already operating in the UK will consider, if not yet, to
reroute future investment to an EU country. Only firms wanting to supply the UK market will
continue to invest in the UK. This problem for the UK is an opportunity for places like the
Republic of Ireland.

 2.4 Ireland’s lure
Among the attractive locations for investors, Ireland stands out. Dublin, Ireland’s capital city,
may not be a top global metropolitan hub like London and New York, but it is certainly a fast-
growing confluence location for investment.
 Ireland has consistently presented an array of qualities attractive to investors. Post-
Brexit it becomes an even more favourable location for a business aiming to establish an EU
presence. First of all, Ireland is exceptionally open to foreign direct investment and has a strong
commitment to trade liberalisation. Its advantageous tax system for multinational companies
is well known. The corporate tax rate is as low as 12.5%, among the lowest in Europe and

15
 See Chapter 4: Data and Digital Trade in the overall assessment of Brexit impact on trade in services at the
House of Lords EU Services Sub-Committee at
https://publications.parliament.uk/pa/ld5801/ldselect/ldeucom/248/24802.htm
16
 See evidence provided by Nick Collier, Managing Director (Brussels), City of London Corporation to the EU
committee at https://committees.parliament.uk/oralevidence/1528/html/.
17
 See evidence provided by Scottish Government at https://committees.parliament.uk/writtenevidence/22570/html/.

 12
certainly the lowest among the European economies of its size. 18 It is considered a very
attractive ‘holding’ company location with favourable tax treatment of dividend income, as
there is no Withholding Tax (‘WHT’) on dividends from Irish holding companies to EU/tax
treaty countries; there is no capital gains tax on disposal of qualifying shareholdings in
subsidiaries. Furthermore, Ireland encourages innovative multinationals, with a reduced rate of
corporate tax for R&D/intangibles discounted by 25%, including staff salaries and other direct
R&D costs, as well as reduced interest on certain borrowings.
 But low tax does not explain everything. Being part of the EU, it enjoys all the benefits
for being part of the Single Market, including common currency and frictionless trade with
other EU partners, which has 27-member states containing 450 million people, with an
additional 53 EU free trade agreements globally. This is hugely important for industries where
production is fragmented and which rely on just-in-time business models, that the UK can no
longer offer in such a frictionless way.
 Globally connected and perceived to have an open society, Ireland is increasingly a
magnet for talent. It was ranked 16th place in the world for talent competitiveness according to
the new Global Talent Competitiveness Index (GTCI) which measures countries’ ability to
attract, retain and grow talent.19 With 40% of the population under 29 years old, Ireland has a
young, well-educated English-speaking workforce. Post Brexit, Ireland is the only
predominantly English-speaking country in the EU, which means it can be attractive to skills
and talents to emigrate from the UK. Ireland also has a pool of skilled management talent. The
IMD World Competitiveness Key rankings ranked Ireland No.1 for the availability of senior
management.20
 Indeed, since 2016 there have been numerous headlines in the media about businesses
that have made the move to relocate from the UK to Ireland. Interestingly, one of the most
ardent Brexit supporters, the Conservative MP Jacob Rees-Mogg, set up a company in Ireland
in 2018, after the Brexit referendum. According to The Financial Times:21
 “Several British asset managers have recently set up operations in Dublin or
 Luxembourg, Europe’s largest fund centres, as they prepare to serve European
 investors after Brexit. Legal & General Investment Management, the UK’s largest

18
 Other low corporate tax locations include Hungary (9%), Montenegro (9%), Andorra (10%), Bosnia and
Herzegovina (10%), Bulgaria (10%), Gibraltar (10%), Republic of Kosovo (10%), Kyrgyzstan (10%), Republic
of Moldova (12%) and Cyprus (12.5%).
19
 It is produced by one of the world’s leading HR solution company Adecco Group. This ranking was undermined
by Ireland’s poor position in gender equality. See details at https://adeccogroup.co.uk/news/press-releases/global-
talent-competitiveness-index-2019-pr-ire-2/.
20
 See more details of 2015 ranking at https://www.eversheds-sutherland.com/documents/global/ireland/brexit-
ireland-brochure.pdf.
21
 See https://www.ft.com/content/38987fe2-6f19-11e8-92d3-6c13e5c92914.

 13
asset manager with £1tn, recently opened an office in Dublin and received approval
 from the Central Bank of Ireland, the regulator, to launch a range of funds for EU
 clients… The route Somerset has taken, setting up an Irish collective asset
 management vehicle, or Icav, was made possible by Irish regulators in 2015 to allow
 fund companies to set up legal structures in Ireland that outsource the management
 of the funds to professionals in other countries, typically the UK.”

Were these relocated businesses just individual cases? How significant is this trend? Was this
only because of Brexit? Next, we examine this through the lens of services trade-flows, given
that they reflect the outcome of business location strategy.

 3. Data
Services trade is notoriously hard to measure. Due to the inherent complexity of recording
services compared to goods trade - especially when they are delivered in digital form (OECD,
2019) - only a handful of countries publish (some) bilateral trade in services statistics, with
asymmetric reporting by partner countries and service categories. This has made analysing
services trade challenging. In recent years, to mitigate these problems, OECD and WTO have
developed a global dataset of coherent bilateral trade in services statistics according to the main
services categories, building upon the WTO-UNCTAD Trade in Services Database. In this
paper, we draw on the (currently) most comprehensive, consistent and balanced data on trade
in services, the OECD-WTO Balanced Trade in Services dataset (BaTIS). The latest edition of
the BaTIS covers over 202 reporters and partners and the 12 main Extended Balance of
Payments Services (EBOPS) 2010 service categories for the period 2005-2019. In this analysis
we focus on 2010-2019 to exclude a period of the global financial crisis of 2008-2009 when
the global economy went through a period of deep structural changes.22
 To complement the analysis, we also employ the quarterly OECD balance of payments
BPM6 database in 2010Q1-2020Q2, which provides high frequency and more recent data on
total exports of services for OECD and large emerging economies. It gives a longer pre-
treatment period, but also increases volatility of transitory shocks. For our empirical modelling,
we use data on GDP, GDP per capita, and share of services to GDP from World Development
Indicators, provided by the World Bank.

 4. Observational study
Top exporters in the world

22
 We report results for the full period of observations in the data in 2005-2019 as a robustness check.

 14
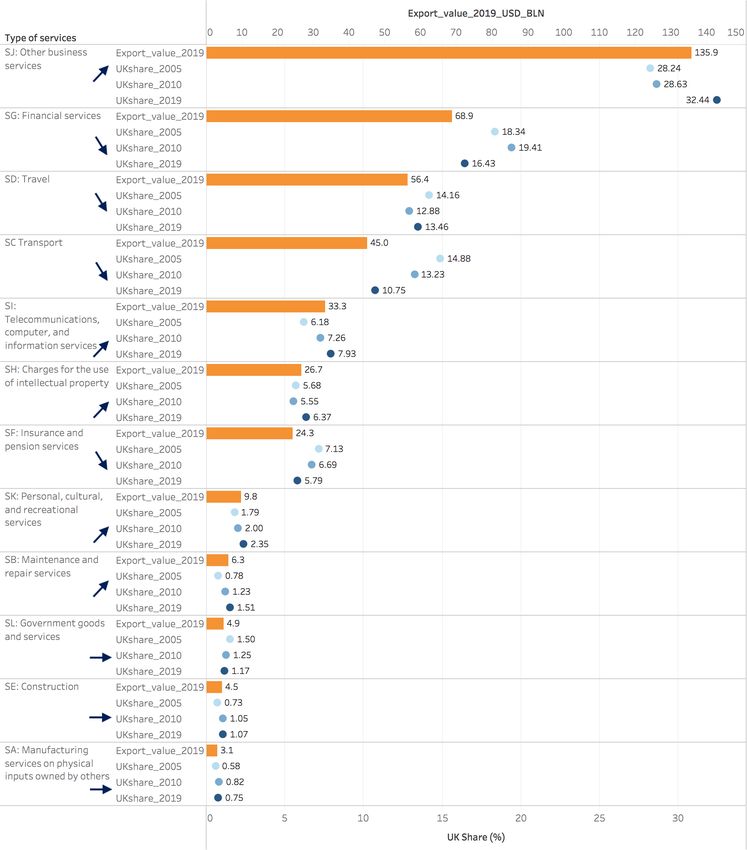
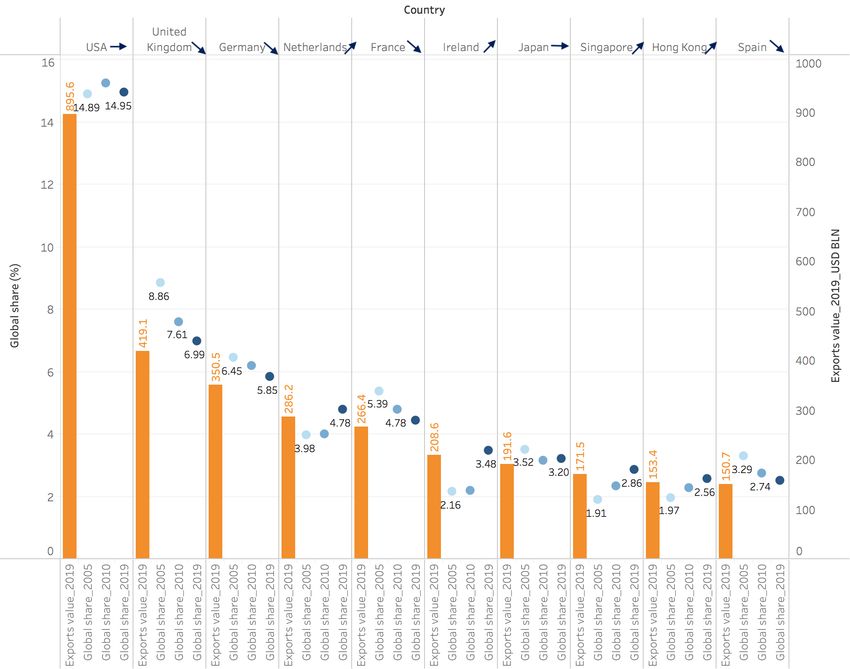
A first look at the flows of global services statistics reveals interesting patterns and dynamics,
illustrated in Figure 1. The UK is the 2nd largest exporter of services in the world, after the
global leader, the US, and the largest in Europe. The UK’s export of services in 2019 was 419
bln USD, followed closely by Germany, and about twice that of Ireland. However, it is clear
that the UK has been in relative decline, with its global share of exported services reducing
over time from 8.9% in 2005 to 7% in 2019. While a more mild decline is shared by Germany
and France, other countries in Europe have seen big rises, including the Netherlands and
Ireland. Appendix Table 1 reports the top 20 countries of global trade in services by value,
where China and India have grown their global share, together with other Asian nations such
as Singapore and Hong Kong.
 Figure 1: Top 10 largest services exporters

 Source: BaTIS.

What services does the UK export?
Figure 2 reports the sectoral composition of UK exports of services in 2019. Other business
services comprise almost one-third of all services exports in 2019, having grown over the last
decade to reach 135.9 bln USD, which includes research and development, professional and
management consulting services (legal, accounting, advertising), technical, trade-related and
other services (architectural, engineering and scientific). Another growing sector is

 15
telecommunications, computer, and information services, which gained 1.75 percentage points
over the last 14 years and in 2019 contributes 33 bln USD, corresponding to 7.93% of total UK
services exports. Intellectual property services have likewise seen a growth in importance,
reaching 26.7 bln USD, 6.37% of UK services exports, and Personal, cultural and recreational
services, worth 9.8 bln USD and Maintenance and repair services, worth 6.3 bln USD in 2019.
Construction services exports were worth 4.9 bln USD, maintaining more or less its proportion
in total UK exports of services, with slight growth. Similarly, Manufacturing firms contribute
the least in total services exports, still worth 3.1 bln USD in 2019, with an overall growing
trend.
 Turning to sectors with signs of decline, financial services are the second most
important type of services the UK offers, reaching 69 bln USD in 2019. Over time, though,
financial services have slightly lost their significance in total UK services exports, declining
from 19.4% in 2010 to 16.4% in 2019. Further, travel and transport services exports, which
together contributed 29% of total services exports in 2010, have also lost significantly and in
2019 had fallen to 24.2% of the total. Finally, government goods and services exports totalled
4.9 bln USD in 2019, seeing a slight decline in importance in their share of total services
exports.

 16
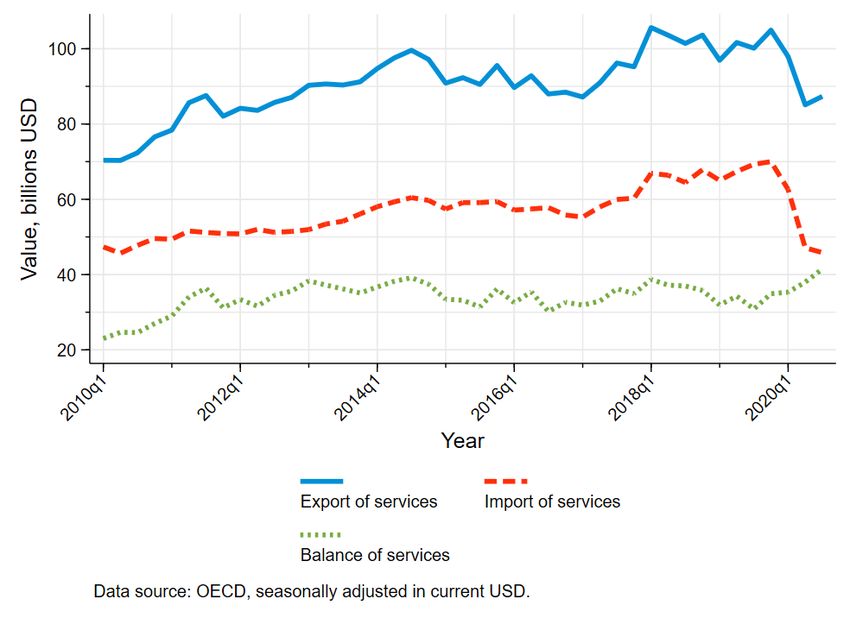
Figure 2: UK composition of services exports

Source: BaTIS.

Dynamics over time
Figure 3 shows UK’s aggregate quarterly services trade up until the second quarter of 2020.
UK exports of services have increased from 70 bln USD per quarter in 2010Q1 to 100 bln USD
in 2014Q2. Then there was a period of decline until 2017Q1, followed by a period of sharp
growth until 2018Q1. As expected, services exports fell sharply in 2020 due to the impact of
COVID-19, an episode that is beyond the scope of our analysis.

 17
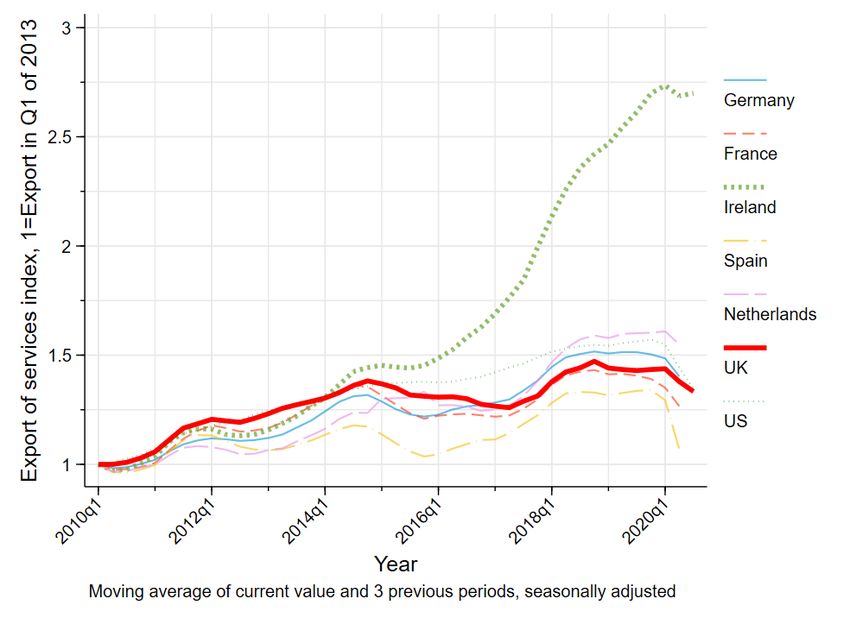
Services imports have been growing steadily over the whole period, before collapsing
in 2020. The services trade balance has been slowly growing as well, reaching 40 billion USD
per quarter in 2020Q2. This all seems well enough. But interestingly, as we will turn to next,
striking differences emerge as the uneventful overall pattern presented here is examined
alongside the UK’s peers.

 Figure 3: Dynamics of the UK quarterly services trade in 2010-2020

Comparison against other developed countries of the EU and US
To understand whether the performance of the UK’s services trade was strong, it should be
compared against the performance of its peers. Figure 4 reveals that the UK has been leading
in the global competition for services trade expansion until 2014Q1, when it was surpassed (in
relative terms) by Ireland. The differences in services export growth between Ireland and the
UK have been amplified and reinforced since 2016Q1. By 2020Q1, Irish services exports were
175% higher than at the beginning of the 2010s, while the UK’s services exports grew only by
40%. The UK’s growth has also been outperformed by Germany, the US, and the Netherlands.
 What may explain such stunning success of Ireland as a services exporter, next to the
rather mediocre performance of the UK? A reasonable hypothesis is that the UK’s Brexit

 18
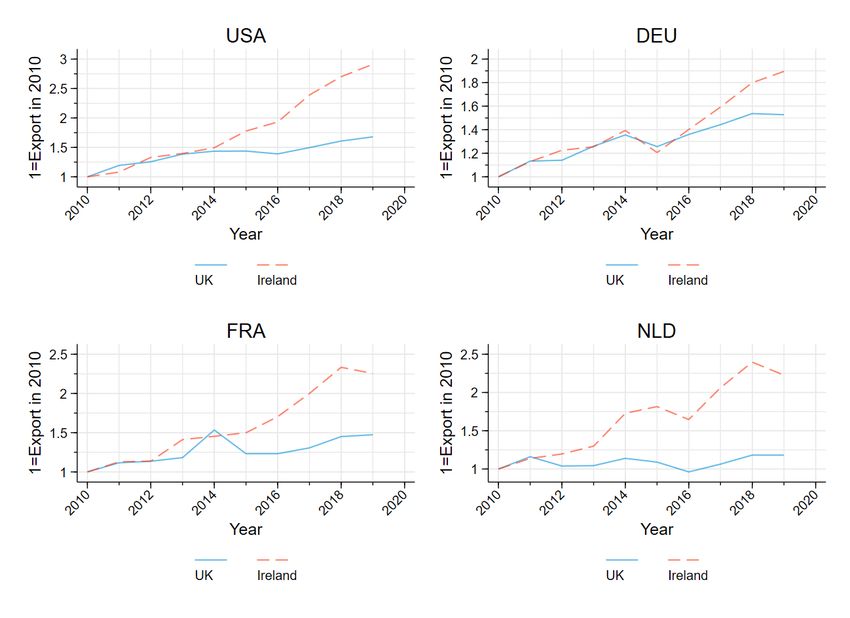
referendum might have triggered diversion of services from the UK to Ireland, which we will
test in this paper.

 Figure 4: International comparison of the UK services export

Source: OECD, quarterly data.

 We further compare the performance of Ireland and the UK in the largest services
destinations, presented in Figure 5. Until 2015 both countries performed similarly well in the
services markets of Germany, France, and the USA, while Ireland has been expanding its
services exports to the Netherlands faster than the UK. The major divergence has occurred in
2015-2016, when the rate of Irish expansion accelerated in all markets, while UK growth rates
either turned negative or remained very low. After 2016, UK services regained some mild
traction, but never matched Ireland’s growth rates. By 2019, Ireland had increased its exports
of services to the US almost threefold and more than doubled its exports to France and the
Netherlands. Expansion of the UK’s services exports has been modest, with the highest rate of
growth to the US, which by 2019 exceeded the levels at the beginning of the decade by slightly
more than 60%.

 19
Figure 5: Main services markets: comparing Ireland and the UK

Source: BaTIS.

 The success of Ireland may be due to differences in sectoral composition of services.
We consider whether the overall growth is driven by some services sectors in Figure 6. In 2010-
2014 the UK had performed better in the sector of insurance and pension services (SF), but
failed to sustain the momentum in 2015-2019. In financial services (SG) the UK expanded by
20%, while Ireland expanded by 55%. In telecommunications, computer, and information
services (SI) the UK grew by 50%, while Ireland by impressively more than 200%. In the
largest sector, Other business services, the UK grew by 50%, while Ireland by 175%. Since the
performance of Ireland has been better than the performance of the UK across different services
sectors, we can conclude that the better performance of Ireland in the major global markets was
not due to the differences in the mix of services between Ireland and the UK but was caused
by some common factors that affected all services sectors.

 20
Figure 6: Main services sectors: comparing Ireland and the UK

Source: BaTIS

 5. Methodology
Synthetic control method
The synthetic control (Abadie and Gardeazabal, 2003; Abadie et al, 2010) is a relatively new
method to estimate a policy impact, which is gaining popularity among researchers. It is
especially advantageous when there are few, often only one, treated units.
 Consider a policy that has an impact on an outcome "# in the first unit, among J units
of analysis (i.e. regions or countries). We have periods of observations on . A policy
intervention occurs at time % , where 0 < % < . Units 2,3,…,J are called the donor pool,
which is used to construct a counterfactual synthetic control (doppelganger) unit for the unit 1.
It represents a counterfactual economy that has the maximum resemblance with the unit 1, but
does not experience the intervention.
 The core of the synthetic approach is to select a vector of weights = ( , , . , … , 0 )′,
which are applied to the donor pool in a way that trace the outcome of interest Y in an optimal
way. The synthetic control estimator, which measures a counterfactual dynamic of the variable
of interest in the absence of treatment, 2 , is formally defined as

 21
 3 2 "# = ∑056, 5 5# ,
and the policy impact is given by
 ̂ = "# − 3"#2 .
In addition to the outcome of interest, for each unit j, there is a × 1 vector of k predictors of
the outcome, which is defined as = ( "5 , ,5 , … , @5 )′ . A × ( − 1) matrix =
( , , . … , 5 ), is the matrix of predictors for all untreated units. The weights are chosen to
resemble the unit 1 in terms of the pre-intervention values of the outcome and predictors as
given by
 @ %.O
 ,
 D| " − % |D = FG I J I" − , I, − ⋯ − 0 I0 L M ,
 I6"

where I is a positive weight, capturing relative importance of predictor ℎ. Following Abadie
and Gardeazabal (2003), I , ℎ = 1 … are chosen such that the mean squared prediction error
of the outcome variable is minimized for the pre-intervention periods.
 While statistical inference for this method is not well-developed, we have a fairly good
understanding of situations where the method may result in a biased estimate of the impact
(Abadie et al, 2020). Large unobserved transitory shocks, small numbers of pre-treatment
observations, or large size of the donor pool increase the bias bound. Also, large numbers of
predictors may also increase the bias. Certain steps can be taken to reduce the bias bound. The
donor pool must be selected with care (Abadie, 2020). The pre-treatment period can be split
into the training pool and validation pool. The training pool is used to fit the model, the
validation pool is used to choose appropriate weights for predictors.
 The method, as any other method, requires certain contextual and data assumptions to
be met, including large size of impact relative to transitory shocks, moderate volatility of
outcome, availability of a comparison group, no anticipation, no interference, sufficient pre-
and post-intervention information. With this regard, Brexit provides ample advantages for
researchers. It fits the definition of a natural experiment and meets most of the requirements
for the synthetic control method. The decision to launch the referendum was driven by mostly
political factors (Born et al., 2019) and its outcome was widely considered to be a surprise.
Further, the UK did not have a unique set of economic indicators that triggered the referendum
and there was no anticipation effect. At the same time, the outcome of the referendum had a
profound and economy-wide impact at the aggregate level, based on government forecasts for
the impact on welfare, confirmed by economic research (Dhingra et al., 2016, Jackson and
Shepotylo, 2018), was a negative, immediate devaluation of the British pound, impacts on GDP

 22
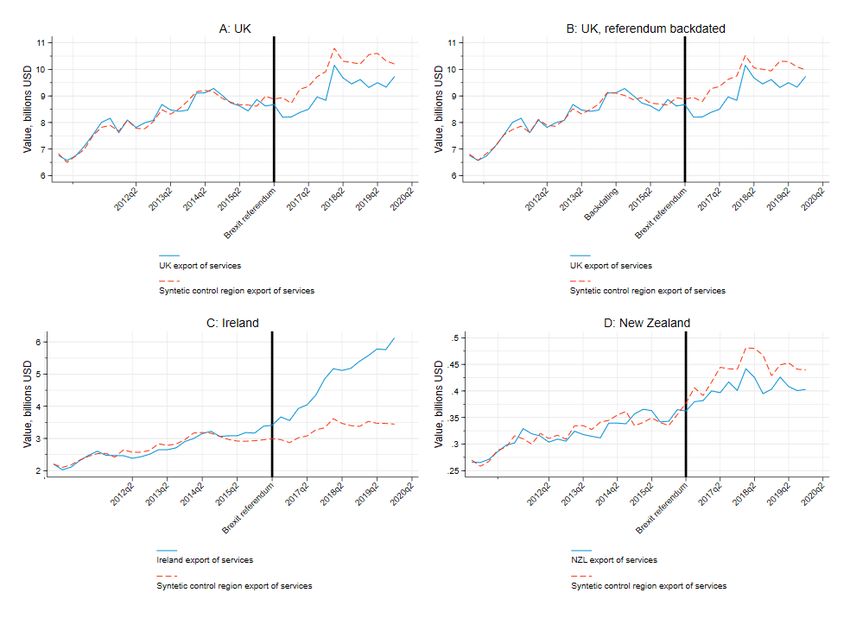
(Born et al., 2019) and regional development (Fetzer and Wong, 2020), FDI (Breinlich et al.,
2020), which means that the impact is likely to be large relative to transitory shocks.
 The economic outcome of Brexit is measured by the natural log of annual export of
services in 2010-2019. In addition to the outcome variable in the pre-treatment period, we
employ other predictors, that capture economic size, level of development, and role of services
in the economy. Use of additional predictors allows us to control reduce variance of the
unobserved predictors and reduce the bound on the bias (Abadie et al, 2020). In the baseline
model, the set of predictors includes the log of annual export of service in 2012-2015, the
natural log of GDP in current US dollars (average in 2010-2015), the natural log of GDP per
capita (average in 2010-2015), and the share of trade in services to GDP (average in 2010-
2015). Finally, we limit the observation period to 2010-2019, since the global financial crisis
of 2008-2009 brought deep structural changes to the global economy and to the UK in
particular. As a robustness check, we also consider annual data in 2005-2019.

 6. Analysis and findings
Synthetic control method with quarterly data
To test the hypothesis that Brexit has resulted in Ireland’s recent service trade boom, we
perform a synthetic control approach as described above. We calibrate the UK’s service trade
performance before the Brexit referendum in the 2nd quarter of 2016 against the performance
of a synthetic region constructed to behave like the UK in terms of a range of key indicators.
They include pre-Brexit referendum trends in services exports in the eight quarters prior to the
referendum, structure of the economy measured by the share of total services exports to GDP,
size of the economy measured by GDP, and the level of development measured by GDP per
capita. The performance of the synthetically constructed region is later compared against the
performance of the UK and Ireland after the event of the Brexit referendum.
 We first report the results using the aggregate trade flows of the quarterly data in
2010Q1-2020Q2, after removing seasonality from the series. Figure 7 Panel A demonstrates
that since the 2nd quarter of 2016, the UK has consistently underperformed against the
hypothetical synthetic UK, by exporting considerably less in services in all quarters. Between
the 3rd quarter 2016 and the 2nd quarter 2020, the average underperformance was estimated by
8.3% per quarter (approximately 8 billion USD) compared to the counterfactual scenario where
the UK did not vote for Brexit. At the same time, Ireland has experienced 34.8% higher levels
of exports per quarter (roughly extra 17 billion USD) as compared with its synthetic pair if
Brexit had not occurred (Panel C). The UK losses after the Brexit referendum are smaller than

 23
the Irish gains. It is likely that some of the Irish gains are due to some UK businesses relocating
to Ireland and the rest are due to long term growth.
 We also run two falsification tests presented in Panels B and D. First, we implement a
strategy which is called backdating, wrongly assigning the date of the referendum to the
2014Q2 (Panel B). We expect that the doppelganger UK’s exports of services should still
follow the same pattern as the actual UK data prior to the referendum. The synthetic control
country tracks actual UK exports in 2014Q2-2016Q2 reasonably well. The differences emerge
only after the actual Brexit referendum took place. Second, we implement a placebo test. In
panel D we consider how the Brexit referendum impacted the services exports of a country that
should not be impacted by it significantly. We have chosen New Zealand as our placebo test,
due to its remoteness from Europe, and at similar level of development to the UK. The results
presented indicate that even though New Zealand’s exports have diverged from the synthetic
double, the differences are very small in absolute terms.

 Figure 7: Synthetic approach method results on quarterly data in 2010-2020

Synthetic control method with annual data

 24
Quarterly data are subject to seasonality, which makes the construction of a synthetic peer more
difficult and susceptible to noise in the data. We present synthetic control analysis for the
annual data. The annual data ranges from 2010 till 2019. We limit the pool of potential
synthetic control countries to the OECD countries only, to reduce the bias bound and to make
it comparable to the quarterly analysis.23 We build a synthetic pair base on the services exports
patterns four years prior to the referendum, services export to GDP, GDP, and GDP per capita.
Table 1 presents summary of the balance of predictors for Ireland and the UK, which shows a
fairly good fit. Table 2 provides information about the donor pool weights for Ireland and the
UK. In both cases, the synthetic control is built using a limited number of countries from the
donor pool.

 Table 1: Predictor Balance

 UK Ireland
 Actual Synthetic Actual Synthetic
 Export of services 12.8 12.8 11.6 11.6
 GDP 28.6 28.9 26.2 26.2
 GDP per capita 10.7 10.8 10.9 11.1
 Share of services trade to GDP 0.202 0.201 0.951 1.239
 Note: Export of services, GDP and GDP per capita are all natural logarithms of values in current USD. Share of
 services trade is the ratio of trade in services to GDP.

 Table 2: Synthetic control weights

 Country Weight
 UK:
 Netherlands 0.47
 Spain 0.039
 US 0.491
 Ireland:
 Hungary 0.02
 Luxembourg 0.453
 Netherlands 0.488
 Turkey 0.039
 Note: The pool of donors include all OECD countries

 Results are reported in Figure 8. Our estimates suggest that the UK’s services exports
have been 9.2 % (36.7 bln USD) down per year on average since 2016 as a result of Brexit. By
contrast, Ireland’s exports have been above its synthetic pair by 23.6% (41 bln USD) per year

23
 Analysis, using the full sample as a pool of countries to construct a synthetic pair yields similar results.

 25
on average. For other countries, we do not observe such divergence of actual trade from the
synthetic pairs, as results for Germany, indicate. As a robustness check, we backdated the
Brexit referendum by 2 years (Panel GBR_back of Figure 8), which did not change our results.

 Figure 8: Synthetic control on annual data in 2010-2019

Inference
We follow Abadie et al (2010) to infer a measure of statistical significance in our results by
means of permutations. This is operated by iteratively re-assigning the treatment to each
country in the data, constructing a synthetic control outcome, and comparing its performance
against the actual one. The results for each country in the sample are compared against the
performance of Ireland and the UK. If the results in the previous section capture the effect of
the Brexit referendum, which had a large impact on services trade, then the difference in
services exports between the actual and synthetic control outcomes for the UK and any
countries that were affected by Brexit referendum results (Ireland) would stand out as
exceptional, while the running the same exercise for other countries would not pick up any
differences.

 26
We further present our results in several ways. First, we report the deviation of the
actual services export from its synthetic counterpart, ̂ = "# − 3"#2 , for each country we have
in our dataset.24 The result is presented in Figure 9. Strikingly, two countries that stand out as
having the large and persistent deviations are Ireland and the UK. It is remarkable that their
deviation patterns are almost mirror images of each other, matching in the opposite directions
changes in services trade values.

Figure 9: Permutation results

 We also compute the ratio of the root mean squared prediction errors (RMSPE) pre-
and post-treatment, as common in the literature (Abadie and Gardeazabal, 2003). It allows to
infer the statistical significance of the synthetic control method. In particular, we define
RMSPE for country j between time periods " and , as

 #V %.O
 1 ,
 5 J S , 5 L = T G J 5# − 35#2 L X
 , − " + 1
 #6#W
The ratio of the pre- and post-treatment forecast is given by

24
 After eliminating countries with missing values for GDP, GDP per capita, and share of services trade to GDP,
our sample consists of 179 countries. We further exclude US, because there is no convex hull of countries with
similar characteristics as US in terms of value of services export and GDP, which would allow to create the US
doppelganger.

 27
 5 (2016,2019)
 5 =
 5 (2010,2015)

Figure 9: Permutation results

Distribution of r is shown in Figure 9. Ireland has the highest r. There are 8 countries that have
r higher than the UK, including, in addition to Ireland, Barbados, Congo, Ethiopia, Iceland,
Israel, Slovakia, and Yemen. While African countries have low values of services exports and
high volatility, which leads to a high bound of the bias, the presence of Barbados and Ireland
may indicate that some UK businesses have chosen to relocate to those countries.25
 Finally, based on ranking of r, we can compute a so-called permutation test and its
corresponding p-value, which is the ratio of the number of countries with higher r relative to
the total number of countries. The null hypothesis is that the synthetic control outcome is not
statistically significant, while the alternative is the significant impact on the treatment on
outcomes. For the UK p-value is 0.045 and for Ireland is 0. Therefore, we conclude that both

25
 Some anecdotal evidence shows that UK businesses have the advantage of using Barbados as a gateway to the
Americas and the rest of the Caribbean, and this has attracted UK businesses post the Brexit Referendum. See
for example https://businessbarbados.com/industries/barbados-welcomes-uk-businesses-offers-gateway-
americas/.

 28
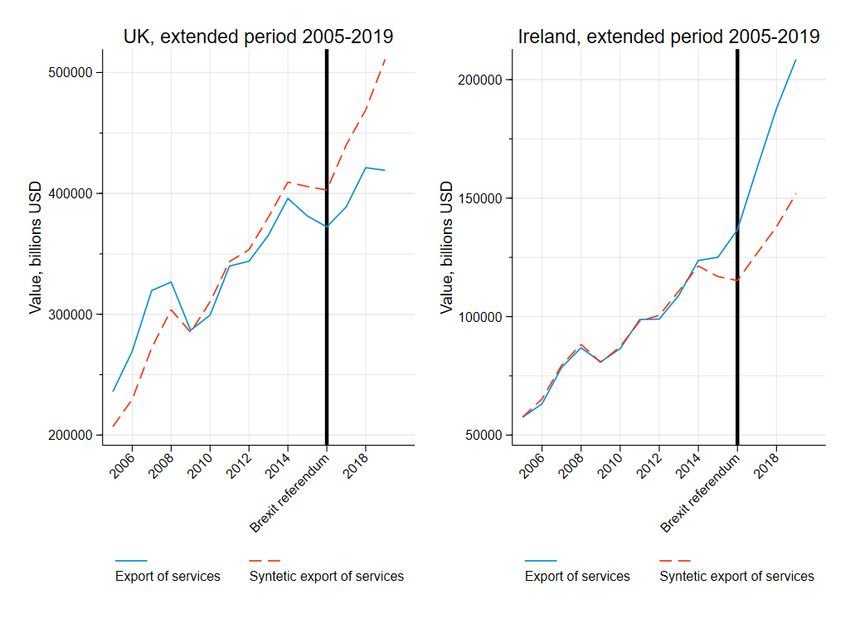
Ireland and the UK have experienced significantly higher volatility in the difference between
actual and synthetic control values of services exports since 2016.

 7. Robustness checks
Our strategy for testing the robustness of our findings are two-fold. First, we test if the trends
of the Brexit effects are robust to an extended sample. As literature on the synthetic control
approach points out (Abadie, 2020), the method crucially depends on the ability of the
doppelganger country to trace the performance of the actual country in the absence of treatment.
With this regard, the results are more robust and tend to have a lower bound of bias, when the
pre-treatment period is longer and the deviation between the doppelganger and actual data in
the pre-treatment period are smaller. Further, we employ difference-in-difference approach as
an alternative and complementary identification strategy to test the robustness of our findings.
It also allows us to compute more traditional t-tests for the significance of the treatment effects
and to estimate the effects by sectors. In addition, we carry out a placebo test for the difference-
in-difference analysis to further probe the soundness of our estimation.
Extended period for the synthetic control
Figure 10 reports the pre-trend test for a sample in 2005-2019, which shows that the services
trade of the UK in the pre-crisis period cannot be matched by its synthetic doppelganger, due
to the structural break that occurred in 2009. At the same time, the extended pre-treatment
period does not change our conclusion about the Brexit impact on services exports.
For Ireland, the value of services exports in the pre-treatment period matched very well, while
the post-treatment impact is likewise very strong.

 29
Figure 10: Using full sample

Difference-in-difference approach
The synthetic control method, although visually appealing and intuitive, does not allow to test
for statistical significance of the documented divergence for Ireland and the UK’s services
exports. Using an alternative empirical estimation strategy, we perform a difference-in-
difference analysis to investigate further the performance of the UK in the services sector
against global trends and main competitors. Using annual data in 2010-2019, we estimate the
following model specification:
 @
 S5,# = exp( × # + × S5 × # + S + 5 + S5 ) + S5@# , (1)

by Poisson pseudo maximum likelihood (PPML) method, which addresses zero export flows
and remaining unobserved heterogeneity in the data (Silva and Tenreyro, 2006). Our dependent
variable is export of services sector k from country i to country j at time t. Brexit is a binary
variable, which takes value of 1 if either reporter or partner is the UK. After is a variable that
takes value of 1 if year is 2016 or later and zero otherwise.26 We also control for countries

26
 Year 2016 also can be excluded from the sample or coded as After=0, which does not change results. See
Appendix A3 panel A, while panel b drops the year 2016 altogether.

 30
individual effects and for bilateral effect i,j to account for country-specific and bilateral-pair
specific characteristics of the reporter and partner country.
 The estimates of the coefficient reported in Table 3 measure the relative performance
of the UK in bilateral service trade after the Brexit referendum relative to the bilateral trade
between the other country pairs. Column (1) of the table presents the results for the aggregate
bilateral flows. The negative and significant coefficient suggests the Brexit referendum has
resulted in an average reduction in the UK services trade by 9.2% since 2016, after controlling
for the importing and exporting country and bilateral fixed effects.
 We now turn to the results by sectors. The first thing to note is that the negative effect
prevails across sectors, including Financial (SG, -16.5%)27, Travel and Transport sectors (SD,
-18.5% and SC, -14.8%), and IT (SI, -18.1%). In comparison, the decline is less in magnitude
and statistically insignificant in Other Business Services (SJ), Creative Services (SK) and
Intellectual Property Services (SH) sectors.
 These results do not directly indicate that the reported decline in the bilateral services
trade is due to the Brexit referendum. It may indicate that other factors - contributing to a
secular decline of the UK as a pre-eminent services economy, as the reduction in the global
share of of the UK’s services trade has been continuing since at least since 2005 - had
intensified after 2016. However, in that case we should not expect any significant effect of the
referendum on the services exports of Ireland. However, if Ireland gained in services exports
since 2016, it should be a factor that is present only after 2016 and does not affect other
countries to the same degree. To test this, we introduce the following model:
 @
 S5,# = exp( × # + " × S5 × # + , × S5 × # + S +

 5 + S5 ) + S5@# , (2)

 The results are presented in Panel B of Table 3. It shows that Ireland has indeed
disproportionally increased its trade with other countries since 2016. The aggregate trade
reported in column (1) has shown a positive and significant increase in trade by 43.9%. The
effect is positive and significant in Transport (SC, 24.3%), Intellectual Property Services (SH,
44.5%), IT (SI, 34.6%), and businesses services (SJ, 62%).
 The post-Brexit effects, captured by the result of the interaction of Brexit=1 and time=1,
remain consistent with the results in Panel A. The estimates of the coefficients display with the
same signs, significance, and similar magnitude. This results in a list of sectors in which the

27
 100 × (exp(0.153) − 1) = 16.5%.

 31
You can also read