FEEDBACK from the NGC7538 Hii region
←
→
Page content transcription
If your browser does not render page correctly, please read the page content below
Astronomy & Astrophysics manuscript no. ngc7538_sofia                                                                              ©ESO 2022
                                               January 17, 2022

                                                                           FEEDBACK from the NGC7538 Hii region
                                                 H. Beuther1 , N. Schneider2 , R. Simon2 , S. Suri1, 3 , V. Ossenkopf-Okada2 , S. Kabanovic2 , M. Röllig2 , C. Guevara2 ,
                                                                   A.G.G.M. Tielens4, 5 , G. Sandell6 , C. Buchbender2 , O. Ricken7 , and R. Güsten7

                                                    1
                                                        Max Planck Institute for Astronomy, Königstuhl 17, 69117 Heidelberg, Germany, e-mail: beuther@mpia.de
                                                    2
                                                        I. Physik. Institut, University of Cologne, Zülpicher Str. 77, D-50937 Cologne, Germany
                                                    3
                                                        University of Vienna, Department of Astrophysics, Türkenschanzstrasse 17, 1180 Vienna, Austria
                                                    4
                                                        Department of Astronomy, University of Maryland, College Park, MD 20742, USA
                                                    5
                                                        Leiden Observatory, Leiden University, PO Box 9513, 2300 RA Leiden, The Netherlands
                                                    6
                                                        Institute for Astronomy, University of Hawai‘i at Manoa, Hilo, 640 N. Aohoku Place, Hilo, HI 96720, USA
                                                    7
                                                        Max Planck Institute for Radioastronomy, Auf dem Hügel 69, 53121 Bonn, Germany
arXiv:2201.05532v1 [astro-ph.GA] 14 Jan 2022

                                                    Version of January 17, 2022

                                                                                                                ABSTRACT

                                                    Context. How do expanding Hii regions interact with their environmental cloud? This is one of the central questions driving the
                                                    SOFIA legacy program FEEDBACK. Here, we present a case study toward the prototypical Hii region NGC7538.
                                                    Aims. We want to understand the interaction of the NGC7538 Hii region with the neighboring molecular cloud that hosts several
                                                    active star-forming regions.
                                                    Methods. With the Stratospheric Observatory for Infrared Astronomy (SOFIA) we mapped an area of ∼21002 (∼125 pc2 ) around
                                                    NGC7538 in the velocity-resolved ionized carbon fine-structure line [CII] at 1.9 THz (158 µm). Complementary observed atomic
                                                    carbon [CI] at 492 GHz and high-J CO(8–7) data as well as archival near-/far-infrared, cm continuum, CO(3–2) and HI data are
                                                    folded into the analysis.
                                                    Results. The ionized carbon [CII] data reveal rich morphological and kinematic structures. While the overall morphology follows
                                                    the general ionized gas that is also visible in the radio continuum emission, the channel maps show multiple bubble-like structures
                                                    with sizes on the order of ∼80–10000 (∼1.0–1.28 pc). While at least one of them may be an individual feedback bubble driven by the
                                                    main exciting sources of the NGC7538 Hii region (the O3 and O9 stars IRS6 & IRS5), the other bubble-like morphologies may also
                                                    be due to the intrinsically porous structure of the Hii region. An analysis of the expansion velocities around 10 km s−1 indicates that
                                                    thermal expansion is not sufficient but that wind-driving from the central O-stars is required. The region exhibits a general velocity
                                                    gradient across, but we also identify several individual velocity components. The most blue-shifted [CII] component has barely any
                                                    molecular or atomic counterparts. At the interface to the molecular cloud, we find a typical photon-dominated region (PDR) with a
                                                    bar-shape. Ionized C+ , atomic C0 and molecular carbon CO show a layered structure in this PDR. The carbon in the PDR is dominated
                                                    by its ionized C+ form with atomic C0 and molecular CO masses of ∼0.45±0.1 M and ∼1.2±0.1 M , respectively, compared to the
                                                    ionized carbon C+ in the range of 3.6 − 9.7 M .. This bar-shaped PDR exhibits a velocity-gradient across, indicating motions along
                                                    the line-of-sight towards the observer.
                                                    Conclusions. Even if dominated by two nearby exciting sources (IRS6 & IRS5), the NGC7538 Hii region exhibits a diverse set of
                                                    sub-structures that interact with each other as well as with the adjacent cloud. Compared to other recent [CII] observations of Hii
                                                    regions (e.g., Orion Veil, RCW120, RCW49), bubble-shape morphologies revealed in [CII] emission, indicative of expanding shells,
                                                    are recurring structures of PDRs.
                                                    Key words. Stars: formation – ISM: clouds – ISM: kinematics and dynamic – ISM: bubbles – ISM: HII regions – ISM: individual
                                                    objetcs: NGC7538

                                               1. Introduction                                                           (Stratospheric Observatory for Infrared Astronomy) legacy pro-
                                                                                                                         gram FEEDBACK1 targets 11 galactic high-mass star-forming
                                               Stellar feedback in the form of radiation, winds and supernova            regions and Hii regions in the ionized atomic carbon fine-
                                               explosions can have positive as well as negative impact on their          structure line [CII] at 158 µm (1.9 THz) and the atomic oxygen
                                               environment. Positive feedback here is defined as inducing new            line [OI] at 63 µm (4.7 THz). The ionized carbon line [CII] is of
                                               star formation processes whereas negative feedback is meant as a          particular importance because it allows us to study the kinemat-
                                               destruction process of the natal cloud and by that limiting further       ics of the ionized gas as well as the interfaces with the molecular
                                               star formation. Feedback is important for the determination of            clouds. The [CII] line is a direct tracer of bubble/stellar feedback
                                               the physical processes within individual clouds but also crucial          kinematics (e.g., Pabst et al. 2020). Furthermore, the [CII] line
                                               in an integral sense for whole galaxies because it likely deter-          is one of the dominant cooling lines in the interstellar medium
                                               mines the general star formation efficiency (e.g., Matzner 2002;          at low to intermediate densities and UV fields (e.g., Hollenbach
                                               Elmegreen 2011; Hopkins et al. 2014; Geen et al. 2016, 2018;              & Tielens 1997; Röllig & Ossenkopf 2013). The FEEDBACK
                                               Kim et al. 2018).                                                         program started in spring 2019 and is still ongoing. More de-
                                                  With the goal to understand the impact of feedback processes
                                                                                                                         1
                                               onto the environment for individual resolved cases, the SOFIA                 http://feedback.astro.umd.edu

                                                                                                                                                                    Article number, page 1 of 22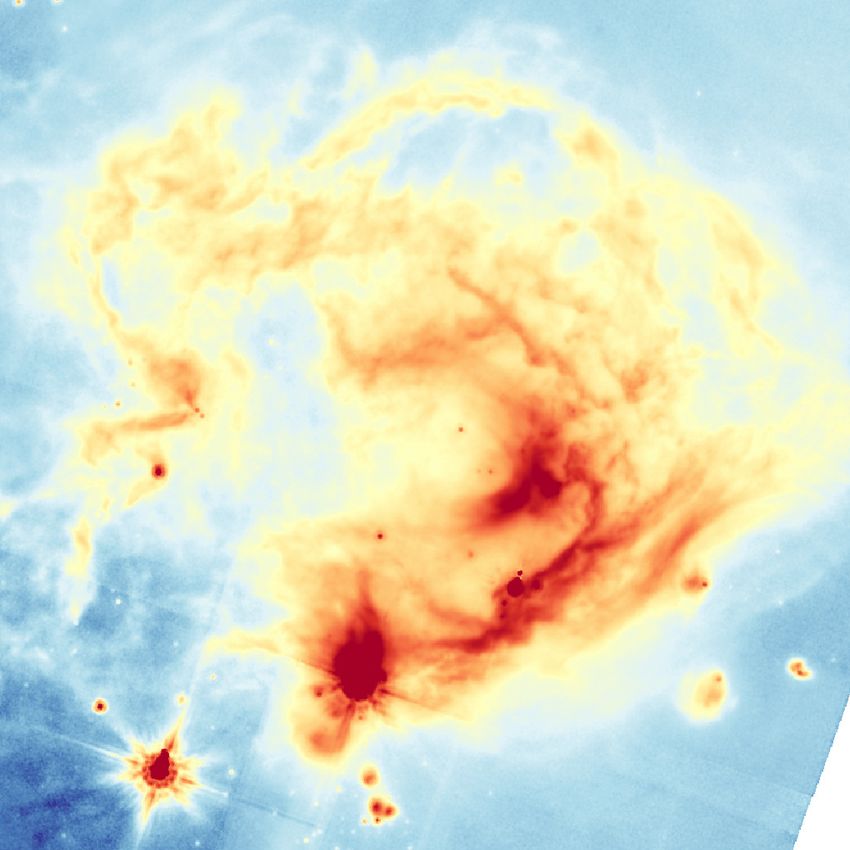
A&A proofs: manuscript no. ngc7538_sofia
tails about this SOFIA legacy program are provided in Schnei-
der et al. (2020). One outcome of the FEEDBACK project so
far is the detection of expanding shells in [CII] emission in vari-
ous bubble-shaped or bipolar Hii regions, i.e., in RCW120 (Luisi
et al. 2021, Kabanovic et al. in press), RCW49 (Tiwari et al.
2021), RCW36 (Bonne et al., subm.), and RCW79 (Zavagno et
al., in prep.). These shells were first detected in Orion A (Pabst
et al. 2019) and appear to be a ubiquitous phenomena. While
the regions RCW49 and RCW120 reveal second generation star
formation within these shells (Tiwari et al. 2021; Luisi et al.
2021), the expanding veil nebula in Orion shows little evidence
for dense clumps that could lead to star formation (Pabst et al.
2019; Goicoechea et al. 2020).
While an analysis of the whole sample will follow when all
data are taken, in the following, we concentrate on the prototyp-
ical Hii region NGC7538 shown at optical and cm continuum
wavelengths in Figure 1. The region is located at a distance of
2.65 kpc (Moscadelli et al. 2009) and has a physical extent of
several parsec. The two brightest sources exciting the Hii region
are IRS5 and IRS6 with spectral types of O9 and O3, respec-
tively (Puga et al. 2010, marked in Fig. 1). The Hii region is
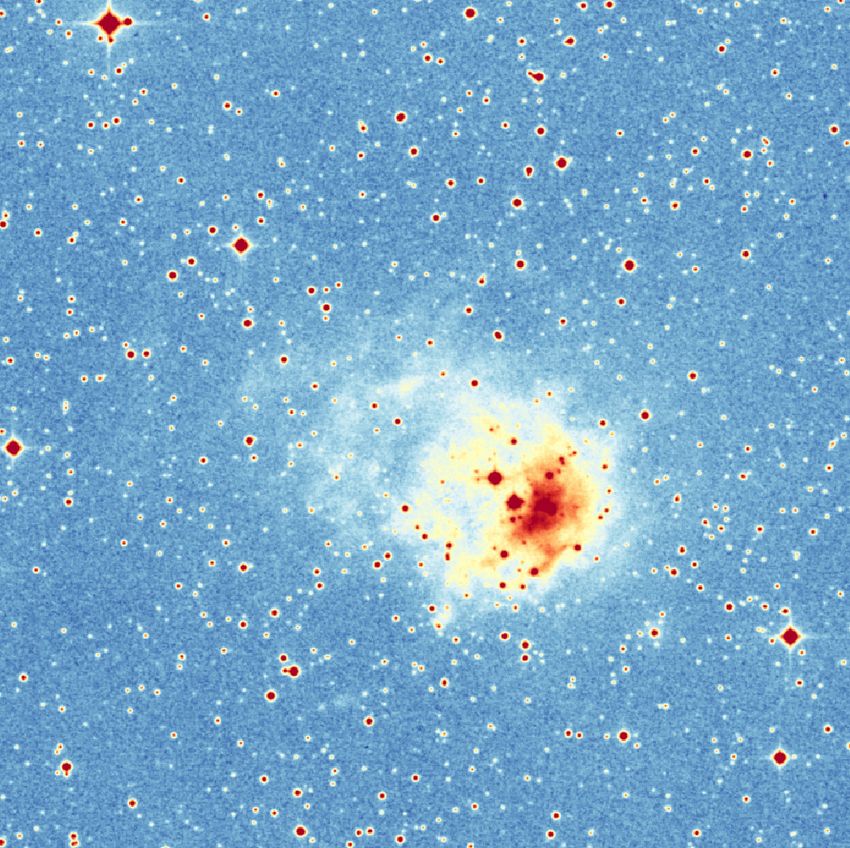
associated with several sites of active star formation, in partic- Fig. 1. Optical and cm continuum data of the NGC7538 region, encom-
ular in the south with the regions IRS1, S and IRS9 (marked in passing the field of view of our observations. The color-scale shows the
Fig. 1). Towards these southern star-forming regions, the Hii re- optical DSS2 (Digital Sky Survey v2) obtained with the red filter. The
gion appears to be sharply bounded, whereas in the northeast contours outline the 1.4 GHz cm continuum emission at 10 angular res-
the region shows diffuse emission extending well beyond the olution from the Canadian Galactic Plane Survey (CGPS, Taylor et al.
photon-dominated region (PDR) shell (Luisi et al. 2016). In a 2003). The two stars in the center of the Hii region mark the positions
recent study combining CO(3–2) and [CII] data, Sandell et al. of IRS5 and IRS6 from Puga et al. (2010). The three 5-pointed stars
(2020) characterized a large north-south outflow emanating from directly below the Hii regions show the positions of the active sites of
the southern star-forming core IRS1 with blue-shifted ionized star formation IRS1, S and IRS9.
carbon [CII] and molecular CO emission north of IRS1 in the
vicinity of the Hii region. Furthermore, Townsley et al. (2018) 2. Observations and data
show that diffuse X-ray emission is found toward the Hii region,
spreading even beyond the extend of the Hii region as determined 2.1. SOFIA observations
by, e.g., the cm continuum emission.
The region was mapped with the dual-frequency array hetero-
More generally speaking, the NGC7538 Hii region is em- dyne receiver upGREAT2 (Risacher et al. 2018) in the velocity-
bedded in a larger molecular cloud complex (e.g., Ungerechts resolved [CII] fine-structure line at 158 µm/1.9 THz3 . The [OI]
et al. 2000; Fallscheer et al. 2013). Figure 2 gives an overview 63 µm line was observed in parallel. Fast Fourier Transform
of various observed tracers. The cm continuum and 8µm emis- Spectrometers (FFTS) with 4 GHz instantaneous bandwidth
sion appears to stem dominantly from the Hii region. One should (Klein et al. 2012) resulted in a nominal spectral resolution for
keep in mind that 8µm emission is usually emitted in the cavity the [CII] line of 0.244 MHz or 0.04 km s−1 . The observations
walls of the Hii region where the poly-cyclic aromatic hydrocar- were done on two consecutive days during Cycle 7, on Decem-
bons (PAH) survive. In contrast to these features, the dense gas ber 12th and 13th 2019, with an average T sys single side-band
as traced by the Herschel dust continuum or CO(3–2) emission (SSB) of 4486 and 4580 K and an average precipitable water
is found more in the outskirts of the Hii region, in particular to- vapor of 6.2 and 3.6 µm respectively per day. The data were cal-
wards the south where the well-know star-forming regions IRS1, ibrated to the main beam brightness temperature intensity scale,
S and IRS9 are located. As will be discussed in more detail be- T mb , with the kalibrate task (Guan et al. 2012), part of the stan-
low, the new SOFIA [CII] data combine different worlds: They dard GREAT pipeline, with a forward efficiency of 0.97 and an
trace the PDR, and they also show strong emission features to- average beam efficiency of 0.66.
ward the active star-forming region IRS1 and a bar-like region Mapping was conducted in an on-the-fly (OTF) mode where
at the south-eastern interface of the Hii region with the dense the entire NGC7538 map was split into 4 tiles of roughly 43600
molecular cloud. Hence, the velocity-resolved [CII] data are the on each side. During scanning the data were better than Nyquist-
ideal probe to study the feedback processes and the kinematic sampled with a dump at every 5.200 . The final map size is
gas properties from the evolving Hii region on its neighboring 14.50 × 14.50 = 11.2pc × 11.2pc. Each tile should typically be
molecular cloud. observed 4 times with different scanning angles to reduce poten-
Specific topics we address with this study are the impact tial striping effects. In the case of NGC7538, three tiles were
from the expanding Hii region onto the environmental dense mapped to a deeper sensitivity whereas for the fourth north-
gas. Can we identify expanding [CII] shells or other dynamic western tile not all coverages were conducted so far. This results
features, either triggering or preventing new star formation 2
German Receiver for Astronomy at Terahertz. (up)GREAT is a de-
processes? Do we identify layered structures from a photon- velopment by the MPI for Radioastronomy and the KOSMA/University
dominated region (PDR)? What is the carbon budget between of Cologne, in cooperation with the DLR Institute for Sensorsystems.
ionized C+ , atomic C0 and molecular CO gas specifically at the 3
The CII 158 µm data are provided at the IRSA/IPAC Infrared science
Hii region/molecular cloud interface? archive https://irsa.ipac.caltech.edu/Missions/sofia.html.
Article number, page 2 of 22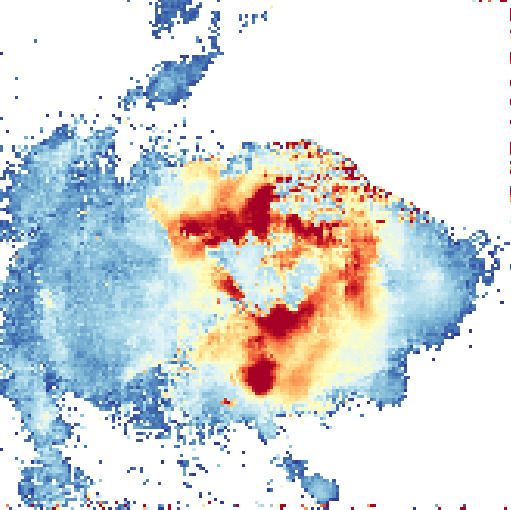
H. Beuther et al.: FEEDBACK from the NGC7538 Hii region

Fig. 2. Integrated intensity molecular and atomic line maps as well as continuum emission are presented in color-scale toward NGC7538. The
specific lines, integration ranges and continuum bands are labeled in each panel. The corresponding angular resolution is shown at the bottom-left
of the panels. The contours in most panels as labeled show the [CII] emission at only a few selected contour levels to highlight similarities and
differences. The contours in the bottom-middle panel outline the 1.4 GHz cm continuum emission from the CGPS. The three five-pointed stars
mark the positions of the embedded sources NGC7538IRS1, NGC7538S and NGC7538IRS9. The two stars in the middle show the positions of
the two main exciting sources of the Hii region NGC7538IRS5 and NGC7538IRS6. The bar-like PDR as well as a a linear scale-bar are presented
in the top-left panel.

in slightly increased noise in the top-right tile of the map and          Schmidt Telescope. The plates were processed into the present
residual striping quite apparent in Fig. 2. The data cubes used           compressed digital form with the permission of the institutions.
here have been resampled at a velocity resolution of 0.5 km s−1 to            The 1.4 GHz radio continuum and the 21 cm HI data are from
increase the signal-to-noise ratio. Our final velocity-resampled          the Canadian Galactic Plane Survey (CGPS, Taylor et al. 2003).
and grided data-cube has an angular resolution of 15.800 (corre-          The angular resolution of these data products is ∼ 10 . The 1σ rms
sponding to ∼0.2 pc linear spatial resolution). The 1σ rms over           of the continuum and line data are ∼ 0.5 K and 3 K in 0.82 km s−1
the well-covered 3/4 of the map are ∼0.9 K per 0.5 km s−1 chan-           channels, respectively.
nel on a T mb scale. The higher 1σ rms in the north-western tile              The 8 µm photometric emission mid-infrared data are ob-
is ∼1.9 K per 0.5 km s−1 channel.                                         tained with the IRAC camera (Fazio et al. 2004) on board of
     Furthermore, slightly smaller maps of the region were ob-            the Spitzer satellite (Werner et al. 2004) at an angular resolution
served in the atomic carbon fine-structure line [CI] at 492 GHz           of ∼ 200 .
and three CO transitions with J = 8 − 7, J = 11 − 10 and                      The 70 µm far-infrared data are observed with the PACS
J = 22 − 21. Here, we are concentrating on the lower-density              camera (Poglitsch et al. 2010) on board of the Herschel satellite
tracer [CI] as well as the CO(8–7) transition at 921.7997 GHz.            mission (Pilbratt et al. 2010) in the framework of the HOBYS
The [OI] 63 µm and higher-J CO lines, tracing higher densities            key program (Motte et al. 2010). The angular resolution is ∼
and temperatures, will be analyzed in forthcoming studies. The            5.600 .
angular resolution of the final data cubes for the [CI] and CO(8–             The Hα data were observed in the framework of “The
7) lines are 6300 and 4200 , respectively. The 1σ rms values for the      INT Photometric Hα Survey of the Northern Galactic Plane”
[CI] and CO(8–7) lines at 0.5 km s−1 are 0.7 and 1.4 K, respec-           (IPHAS) at an angular resolution of ∼ 1.100 (Drew et al. 2005).
tively.
                                                                          2.2.2. Herschel column density and CO(3–2) data
2.2. Complementary archival data                                          The Herschel gas column density map we use in this paper is a
2.2.1. Optical, mid-infrared, far-infrared and radio data                 higher angular resolution version (1800 ) of the one presented in
                                                                          Fallscheer et al. (2013). The map was produced by the HOBYS
We used the Digital Sky Survey version 2 (DSS2) to obtain an              (Herschel imaging survey of OB Young Stellar objects, Motte
optical image of the region in the red filter. The DSS2 digital           et al. 2010) consortium and will soon be publicly provided. The
images are based on photographic images obtained using the                column density map was determined following the HOBYS pro-
Oschin Schmidt Telescope of Palomar Mountain and the UK                   cedure, i.e., from a pixel-to-pixel spectral energy distribution
                                                                                                                     Article number, page 3 of 22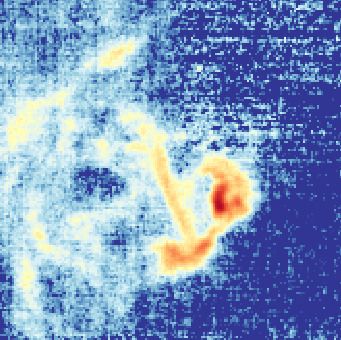
A&A proofs: manuscript no. ngc7538_sofia

Fig. 3. Overlays of selected pairs of emission tracers as described above each panel. The integration ranges for the atomic and molecular lines are
the same as in Fig. 2. The contour levels are chosen individually for each figure to highlight the emission best. The angular resolution elements for
both tracers are presented in the top-right of each panel. The five-pointed stars always mark the position of the embedded source NGC7538IRS1,
and the two open stars show the positions of the two main exciting sources of the Hii region NGC7538IRS5 and NGC7538IRS6. A linear scale-bar
is presented in the bottom-left panel.

(SED) greybody fit to the 160, 250, 350, and 500 µm wave-                   later also in Sandell et al. (2020). Following Fallscheer et al.
lengths observations. There were no 100 µm maps available and               (2013), the typical 1σ rms in 0.42 km s−1 channels is 0.6 K on
the 70 µm data are not included because the interest lies in the            a T A∗ scale. Using a beam efficiency of 0.644 , the data are con-
distribution of the cold molecular gas. For the SED fit, we fixed           verted to main beam brightness temperature for the quantitative
the specific dust opacity per unit mass (dust+gas) approximated             analysis. The beam size of these data is ∼ 1500 .
by the power law κν = 0.1(ν/1000GHz)βd cm2 /g with βd =2, and
left the dust temperature and column density (atomic and molec-
ular gas, in the following we refer to that as gas column den-              3. Results
sity) as free parameters (see, e.g., Russeil et al. 2013 for more
                                                                            3.1. Spatial structures
details). The procedure explaining how high angular resolution
maps were obtained is described in detail in Appendix A of                  As indicated in the Introduction, the [CII] emission in the
Palmeirim et al. (2013). The concept is to employ a multi-scale             NGC7538 complex traces the large-scale PDR as well as the
decomposition of the flux maps and assume a constant line-of-               PDR associated with denser star-forming molecular gas at the
sight temperature. The final map at 1800 angular resolution is              edge of the Hii region. To be more specific, Fig. 2 shows the
constructed from the difference maps of the convolved SPIRE                 integrated emission of several tracers, and in particular the mor-
maps (at 500, 350, and 250 µm) and the temperature informa-                 phology of the [CII], the 8 µm and 70 µm emission is very sim-
tion from the color temperature derived from the 160 to 250 µm              ilar. The ionized gas as traced by the Hα and 1.4 GHz emission
ratio.                                                                      is confined to the real Hii region, and the [CII], 8 µm and 70 µm
                                                                            emission partly wrap around that (bottom-right panel of Fig. 2).
  The CO(3–2) data were obtained with the James Clark                       While the [CII] line can form in PDRs as well as molecular
Maxwell Telescope (JCMT) as part of a large map of the
                                                                            4
NGC7538 region first presented in Fallscheer et al. (2013) and                  https://www.eaobservatory.org/jcmt/instrumentation/heterodyne/harp/

Article number, page 4 of 22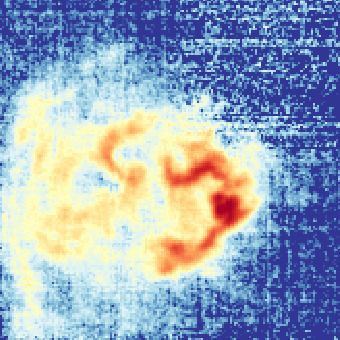
H. Beuther et al.: FEEDBACK from the NGC7538 Hii region

Fig. 4. Moment maps of the [CII] emission. The left, middle and right panels present in color scale the integrated emission and the 1st and
2nd moment maps (intensity-weighted peak velocities and intensity-weighted velocity dispersion) in the velocity range from -75 to -40 km s−1 ,
respectively. The noisier top-right quarters of the 1st and 2nd moment maps are blanked (see Sect. 2). The contours in the middle and right panels
show the integrated [CII] emission from the left panel at only a few selected contour levels to highlight similarities and differences. The three
five-pointed stars in the left panel mark the positions of the embedded sources NGC7538IRS1, NGC7538S and NGC7538IRS9. The two stars
show the positions of the two main exciting sources of the Hii region NGC7538IRS5 and NGC7538IRS6. A linear scale-bar is presented in the
left panel. The markers in the middle and right panels highlight additional positions (see main text) toward where we extracted spectra in Fig. 5.
The line in the middle panel outlines the pv-cut from IRS6 through the bar-like structure presented in Fig. 13.

media, diffuse 8 µm emission typically stems from UV-pumped               3.2. Kinematic structures
infrared fluorescence from Polycyclic Aromatic Hydrocarbon
(PAH) molecules within photon-dominated regions (PDRs). The               To get a first proxy of the dynamics, Fig. 4 presents the integrated
dense gas tracers (gas column densities from dust continuum and           [CII] emission as well as the 1st and 2nd moment maps of the
CO(3–2), bottom panels in Fig. 2) emit dominantly in the south            [CII] data (intensity-weighted peak velocities and velocity dis-
and south-west of the region. We note that toward the largest part        persion). The 1st moment map (middle panel of Fig. 4) reveals
of the [CII] emission the CO(3–2) line does not show significant          a general velocity gradient approximately from east to west over
self-absorption features (see spectra discussed below). The asso-         the entire extend of the Hii region. On top of the overall velocity
ciated emission toward the young embedded star-forming region             gradient, one can identify several blue-shifted emission regions
IRS1 as well as the bar-like PDR features are visible in all trac-        in the middle of the map. In comparison to that, the 2nd moment
ers shown in Fig. 2. In addition to this, some dense gas structures       or velocity dispersion map shows over large parts of the map
can also be found in the north-eastern part of NGC7538.                   rather uniformly low values below 5 km s−1 . However, on top of
                                                                          that, one can clearly identify an almost ring-like structure with
                                                                          larger velocity dispersion on the order of 10 km s−1 . As will be
     To show spatial similarities and differences in a bit more de-       discussed below, these regions of apparent large velocity disper-
tail, Figure 3 presents a compilation of different pairs of tracers       sion are largely caused by multiple velocity components in the
always as contour maps overlaid on color-maps. We added here              [CII] spectra.
the higher excited CO(8–7) line (Eu /k = 199 K compared to                    For a more detailed analysis of the kinematics, it is crucial
Eu /k = 33.2 K for the (3–2) transition) as well as the atomic            to look at individual spectra, and we selected several positions
carbon fine structure line [CI] at 492 GHz. The top-left and top-         in the region for further analysis. We labeled them as follows,
middle panels confirm that the [CII] and 8 µm emission agree              and they are all marked in Fig. 4:
very well and appear to at least partially wrap around the ion-
ized gas (see also bottom-right panel of Fig. 2). A comparison
of the two CO transitions in the top-right panel shows that in            - IRS5: one of the main exciting source of the Hii region
the south-western bar-like emission structure, the higher excited         - IRS1: the densest star-forming core
CO(8-7) transition emits closer to the two exciting sources at the        - MOB: a position in the middle of the bar-like PDR
center of the Hii region than the lower excited CO(3–2) transi-           - BlPN: blue peak in the north in the 1st moment map
tion. Similar layered structures within the bar can be identified         - BlPS: blue peak in the south of the 1st moment map
between atomic and ionized carbon ([CI] and [CII], bottom-left            - RPC: red peak in the center of the 1st moment map
panel of Fig. 3) as well as between the CO(8–7) and [CI] maps.            - RPE: red peak in the east of the 1st moment map
In comparison to those layered structures, spatial morphologies           - BrPN: broad emission in the north in the 2nd moment map
of the higher excited CO(8–7) and ionized carbon [CII] lines              - BrPS: broad emission in the south in the 2nd moment map
agree much better in the bar. This is a typical PDR layered struc-
ture in [CII]/[CI]/CO as well as in CO(8-7) and (3-2). We will                Figure 5 presents the corresponding [CII] spectra as well
come back to this in section 4.2.                                         as the molecular and atomic counterparts in the CO(3–2) and
                                                                                                                     Article number, page 5 of 22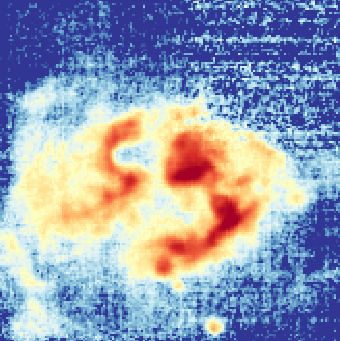
A&A proofs: manuscript no. ngc7538_sofia

Fig. 5. [CII] (black), CO(3–2) (red) and [CI] (teal, multiplied by 2) spectra towards the positions marked in Fig. 4. The green lines show Gaussian
fits to the [CII] and CO(3–2) data. The numbers present the corresponding FWHM values (“*/*” labels two components). The positions are labeled
in each panel. The RPE position to the east is not covered by the [CI] map.

[CI] lines5 . Where possible we fitted Gaussians to the [CII]              [CI] emission. The rms values for these two lines (section 2) cor-
and CO(3–2) spectra, at several positions also two components.             respond at 30 K to 3σ column density sensitivities (see section
While self-absorption may explain smaller dips in some spec-               4.3 for details on the calculations) of N(CO) ≈ 2.1 × 1016 cm−2
tra, the two velocity components fitted here are typically that far        and N(C0 ) ≈ 2.7 × 1016 cm−2 per channel (0.42 and 0.5 km s−1
separated in velocity space that they should indeed be separate            for CO(3–2) and [CI], respectively). This second component can
components. The corresponding full width half maximum val-                 also be identified towards IRS5 and BlPS. Hence, the ring-like
ues (FWHM) in km s−1 are also shown in Fig. 5. Interestingly,              high velocity dispersion structure seen in the 2nd moment map
the only almost simple, single-Gaussian spectrum is identified             of [CII] (Fig. 4, right panel) is in fact not a region of particularly
toward the position in the middle of the bar (MOB, top-right               high velocity dispersion but there we have two velocity compo-
panel in Fig. 5). We will get back to that structure in section 4.2.       nents mimicking high values in the 2nd moment map. The pe-
The spectra toward the infrared sources IRS5 and IRS1 as well              culiar aspect of this additional velocity component is that it is
as the red-shifted peak in the east of the region (RPE) show some          mainly detected in the ionized carbon [CII] line without a strong
velocity structure, but no particularly prominent features.                molecular or atomic counterpart being detectable in the individ-
     This is very different in the remaining five spectra towards          ual spectra. However, Sandell et al. (2020) detected a north-south
the other blue- and red-shifted positions in the center of the maps        outflow in CO(3–2) and [CII] emission (their [CII] map is cen-
(BlPN, BlPS, RPC) as well as towards the positions with partic-            tered on IRS1 and smaller than the one presented here) emanat-
ularly broad velocity dispersion (BrPN, BrPS, Figs. 4 and 5).              ing from IRS1 where the blue-shifted emission is located north
While the main emission from the NGC7538 region is typically               of IRS1. The positions BlPN, BlPS, RPC, BrPN, and BrPS are
in the velocity range with respect to the local standard of rest           all in the general vicinity of that outflow. In particular, the mor-
(vLSR ) between -60 and -50 km s−1 , these positions show addi-            phology of the blue-shifted [CII] and CO(3-2) gas emission near
tional strong emission at even more negative velocities beyond             IRS1 (corresponding roughly to our position BlPS) is similar.
-60 km s−1 . In particular, the spectra toward BlPN, RPC, BrPN             Hence, the blue-shifted gas we find may at least partly be asso-
and BRPS exhibit a second, clearly separated velocity compo-               ciated with that large-scale outflow. Nevertheless, in the spectra
nent in the [CII] emission that has barely any detectable counter-         extracted at individual positions as shown in Figure 5, the blue-
part in the molecular emission of the CO(3–2) line or the atomic           shifted gas is much stronger in the [CII] spectra than in the more
                                                                           commonly as outflow tracer observed CO emission. We will get
 5
   Fig. A.1 in the Appendix presents a more extended grid of spectra in    back to this component in Section 4.4.
the [CII] and CO(3–2) lines.

Article number, page 6 of 22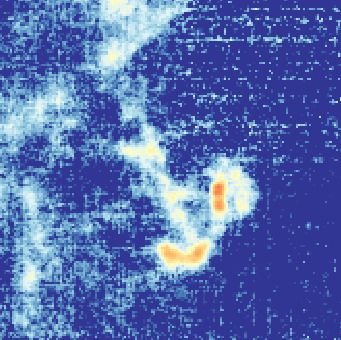
H. Beuther et al.: FEEDBACK from the NGC7538 Hii region

Fig. 6. [CII] channel map for the velocities labeled in each panel. The data are binned for that plot in 2 km s−1 channels. The two purple stars mark
the positions of IRS1 and IRS5, and a scale-bar is shown in the top-left panel. The intensities are always plotted logarithmically from 1 to 40 K.
The purple circles outline potential bubbles. These bubbles are labeled in the top-left panel. A version without any suggested bubble structures is
presented in the Appendix in Fig. A.2.

    To look at the velocity structures in a different fashion, Fig. 6       shell accelerating also the atomic gas envelope in the direction
presents a channel map of the [CII] emission in NGC7538 (a                  of the observer. The red-shifted absorption at ∼ −45 km s−1 can-
version without any suggested bubble structures is presented                not be the other side of the expanding shell because in absorption
in the Appendix in Fig. A.2). While in this representation the              spectroscopy it has to lie in front of the ionized gas. Hence, the
main emission of the PDR associated with the Hii regions is                 red-shifted HI absorption must be related to some foreground
also dominant approximately between -60 and -50 km s−1 , there              gas. Since there is barely any [CII] nor CO emission at these ve-
are considerable extended emission structures at blue-shifted ve-           locities, that component may even be unrelated to the NGC7538
locities < −60 km s−1 , and to a lesser degree also at red-shifted          Hii region.
velocities > −50 km s−1 . For comparison, Figure A.3 in the ap-
pendix presents the corresponding CO(3–2) channel map where                     Looking a bit outside the actual Hii region towards the east
especially these more blue- and more red-shifted features are               (position RPE, middle panel of Fig. 7), the HI emission spec-
barely recognizable. The [CII] channel map gives the impression             trum is broader than what we observe in [CII] and CO. This can
of several bubble- and ring-like structures that may stem even              be understood in a way that HI is more easily excited than [CII]
from several star formation events. We will discuss the bubble-             and CO, and hence can pick up more tenuous gas at higher ve-
features and their possible interpretation in more detail below in          locities. Furthermore, at the velocity of the [CII] and CO(3–2)
Section 4.1.                                                                peak emission, the HI shows a dip in the spectrum which may
    In addition to the molecular CO, atomic [CI] and ionized car-           be caused by HI self-absorption (HISA, e.g., Gibson et al. 2005;
bon [CII] emission, we can also investigate the atomic hydrogen             Syed et al. 2020).
by means of the 21 cm line observed with the Canadian Galactic
Plane Survey (CGPS, Taylor et al. 2003). As expected, towards                   Furthermore, if we look towards positions where we clearly
the main Hii region around the exciting sources IRS5 and IRS6,              identify two components in the [CII] emission, e.g, the position
the HI is seen only in absorption. One clearly identifies a strong          BlPN in the north of the Hii region (bottom panel of Fig. 7), it
HI absorption component associated with the high-velocity blue-             may at first sight be surprising that the strong blue-shifted [CII]
                                                                                                                    1
shifted gas < −60 km s−1 , but the main velocity component of the           component at velocities < −60 km s is inconspicuously weak
region around −55 km s−1 exhibits only weak absorption. The                 in the HI emission. One potential explanation for that could be
blue-shifted HI absorption should be related to the expanding               that the radiation field may be that strong that most of the gas is
                                                                                                                       Article number, page 7 of 22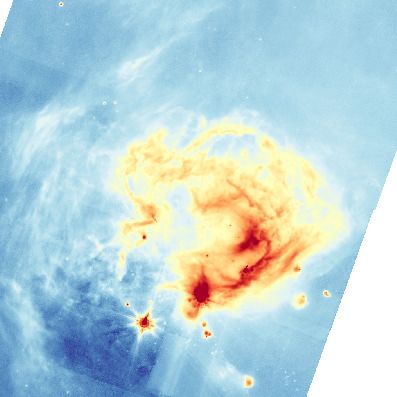
A&A proofs: manuscript no. ngc7538_sofia

ionized hydrogen and carbon with just a thin layer of neutral HI            overlap of mainly structures A to C, and we do not consider that
and molecular gas in the surrounding molecular cloud.                       further as a separate physical entity. Uncertainties for the central
                                                                            positions and radii are also discussed in appendix B.
                                                                                For comparison, the ring/bubble candidates are also plot-
                                                                            ted on the 8 µm emission that mainly stems from PAHs emitted
                                                                            in PDRs (Fig. 8). Several of the ring/bubble-like structures can
                                                                            clearly be seen in this PAH emission.

                                                                            Fig. 8. The color-scale shows the 8 µm emission, and the purple circles
                                                                            again outline the tentative bubble structures.

                                                                                 The suggested bubble A is best visible as limb-brightened
                                                                            rings in the channels between -65 and -59 km s−1 . An additional
                                                                            indicator that this bubble may indeed be a real physical structure
Fig. 7. [CII] (black), CO(3–2) (red) and HI (blue, divided by 10) spectra
towards three selected positions marked in Fig. 4. These are IRS5, the
                                                                            is that at the most blue-shifted velocities (channel at -69 km s−1 ),
red-shifted peak towards the east (RPE), and the blue-shifted peak in       the emission is mainly at the center of this proposed bubble A.
the north (BlPN). The positions are labeled in each panel.                  This is exactly what one expects when this bubble is expanding
                                                                            along the line of sight (see also appendix B), and was shown also
                                                                            for RCW120 (Luisi et al. 2021).

4. Discussion                                                               Position-velocity analysis: A different way to visualize the ve-
4.1. Expanding bubbles or an inhomogeneous medium?                          locity structure of bubble A is via a position-velocity cut. Figure
                                                                            9 presents three vertical pv-diagrams in the [CII] line through the
Bubble/ring identification: As indicated in section 3.2, the                center of bubble A and shifted 10 to the east and west, respec-
channel map of the [CII] emission shows several ring-like struc-            tively. Corresponding horizontal pv-diagrams are presented in
tures by eye-inspection (four rings are outlined in 6 as magenta            the appendix in Fig. A.4. While most velocities along these cuts
circles). These features can be limb-brightened edges of expand-            are between −50 and −60 km s−1 , there is clearly high-velocity
ing shells or bubbles, but they could also be a ring or torus in            blue-shifted gas around ∼ −70 km s−1 close to the center of the
the plane of the sky. Before we discuss their velocity structure in         bubble, indicating an expanding structure along the line of sight.
more detail, we apply an unbiased automized ring identification             Figures 9 and A.4 also show the shape a spherical shell with
by computing the covariance between the map and annuli struc-               a radius if 10000 and an expansion velocity of 14 km s−1 would
tures of varying radii. The details of the identification analysis          have in such a pv-diagram. This is not a fit but just outlining
are presented in appendix B.W e stress that the bubbles/rings               how such a shell would appear as an ellipse in the pv-diagram.
discussed below are only candidates for real physical structures            The left and right panels with pv-cuts at offsets of 10 correspond
that may stem from the expansion of the Hii region. The bubble-             in a shell geometry to angles of ∼36 deg (see a sketch of such
or ring-like structures we identify this way have central positions         a geometry in appendix A.2 from Butterfield et al. 2018). The
(in J2000.0) and approximate radii r of:                                    velocities at such angle are then reduced by cos(36◦ ). While the
(A) R.A.=23h13m38s, Dec=61◦ 320 2000 ; r ∼ 10000 ∼1.3 pc                    data and toy model at negative blue-shifted velocities show some
(B) R.A.=23h13m38s, Dec=61◦ 300 1200 ; r ∼ 10000 ∼1.3 pc                    resemblance of each other, consistent with a spherical half-shell,
(C) R.A.=23h13m46s, Dec=61◦ 310 0000 ; r ∼ 10000 ∼1.3 pc                    the red-shifted side at positive relative velocities shows no indi-
(D) R.A.=23h13m55s, Dec=61◦ 310 5600 ; r ∼ 8000 ∼1.0 pc                     cation of such a shell-like geometry. This could either indicate
As outlined in appendix B, the approach identifies even a fifth             that such a shell model is insufficient, or the center of the shell
ring-like structure (labeled E), however, that appears rather as an         could be close to the rear side of the cloud that only blue-shifted
Article number, page 8 of 22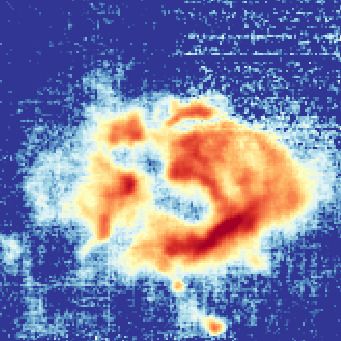
H. Beuther et al.: FEEDBACK from the NGC7538 Hii region

Fig. 9. Vertical position-velocity cuts through bubble A from south to north derived from the [CII] line emission. The central panel goes through
the estimated central position of A whereas the left and right panels are shifted 10 to the east and west, respectively. The white dashed line marks
the approximate center of the bubble. The black dotted lines in the middle panel outline the elliptical shape a spherical shell with radius 10000 and
expansion velocity of 14 km s−1 would have in the pv diagram. The dotted lines in the left and right panel correspond to the same expanding shell
at the 10 shift to the east and west where the 10 corresponds to ∼36 deg offset in the sphere (e.g., Butterfield et al. 2018, sketch in their appendix
A.2). Hence the velocities are then reduced by cos(36◦ ).

gas moving towards the observer can be detected while the red-              between −57 and −53 km s−1 . In addition to the bubble edges,
shifted expansion leaves the cloud almost immediately that no               structure D again shows high-velocity gas at its center, typ-
gas gets accelerated to a detectable level. In that context, Luisi          ically signposting expanding structures. These centered emis-
et al. (2016) estimated that approximately 15% of the ionized               sion structures in bubble D are best visible in the blue-shifted
gas is leaking outside of the Hii region.                                   channels at −67/−65 km s−1 and in the most red-shifted channels
     The structure B is centered close to the main excitation               at −49/−47 km s−1 . For comparison, Fig. 11 presents the corre-
sources in the region, IRS5 and IRS6 (Fig. 1). But we note that             sponding vertical and horizontal pv-cuts through the central po-
the automated bubble-identification approach does not center it             sition of structure D. In contrast to the pv-diagrams of bubbles A
exactly on the excitation sources but a bit shifted. Bubble B’s             and B (Figs. 9 and 10) that show the high-velocity gas mainly at
border at the south-western side is roughly the bar-like PDR dis-           negative blue-shifted velocities, the pv-diagram of structure D,
cussed in section 4.2. In the north, structures visible in particu-         in particular the one in vertical direction (right panel in Fig. 11),
lar at velocities of −55/−53 km s−1 delineate the potential sphere          shows an almost ring-like structure with high velocities on the
of that bubble. Doing position-velocity cuts in the horizontal as           blue- and red-shifted side, in good agreement with the channel-
well as vertical direction through this bubble B and source IRS5            map discussed before. For comparison, we again show the shape
(Fig. 10), one also finds that the highest-velocity gas on the blue-        an expanding shell with radius 8000 and an expansion velocity of
as well as red-shifted side is found close to IRS5. This is again           6 km s−1 .
indicative of expanding motions along the line of side, poten-
tially caused by IRS5 and IRS6. We again draw the correspond-               Driving sources: It is interesting to note that the ring-like struc-
ing shapes for expanding shells into the pv-diagram (Fig. 10).              ture of high velocity dispersion in the [CII] moment map (Fig. 4)
While the radius of 10000 is given by our shell-identification ap-          roughly coincides with the combined outline of the four bub-
proach above, the velocities on the blue- and red-shifted side dif-         ble/ring structures discussed here (Fig. 6). Since the high ve-
fer significantly. To outline those differences, we used an expan-          locity dispersion in Fig. 4 largely stems from several velocity
sion velocity of 10 km s−1 for the blue-shifted side, and 3 km s−1          components (Fig. 5), these velocity signatures may stem from
for the red-shifted side. If the observed structure really belongs          expanding motions from the Hii region. While for bubble B, the
to an expanding shell, such velocity differences would indicate a           driving source for bubble expansion may be the main exciting
highly inhomogeneous medium where the red-shifted expansion                 sources of the Hii region (IRS5 and IRS6, Puga et al. 2010),
would enter into much denser material. Another option is that               this is less obvious for the other structures A, C and D. For these
the central velocity is not −55 km s−1 but a few km s−1 higher.             three structures, we have not identified a clear central source that
In that case, we would just have a blue-shifted bubble-structure            could be associated with bubble expansion. While Puga et al.
without any red-shifted counterpart, similar to structure A dis-            (2010) identified more young stellar objects in the environment
cussed before. That would put the center of structure B also on             of the Hii region, they are not at the bubble centers (which in
the rear side of the cloud.                                                 fact IRS5 and IRS6 are not exactly either), and furthermore are
     The identified structure C is in-between the other bubble/ring         typically of lower luminosity. Also Spitzer data do not allow us
structures. While it may be a real physical entity, it could also           to identify clear driving sources.
arise from an overlap of the other bubble/ring structures. There-               While the O3 and O9 stars IRS6 and IRS5 (Puga et al. 2010)
fore, we omit further detailed discussion for that structure.               are most likely the main exciting sources of the Hii region, the
     Furthermore, we identify structure D where the limb-                   identification of several more ring- or bubble-like structures does
brightened ring-like features are best delineated in the channels           not necessarily mean that there are more bubble-driving sources
                                                                                                                        Article number, page 9 of 22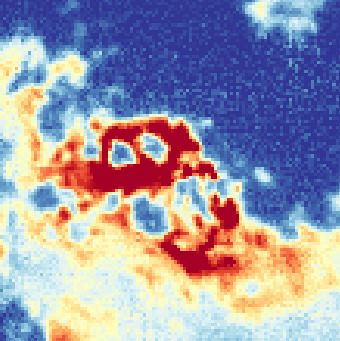
A&A proofs: manuscript no. ngc7538_sofia

Fig. 10. Horizontal (along R.A., left) and vertical (along Dec., right) position-velocity diagrams through the position of one of the exciting sources
IRS5 (marked in each panel) derived from the [CII] line emission. corresponding roughly to the estimated center of bubble B. The contour levels
are in 3σ steps. The black dotted lines outline the elliptical shape a spherical shell with radius 10000 and expansion velocities of 10 km s−1 and
3 km s−1 at negative and positive relative velocities, respectively, would have in the pv diagram.

in the field. While proper motion of the exciting stars may cause           or whether they are rather caused by an expansion of the gas
the dislocation of IRS5 and IRS6 from the center of bubble-                 into an inhomogeneous medium, the high-velocity components
structure B, such displacement may also be caused by density                visible in the pv-diagrams (Figs. 9 to 11) all show high-velocity
and pressure gradients in the region. A similar displacement is             gas likely driven by the expansion of the Hii region. In particular
also observed between the Trapezium stars and the main bubble               the gas towards structures A and B exhibit expansion velocities
in Orion, the Orion Veil (Pabst et al. 2019, 2020).                         ≥ 10 km s−1 . Taking an expansion velocity of 10 km s−1 and a
                                                                            radius of 10000 at face-value, this would correspond to an expan-
                                                                            sion time-scale of roughly 0.126 Myrs. This is comparably short
Multiple bubbles versus expansion into an inhomogeneous                     with respect to the observationally estimated ages of the cluster.
medium: In addition to this, the strong sub-structure of the Hii            For example, Puga et al. (2010) derived an age range between
region visible in the different data sets, in particular in the [CII]       0.5 and 2.2 Myrs, and Sharma et al. (2017) estimated a mean age
channel map, indicates an almost porous structure of the Hii re-            of the young stellar objects of 1.4 Myrs with a range between
gion where radiation and wind energy can leak out and influence             0.1 and 2.5 Myrs. Hence, a constant expansion at that velocity
also parts of the Hii region that are less close to the main exciting       is unlikely the real scenario for that region. However, can the
sources IRS5 and IRS6. Hence, while bubble-like structures are              measured expansion velocities be caused by thermal expansion
possible, the NGC7538 Hii region may also expand into a very                of the gas or by the winds of the high-mass stars?
inhomogeneous environment. If an Hii region expands in such an                  To estimate expected expansion velocities, for the ther-
inhomogeneous cloud, changes of the cloud morphology are ex-                mal expansion we follow the Spitzer solution (Spitzer 1998),
pected. Such impact may also cause bubble-like morphologies as              whereas for the wind-driven expansion, the approach by Weaver
observed here. Recent analytic and numerical work by Lancaster              et al. (1977) and its adaption to include radiative cooling by Mac
et al. (2021a,b,c) also showed that the wind-driven expansion               Low & McCray (1988) is adopted. A comprehensive summary
of the gas around Hii regions can cause different morphological             of these two approaches is given in Henshaw et al. (2021). The
sub-structures. For the NGC7538 Hii region, a clear discrimina-             expansion velocities depending on time for the thermal expan-
tion between several bubble-structures each driven by individual            sion vth (t) and the wind-driven expansion vw (t) are:
internal sources and/or an expansion of mainly one wind-driven
shell into an inhomogeneous medium cannot be drawn. Further                                                          7c s t
                                                                                                                              !−3/7
hydrodynamic modeling of expanding Hii regions into an in-                                         vth (t) = c s 1 +
homogeneous medium may show whether such multiple ring-                                                               46
like structures of expanding gas can occur or whether separate                                                        !1/5
bubble-driving centers are required.                                                                   1 125 Lw
                                                                                              vw (t) =                               1/10
                                                                                                                              t−1/2 tcool .
                                                                                                       2 154π ρ
Thermal expansion or winds of the high-mass stars: Inde-                       Here, c s is the sound speed in the ionized gas (8 km s−1 at
pendent of whether all the ring-like structures are real bubbles            5000 K), Lw = 21 Ṁv2∞ is the mechanical wind luminosity, ρ the
Article number, page 10 of 22
H. Beuther et al.: FEEDBACK from the NGC7538 Hii region
Fig. 11. Horizontal (left) and vertical (right) position-velocity diagrams through the center of bubble D (marked in each panel) derived from the
[CII] line emission. The contour levels are in 3σ steps. The black dotted lines outline the elliptical shape a spherical shell with radius 8000 and
expansion velocities of 6 km s−1 would have in the pv diagram.
ambient density, and tcool the cooling time following Mac Low & rounding lower density material. In this picture, the expansion
McCray (1988) and Henshaw et al. (2021). The wind mass flow timescale one estimates then refers to the time since the break-
rate Ṁ and the escape velocity v∞ for an O3 star (IRS6, Puga out from this dense core.
et al. 2010) are taken from Muijres et al. (2012). The wind-driven
velocities vw strongly depend on the density of the ambient gas
ρ (also tcool depends on ρ, Mac Low & McCray 1988). 4.2. The bar-like photon dominated region (PDR)
Following Puga et al. (2010) and Sharma et al. (2017), the Figure 12 presents a zoom into the bar-like structure at the south-
age of the NGC7538 cluster and associated young stellar ob- western edge of the expanding Hii region. While the color-scale
jects is between roughly 0.1 and 2.5 Myrs. Even at the lower shows the ionized gas as traced by the 1.4 GHz continuum emis-
boundary of 0.1 Myr, the highest expansion velocities one can sion, the contours outline various other tracers: 8 µm continuum,
get with a Spitzer-type thermal expansion is ∼5.7 km s−1 , far be- [CII], CO(8–7) & (3–2) and [CI] emission. The white, black,
low what is measured in NGC7538. So, purely thermal expan- blue and red lines mark the approximate locations of the emis-
sion cannot properly explain the measured high-velocity gas. In sion crests in the 8 µm, [CII], CO(3–2) and [CI] emission, re-
contrast to that, the wind solution gives significant higher veloc- spectively. The crests were identified by eye via connecting the
ities. For the given parameters, and assuming densities of 103 , emission peaks. The crest of the CO(8–7) emission approxi-
2 × 10³ and 3 × 103 cm−3 , expansion velocities around 10 km s−1 mately coincides with that of the [CII] emission.
are estimated at times of roughly 1.1, 0.36 and 0.17 Myr, respec- In this picture, the 8 µm emission, that should stem largely
tively. While the lower end would be more consistent with the from UV-pumped infrared fluorescence PAHs, peaks closest to
constant expansion estimated above, the higher time-scales are the exciting sources of the Hii region. Second in this layered
more consistent with the the estimated age limits by Puga et al. structures is the ionized carbon [CII] emission that spatially
(2010) and the mean ages of the young stellar objects derived approximately coincides with the highly excited CO(8–7)
by Sharma et al. (2017). Hence, wind-driving seems a plausible emission. Furthest away from the exciting sources are the
way to explain the observed high-velocity gas. The wind-driving emission crests of the lower excited CO(3–2) and [CI] emission
is also consistent with the diffuse X-ray emission towards that re- that, given the spatial resolution of the data, projected on the
gion that is typically attributed to hot plasma caused by the wind plane of the sky spatially approximately coincide. This is
shocks of the massive stars (e.g., Güdel et al. 2008; Townsley different around the young high-mass star-forming region IRS1
et al. 2018; Pabst et al. 2020). south-east of the bar where CO(3–2) peaks closer to IRS1
Regarding the potential discrepancy between the lower end than the atomic carbon [CI] line (Fig. 12). Coming back to the
of the estimated cluster age at 0.5 Myrs and the shorter time- bar-like structure, in this framework, we can separate the photon
scales estimated for either constant expansion or the wind ex- dominated region (PDR) in roughly four layers:
pansion at higher densities, one way to reconcile these is that
initially the bubble may have confined inside the dense molecu- (i) The exciting sources and 1.4 GHz continuum emission
lar core in which IRS5 and IRS6 have formed. Only once the Hii (ii) the 8 µm emission, likely PAHs
region broke out of this core, expansion was rapid into the sur- (iii) ionized carbon [CII] and highly excited CO(8–7)
Article number, page 11 of 22A&A proofs: manuscript no. ngc7538_sofia
Fig. 13. Position-velocity cut from the [CII] line from IRS6 through
the bar as outlined in the middle panel of Fig. 4. The white dashed line
marks the approximate center of the bar.
4.3. Carbon budget
While carbon is mainly in its ionized C+ state in large fractions
of the PDR, it is mainly in its molecular CO form in the dense
molecular cloud (Fig. 2). But what is the relative carbon budget
within the transition zone from the Hii region towards the molec-
ular clouds? This transition can best be studied in the south-
western bar-like structure. Figure 14 presents the ionized carbon
[CII], the atomic carbon [CI] and the molecular carbon CO(3–
Fig. 12. Zoom on the bar-region south of the exciting sources IRS5 2) emission toward that region. The integration regime for all
and IRS6. The color-scale and the colored contours show the emission three species is the same from −70 to −40 km s−1 . In the follow-
tracers labeled in the two panels. Only selected contours are shown for ing, we derive approximate estimates for the column densities
clarity. The four colored lines mark the approximate positions of the and masses of the different carbon components in the bar region
emission crests in the corresponding tracers. The sources IRS5, IRS6 outlined by Fig. 14. With the assumptions outlined below, these
and IRS1 are marked. A linear scale-bar is shown as well. should only be considered as rough estimates. But nevertheless,
they allow us to asses roughly how much mass is within each
carbon component in and around the bar-like region.
The column densities of the ionized carbon are estimated
(iv) atomic carbon [CI] and lower excited CO(3–2) from the [CII] line following Goldsmith et al. (2012), eq. 26,
adding an additional optical depth term of 1−eτ −τ to correct for the
optical depth τ (Rohlfs & Wilson 2006):
This layered structure resembles prototypical edge-on PDR
structures observed also for example in the Orion bar (e.g., Tie-
2.4 × 10⁻⁶
" !#
lens et al. 1993; Tauber et al. 1994, 1995; Simon et al. 1997) or 1
M17SW (e.g., Pérez-Beaupuits et al. 2015b,a). We will return to N[CII] = 1 + 0.5e 91.25/T kin
1 +
3.43 × 10⁻¹⁶ Cul
the carbon budget within this PDR in Section 4.3.
τ
Z
In addition to the layered structure, the 1st moment map in × T mb dv [cm−2 ]
Fig. 4 indicates that there may be a velocity gradient across the 1 − e−τ
bar. To get a better view of that, Fig. 13 presents a position- with the kinetic temperature T kin (see further below), the
velocity diagram across the bar starting from the O3 star IRS6. collision rate Cul , the intensity T mb in K and the velocity dv
We see a clear velocity gradient from ∼ −50 km s−1 at the begin- in km s−1 . The collision rate Cul = Rul n depends on the tem-
ning of the cut near the main exciting source IRS6 to blue-shifted perature, where Rul is collision rate coefficient with H2 and
velocities < −60 km s−1 on the other side of the bar. The fact that n the density, assumed to be around ∼103 cm−3 . The colli-
the gas within the bar gets blue-shifted indicates that the bar lies sion rate coefficients Rul with H2 are taken from the Lei-
along the line of sight to the observer in front of the exciting den database for molecular spectroscopy (Schöier et al. 2005,
source IRS6. http://home.strw.leidenuniv.nl/∼moldata/, Lique et al. 2013)
Article number, page 12 of 22H. Beuther et al.: FEEDBACK from the NGC7538 Hii region
Following Cabrit et al. (1988), assuming 13 CO is optically
thin, the optical depth term can be approximated as:
R 13
τ [12 CO] T mb ( CO)dv
= R
1 − e−τ [13 CO] T mb (12 CO)dv
12
The term [[13 CO]
CO]
corresponds to the 12 CO/13 CO abundance ra-
tio. According to Moscadelli et al. (2009), NGC7538 is in the
Perseus arm which results at the given longitude of the region
(111.5 deg) in a Galactocentric distance of ∼9 kpc (e.g., Reid
et al. 2019). Following Wilson & Rood (1994), the R 12 CO/13 CO
T (13 CO)dv
abundance ratio is then ∼75. Furthermore, the term R Tmb (12 CO)dv
mb
corresponds to the mean ratio of brightness intensities between
the 13 CO and the 12 CO transition. Within the IRAM NOEMA
large program CORE (Beuther et al. 2018), a small area of
1.50 × 1.50 around IRS1 had been mapped in the J = 2 − 1
transitions of 12 CO and 13 CO with the IRAM 30 m telescope.
Fig. 14. Integrated [CII] (color), [CI] (black contours) and CO(3–2) Using these small-area data, we estimate a mean ratio between
(green contours) emission in the bar-region where the [CII]/[CI]/CO those two lines of ∼ 0.2 in the velocity regime between −70 and
mass estimates are conducted (section 4.3). All three maps were inte-
grated between -70 and -40 km s−1 . The [CI] contours start at 6σ and
−40 km s−1 . This value is used in the following also for the here
continue in 3σ steps (1σ = 1.6 K km s−1 ). The CO(3–2) contours start observed J = 3 − 2 transition. This results in the column density
at 10σ and continue in 10σ steps (1σ = 3.2 K km s−1 ). The white line equation:
marks the approximate location of the bar-like feature.
R
T mb (13 CO)dv
6.97 × 10¹⁵ 12
Eu /(kT ex ) [ CO]
where the para- and ortho-rates are weighted following Le Bour- NCO = T ex e
ν 2 µ2
R
[13 CO] T mb (12 CO)dv
lot (1991) and Gerlich (1990). The comparably good spatial cor-
respondence of the [CII] with the molecular line emission around Z
the bar-shaped PDR indicates that H2 should be the most dom- × T mb (12 CO(3 − 2))dv [cm−2 ].
inant collisional partner. If for comparison all collisions were
with atomic hydrogen, with the given assumptions we would get
In the following, we will calculate the mean column den-
masses roughly a factor of 1.57 lower (see also Goldsmith et al.
sities and the corresponding masses over the area presented in
2012). In reality, it is likely a mix of collisional partners domi-
Figure 14 that encompassed roughly 11.25 pc2 . The main miss-
nated by H2 and hence the difference should be much smaller. In
ing ingredient in the above equations are the temperatures to be
the following we use the collisional rates with H2 . Evaluating the
chosen for the column density estimates.
[13 CII] emission in our data, we detect the line after averaging
over areas to decrease the noise. In the case of the bar-like re- Regarding the ionized carbon C+ , Langer et al. (2010) typi-
gion in NGC7538, the [13 CII] data indicate a mean optical depth cally assume temperatures between 100 and 150 K, which seems
τ for the main [CII] line of ∼2.5. Compared to the optically thin a reasonable temperature regime in this PDR as well. Using
case, this corresponds to a column density and mass correction these two values as brackets for the possible temperatures of
factor of ∼2.7. the ionized carbon C+ we find an ionized carbon C+ mass of
Furthermore, the atomic carbon column densities are esti- M[CII] ≈ 9.7 ± 1.6 M , assuming the above discussed mean opti-
mated from the [CI] emission following Frerking et al. (1989): cal depth τ ∼ 2.5. This is an upper limit to the mass (Rohlfs &
Wilson 2006) whereas we can consider an estimate assuming op-
tically thin emission as a lower limit. In the optically thin limit,
1 + 3e
−23.6
T ex + 5e
−62.4
T ex
Z we get the lower limit of M[CII]_lower_limit ≈ 3.6 ± 0.6 M , a factor
N[CI] = 5.94 × 10¹⁵ −23.6
T mb dv [cm−2 ] ∼2.7 below the optical depth corrected mass estimate.
3e T ex
For the atomic and molecular gas, the excitation tempera-
tures are not well determined in that region. However, variations
with the excitation temperature T ex (the temperature quantifi-
in the excitation temperatures between 30 and 50 K do not vary
cation is discussed further below). The CO column density can
the estimated masses significantly. Therefore, we estimate the
then approximately be estimated following standard equations
atomic M[CI] and molecular masses MCO in that excitation tem-
(e.g., Cabrit et al. 1988):
perature regime. In that framework we find M[CI] ≈ 0.45±0.1 M
6.97 × 10¹⁵ τ and MCO ≈ 1.2 ± 0.1 M . The molecular mass can also be com-
NCO = T ex eEu /(kTex ) pared to the gas mass one can derive from the Herschel gas col-
ν 2 µ2 1 − e−τ umn density map. While a H2 -to-CO ratio of 104 would result in
Z a gas mass of ∼ 1.2×10⁴ M , the gas mass derived from the Her-
× T mb (12 CO(3 − 2))dv [cm−2 ]. schel map in the same area is ∼4600 M . This difference around
a factor 2.6 can already be explained by the uncertainties of
Here, ν, µ, T ex , Eu /k, τ and T mb are the frequency, dipole temperatures and line-of-sight averaging, optical depth estimates
moment (0.112 Debye), the excitation temperature, the upper and the assumed dust properties for the Herschel-based mass es-
energy level of 33.19 K, the optical depth and the main beam timate. Nevertheless, this comparison shows that our molecular
brightness temperature of the line, respectively. mass estimate has an approximate uncertainty of a factor two.
Article number, page 13 of 22You can also read