FEASIBILITY STUDY OF FINANCIAL AND ECONOMIC MECHANISMS FOR INTEGRATED COASTAL MANAGEMENT IN KADAVU, FIJI - NET
←
→
Page content transcription
If your browser does not render page correctly, please read the page content below
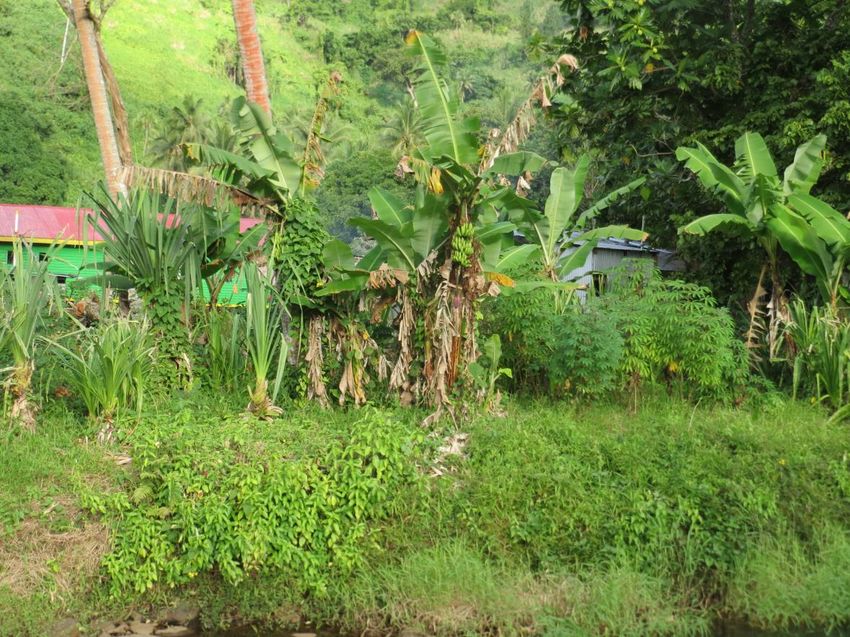
FEASIBILITY  STUDY OF FINANCIAL AND ECONOMIC
MECHANISMS FOR INTEGRATED COASTAL MANAGEMENT IN
KADAVU, FIJI

Photo credit: Suzie Greenhalgh – Opportunities for certified organic production

The operator that is in charge of the implementation of the RESCCUE project in Fiji under the
supervision of both SPC and the University of the South Pacific is a consortium of four partners:

The Institute of Applied Sciences, University of the South Pacific
(Leader: Johann Poinapen )
Contact: Johann Poinapen
e-mail: johann.poinapen@usp.ac.fj
phone: +679 323 2992

Landcare Research (Leader: Suzie Greenhalgh)
Contact: Suzie Greenhalgh
e-mail: greenhalghs@landcareresearch.co.nz
phone: +64 1 9 529 7444

Wildlife Conservation Society (Leader: Sangeeta Manguhai)
Contact: Sangeeta Manguhai
e-mail: smangubhai@wcs.org
phone: +679 331 5174

Conservation International (Leader: Susana Waqanaibete-Tuisese)
Contact: Susana Waqanaibete-Tuisese
email: swaqainabete-tuisese@conservation.org
phone: +679 331 4593

Fiji Environment Law Association ( Kiji Vukikomoala)
Contact: Aliti
e-mail: ; kiji.vukikomoala@fela.org.fj

                                                2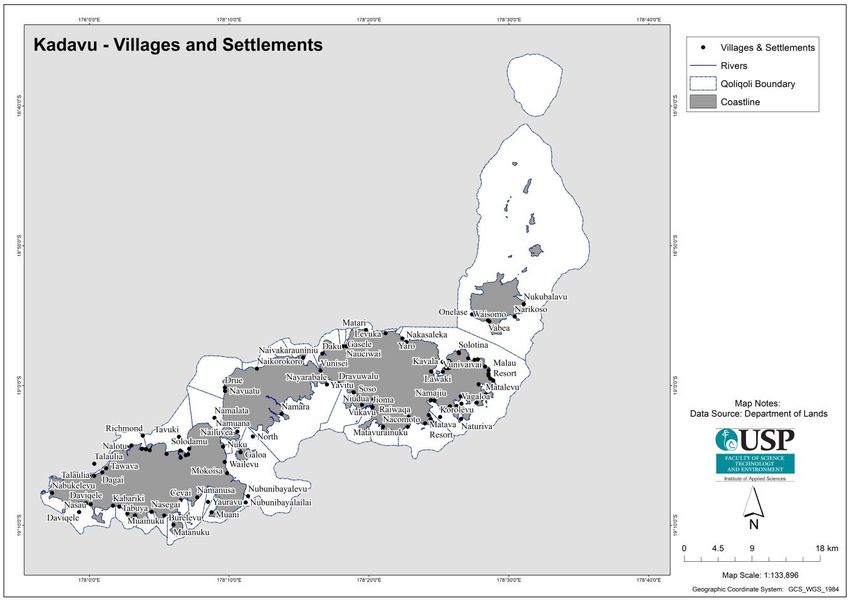
Main redactor(s)/Contributor(s)                 Date of publication

Suzie Greenhalgh                                May 2017

Suzie Greenhalgh (revision)                     July 2017

Landcare Research Contract Report: LC2780

                                            3
Overview of the objectives and components of RESCCUE projet :
The Resilience of Ecosystems and Societies to Climate Change (RESCCUE) project is a regional project
implemented by the Secretariat of the Pacific Community.
The overall goal of RESCCUE is to contribute to increasing the resilience of Pacific Island Countries and
Territories (PICTs) in the context of global changes. To this end RESCCUE aims at supporting
adaptation to climate change (ACC) through integrated coastal management (ICM), resorting
especially to economic analysis and economic and financial mechanisms.
The RESCCUE project operates both at the regional level and in one to two pilot sites in four countries
and territories: New Caledonia, Vanuatu, Fiji and French Polynesia.
RESCCUE is funded primarily by the French Development Agency (AFD) and the French Global
Environment Facility (FFEM) for a duration of five years (01/01/2014 to 31/12/2018). The total
project budget is 13 million Euros, including 6.5 million Euros from AFD/FFEM and about the same in
co-funding.
RESCCUE Project sites in Fiji are Ra Province and Kadavu Province. Ra has about 95 communties and
Kadavu 73 communities. The follwing are the RESCCUE components that will be implemented in these
two sites.
It is structured around five components:
Component 1: Integrated coastal management – supporting ICM implementation through ICM plans,
ICM committees, and management activities concerning both terrestrial and marine ecosystems,
capacity building and income generating activities.
Component 2: Economic analysis – using economic analysis to support coastal management and
policy decisions.
Component 3: Economic and financial mechanisms – setting up economic and financial mechanisms
to generate additional and sustainable funding for ICM: review of options (payment for ecosystem
services, taxes, user fees, trust funds, quota markets, offsets, labels…); feasibility studies;
implementation; monitoring.
Component 4: Capitalization, communication, dissemination of project outcomes in the Pacific – going
beyond pilot sites activities in order to have impacts at the regional level, by fostering experience
sharing between sites, cross-sectoral expertise, and communication and dissemination of the project
outcomes.
Component 5: Project management – implementing and coordinating the project, by providing
technical assistance, organizing local and regional steering committees, conducting audits and
evaluations (mi-term and ex-post), etc.

                                                   4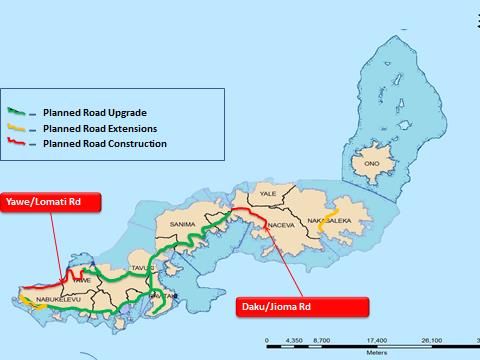
Version of deliverable               Date            Main author/contributor

Version 1 sent to SPC and the Fiji                   Suzie Greenhalgh
Government

Version 2                            June 2017       Suzie Greenhalgh

                                                 5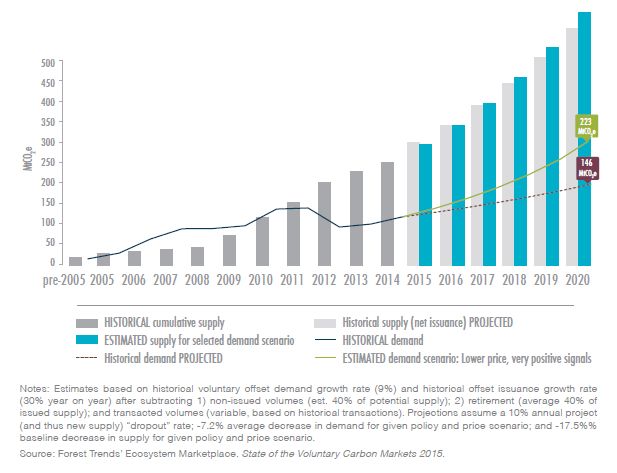
CONTENTS

EXECUTIVE SUMMARY ........................................................................................................................... 9

1.       INTRODUCTION............................................................................................................................ 13

2.       OVERVIEW OF ECONOMIC AND FINANCIAL MECHANISMS ............................................................ 15

3.       EXISTING ECONOMIC AND FINANCIAL MECHANISMS IN FIJI: AN OVERVIEW .................................. 17

3.1 Taxes, fees, levies: Environmental levies ..................................................................................................................... 17

3.2 Taxes, fees, levies: Marine user fee systems ............................................................................................................... 17

3.3 Subsidies and grants: Trust funds .................................................................................................................................. 18

3.4 Subsidies and grants: Environmental grants.............................................................................................................. 20

3.5 Environmental markets: Carbon market ..................................................................................................................... 20

3.6 Ecolabels .................................................................................................................................................................................. 22

4.       ENVIRONMENTAL AND CONSERVATION ISSUES: AN OVERVIEW .................................................... 23

5.       FEASIBILITY OF ECONOMIC AND FINANCIAL MECHANISMS............................................................ 23

5.1 Market Assessment .............................................................................................................................................................. 24

5.2 Risks and Opportunities ..................................................................................................................................................... 30

5.3 Economic assessment .......................................................................................................................................................... 33

6.       ORGANIC YAQONA – CONCEPT TO REALITY................................................................................... 34

6.1 Steps to establish certified organic yaqona................................................................................................................. 34

6.2 Action plan............................................................................................................................................................................... 39

7.       REFERENCES................................................................................................................................. 40

8.       APPENDICES................................................................................................................................. 43

Appendix 1. People and/or organisations consulted for the assessment ............................................................... 43

Appendix 2. Kadavu tourist/visitor resorts and accommodation ............................................................................. 44

                                                                                                6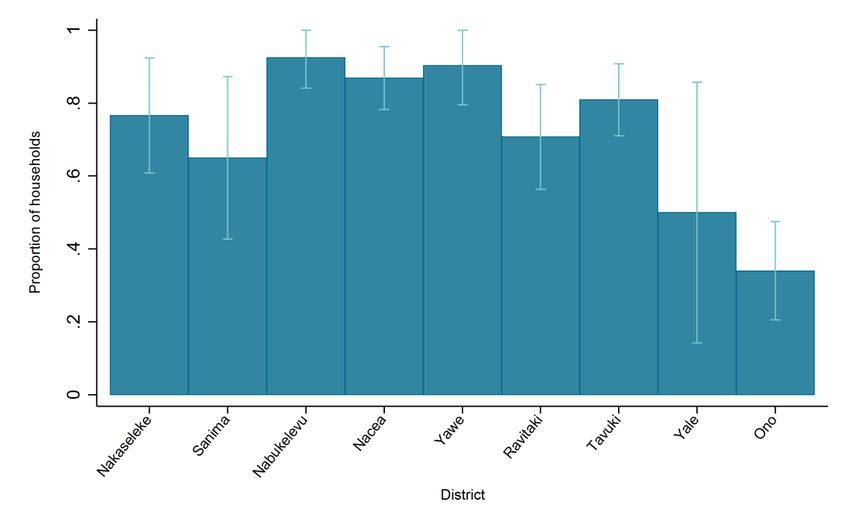
Figure 1 Kadavu villages and settlements .............................................................................................. 13
Figure 2 Existing and planned road network for Kadavu ........................................................................ 14
Figure 3 description of price based and markets based mechanisms ...................................................... 16
Figure 4 Historical voluntary offset (or credit) supply and demand inlcuding estimated future supply and
demand based on assumption of lower prices but very positive policy signals ....................................... 22
Figure 5 Planted pine in Kadavu ............................................................................................................ 28
Figure 6 Proportion of households growing yaqona by district in Kadavu ............................................... 37

Table 1 RESCCUE classification of economic and financial mechanism .................................................... 15
Table 2 Summary of assessment components used for the feasibility assessment .................................. 24
Table 3 Resources on Kadavu ............................................................................................................... 26
Table 4 Agricultural statistics for Kadavu Island .................................................................................... 27
Table 5 Number of farmers using chemicals ......................................................................................... 30
Table 6 Countries with restrictions on Kava imports .............................................................................. 31
Table 7 Estimate Net Present Value (including social benefits) for the organic certifications of yaqona on
Kadavu Island based on the number of framers being certified.............................................................. 34
Table 8 Number of audits for group certification required by BioGro .................................................... 36

                                                                      7
Abbreviations and Definitions
BioGro Organic certification organization based in New Zealand. They certify
organic products in the Pacific to a number of global standards
FJD Fijian dollars
Kava Kava (Piper methysticum), also known as Yaqona in Fiji, is a crop of the
western Pacific. The roots of the plant are used to produce a drink with
sedative, anesthetic, euphoriant, and entheogenic properties. Kava is
consumed throughout the Pacific Ocean cultures of Polynesia and some
parts of Micronesia for its sedating effects. Its active ingredients are called
kavalactones
KYMST Kadavu Yaubula Management Support Team
LCR Landcare Research
LMMA Local marine managed area
PGS Participatory guarantee system
REDD Reduced Emissions from Deforestation and Forest Degradation
RESCCUE Project name, representing the activity of ‘Restoration of ecosystem
services and adaptation to climate change’
USDA United States Department of Agriculture
USP University of South Pacific, Institute of Applied Sciences
VAT Value added tax
Yaqona See kava above
8EXECUTIVE SUMMARY
The RESCCUE project is seeking to explore the feasibility of implementing economic/financial
mechanisms to support the on-going financing of conservation activities on the Island of Kadavu, Fiji.
Yaqona (or kava) production is the main commercial activity for most households. In most villages, at
least 50% of all households grow yaqona for commercial purposes.
Three potential economic/financial mechanisms for Kadavu are explored within this assessment:
User fees/levies: leveraging the unique biodiversity and natural resources on and around
Kadavu.
Environmental markets: financial incentives to improve environmental stewardship.
Eco-labelling: incentive to grow crops in an environmentally sustainable manner to maintain,
protect, and/or improve the current state of native and agricultural ecosystems.
The options were first compared using a rapid market assessment from which eco-labelling emerged
as the only promising mechanism. Eco-labelling, in particular the organic certification of yaqona was
further examined to evaluate the operational, regulatory and legal, reputational, market and product,
and financing risks and opportunities. In addition, a cost-benefit analysis of organic certification was
undertaken in conjunction with the University of Wisconsin. The analysis identified that organic
certification of yaqona was a feasible option for Kadavu.
According to exporters, the biggest demand for organic yaqona is likely to come from the US, at least
initially. The regulatory and legal risks and opportunities assessment identified the most likely and
easier route to being able to certify to the US organic standards is to first certify to the Canadian
Organic Standard as this process is easier than trying to meet the USDA requirements. Once a product
has been certified using the Canadian Organic Standard the organic equivalency agreement between
Canada and US can be used to obtain the USDA certification. So, while there is no known demand for
kava exports into Canada it will be the most efficient route to US certification.
The certification of yaqona, however, is untested and will require approval from the Canadian
government if it is to be certified against the Canadian Organic Standard as well as from the BioGro
Company itself. These both require formal request processes.
In addition to certification approval processes there are risks and opportunities for RESCCUE that
need to be considered:
Opportunity – RESCCUE and RESCCUE project partners lead the first certification process for
organic yaqona globally.1 This may have positive reputational benefits for leading and
promoting a new revenue stream for a potentially large global market for Pacific Island
Nations, especially if the health benefits become more widely known and sort after.
Risk – The potential risk to RESCCUE, LCR and USP also needs to be acknowledged. Should
yaqona become certified as organic with the test case being led by these organisations and
additional substantiated health claims arise then there is reputational risk for these
organisations. The new medical studies noted earlier, though, appear to have assuaged the
current claims of health damage; instead showing health benefits.
1 There were no other certification processes for yaqona uncovered during this assessment.
9The organic certification for yaqona will not be pursued until RESCCUE approves the Fiji RESCCUE
team’s continued activities to certify organic yaqona.
Moving to certification
If RESCCUE approval is forthcoming some of the key requirements and subsequent steps to achieve an
organic certification and to produce an export-quality product include:
1. Formal request process for the certification of yaqona production as organic
With RESCCUE approval we will commence the formal process of approaching the Canadian
government to certify yaqona as organic. At the same time a formal request will be made to BioGro to
also certify yaqona.
2. Creation of a farmer group
A group-certification model is recommended to reduce the financial and compliance burden on small-
scale yaqona growers. For ease of audit and management (especially initially), the members of the
farmer group should be located in the same geographic vicinity. The recommendation is that the initial
farmer group should come from a district with significant yaqona production and that have experience
with selling to export wholesalers in addition to a desire to be organically certified. The district of
Nabukelevu is one such district. Lami Kava purchases most of their yaqona for processing from
Nabukelevu district, mainly because of the high quality of their dried yaqona. In addition, at the
ecosystem services workshops in July 2016, the chief of Daviqele village stated that the whole district
of Nabukelevu wants to go organic.
3. Registration
Registration takes a minimum of 36 months.
4. Fulfilling the certification requirements
A number of requirements must be satisfied before a group certification can be issued. For BioGro
certification, this includes:
Internal control systems for the group and competent system manager/personnel.
Required documentation, including a complete list of group members, maps/sketches of field
locations, farm/field records, signed member agreements, and yield estimates.
An internal inspection protocol (to be developed, documented, and implemented for the
group).
The monitoring and documented conversion process. Given that the farmers likely to be
identified for membership in the group will not be using chemicals, it is possible that a
retrospective certification could be made, particularly if records are available.
Process to remove non-compliant members from the group.
Process to accept new members into the group.
Risk assessment procedures are developed and in place.
5. Building farmer capacity
There were a number of areas identified for building the capacity of farmer to meet the requirements
for organic certification as well as supplying yaqona to international markets. These areas include:
10 Maintaining product quality. The newly released Fijian Yaqona Standard (Ministry of
Agriculture 2017) and Fijian Kava Quality Manual (Ministry of Agriculture undated) provide
some guidelines on how to improve and maintain quality. Partnerships with other
organisations (e.g. PIFON) could be developed to deliver this training.
Understanding what being part of a certified organic farmer group means, including
understanding the requirements of organic yaqona production, understanding that records are
required to be kept for auditing purposes, and understanding that the group as a whole (which
is the certified entity) is responsible for the compliance of all operators and the audit process.
Keeping detailed records to high standards and completing required documentation.
Understanding markets, including basic knowledge on how export markets work (supply and
demand, price points, impacts of price volatility) and risks and opportunities of supplying an
export market (quality, stable supply, record keeping, market expectations).
6. Working with export processors to certify their processing facilities as organic and developing
relationships to market organic kava produced with Kadavu yaqona.
11The proposed actions to implement a yaqona organic certification system after RESCCUE approval are:
Action Timeline Who
Formal request to Canadian government and With RESCCUE LCR
BioGro to certify yaqona as organic approval
Initial BioGro consultation meeting By June 2017 USP (as technical lead for overall
implementation)
Meeting to scope the steps and expand on the
requirements for meeting the BioGro certification KYMST representative (as lead for
requirements for Kadavu. There is a fee Kadavu implementation)
associated with this meeting, and the meeting will
LCR (as the liaison with BioGro and co-
also involve providing greater details on the
drafter of templates/protocols to fulfil
requirements to the implementation team
certification requirements)
Solicit farmers to be part of the first grower group By September KYMST
2017
Identify group manager By September KYMST (to identify relevant person(s))
2017
Farmer workshops to outline the requirements By December USP (as technical implementation lead)
for organic certification and confirm membership 2017
KYMST (as Kadavu implementation lead)
of grower group
Training workshops designed and undertaken on Between USP (as technical lead)
topics identified (see Section 6.1). External September
External organisations as needed
organisations to assist with training will be 2017 and July
determined based on training needs and 2018
necessary expertise.
Registration documentation finalized (see above By March 2017 USP (as technical implementation lead)
for the necessary material required)
KYMST representative (as Kadavu
implementation lead)
LCR (as co-drafter of templates/protocols
to fulfil certification requirements
Mentoring of farmers during certification On-going USP (as technical lead for overall
implementation)
KYMST representative (as lead for
Kadavu implementation)
Certification Depends on Group manager
registration
Farmers
date and
compliance KYMST
121. INTRODUCTION
Economic and financial mechanisms hold the promise of providing sustainable financing for
environmental and conservation actions. A variety of mechanisms can be applied. However, not all
mechanisms are appropriate for all contexts, and in some instances, there may be few or no
mechanisms that are appropriate to current conditions in an area. The aim of this assessment is to
explore what, if any, economic/financial mechanisms are applicable to the current conditions on
Kadavu Island, Fiji, to support on-going environmental improvement.
Background
Kadavu Island, 96 km south of Suva, covers 408 km2 and is the fourth largest island in the Fiji Group
after Viti Levu, Vanua Levu and Taveuni. The island is 58 km long and 14 km wide at its widest point
(Figure 1).
Kadavu is volcanic in origin with the landscape being generally steep. The highest point is Mt
Washington (Nabukelevu province) at 838 meters above sea level. Kadavu lies across the direction of
the south-east trade wind with its southern shore windward such that the southern side of the island
is more exposed and experiences higher rainfall than the northern side.
Figure 1 Kadavu villages and settlements
13There are 9 districts in Kadavu province, with the main centre, Vunisea, lying in Tavuki district. There
are two ports: Vunisea, which also hosts the islands only airstrip; and Kavala in the Nakaseleke district
to the north of the main island. There is a limited road network, with the predominant mode of
transportation to most areas being by the sea (Fig. 2).
The Great Astrolabe Reef is located in the northern area of Kadavu and is one of the largest barrier
reefs in the world. There is also a network of local marine managed areas (LMMAs) situated around
Kadavu aimed at meeting local-scale conservation and fisheries needs. More details on the LMMAs can
be found in Korovulavula (2016), Wendt (2012) and Wendt et al. (2016). There are eleven tourist
resorts/accommodation places on the island, most located near the Great Astrolabe Reef (see
Appendix 1).
Yaqona (or kava)2 production is the main commercial activity for most households (Fig. 6). For most
villages, at least 50% of all households in the sample grow yaqona for commercial purposes
(Greenhalgh et al. 2016).
Figure 2 Existing and planned road network for Kadavu (Source: Kadavu Provincial
Administrator 2017)
2Throughout this report, the term yaqona is used to refer to the unprocessed plant, while kava is used to refer to
the processed product.
142. OVERVIEW OF ECONOMIC AND FINANCIAL MECHANISMS3
There is no widely agreed definition or classification of economic and financial mechanisms
(Greenhalgh & Selman 2014; Billé & Marre 2015). RESCCUE have developed a basic framework for
these mechanisms (see Table 1) that uses four categories to differentiate between mechanisms. Two
categories describe the primary objectives of the mechanisms and two categories distinguish
mechanisms based on who pays.
Table 1 RESCCUE classification of economic and financial mechanism
Economic mechanisms Financial mechanisms
What for? Primary objective: provide incentive(s) Primary objective: generate funding to
to limit harmful behaviours to cover administrative or management
biodiversity and ecosystem services costs for biodiversity and ecosystem
Who pays? services conservation or restoration
(one-off or regular payments)
Polluter pays Tax, ecotax (to change behaviour) Tax, ecotax (to generate funding)
An agent pays because Quotas, markets Offset
he degrades biodiversity
Eliminate harmful subsidies Trust funds (filled by polluters)
and ecosystem services
Compensation of environmental damage
Royalty
Usage fee, user fees, licence fees
Tax (tourism, cruise ship)
Beneficiary pays Payment for ecosystem services Private/public donations
An agent (or a Conservation agreements (involving a Land acquisition
representative) pays to payment)
Trust funds (filled by beneficiaries)
benefit from ecosystem
Conservation easements
services and biodiversity Green lottery
conservation or REDD+ Entrance fees to protected areas
restoration Label
User fee, licence fees
Subsidies
Taxes (airport, tourism tax, cruise ship)
Reverse auctions
Debt-for-nature swap
Source: from Billé & Marre 2015.
Another useful and relatively common way to describe mechanisms is whether the mechanism is
price-based or market-based (or rights-based) (Fig. 3). Price-based mechanisms directly change price,
while market-based mechanisms indirectly influence price through markets. Price-based mechanisms
rely on explicit price signals to motivate changes in behaviour. There are two common types of price-
based mechanisms – taxes that place a penalty on those who degrade ecosystem services and
3 Note: this section is taken directly from Greenhalgh and Mangubhai (2016).
15subsidies that provide rewards to reduce negative impacts on ecosystem services (Greenhalgh & Faeth
2001).
Market-based mechanisms refer to the creation of a market-like mechanism to determine the price
paid for an environmental outcome (Morrison & Greig undated). These mechanisms encourage
behaviour through market signals rather than through explicit directives such as pollution control
levels or methods (Stavins 2001). Market-based mechanisms have some key theoretical advantages
over stand-alone regulation or price-based economic mechanisms, especially in efficiency and cost-
effectiveness in improving environmental quality and meeting environmental goals (e.g. Tietenburg
2006).
This type of classification is also useful as it provides insights into the types of signals a mechanism
may provide to incentivise conservation actions. In this report, we look broadly across the range of
different economic/financial mechanisms to see how they may be applicable to conservation efforts in
Kadavu, Fiji.
Figure 3 description of price based and markets based mechanisms
163. EXISTING ECONOMIC AND FINANCIAL MECHANISMS IN FIJI: AN
OVERVIEW4
Economic/ financial mechanisms are currently being used to address some environmental issues in
Fiji. A majority of the mechanisms in place are price-based mechanisms that rely on the tourism sector
and, to a lesser extent, on private companies. Outlined below are a range of mechanisms currently in
operation in Fiji. This list is not exhaustive.
3.1 Taxes, fees, levies: Environmental levies
3.1.1 Fiji Environmental Levy and Airport Departure Tax
The 2016 Budget for Fiji introduced an Environmental Levy that reinforces the government’s
commitment for the right to a clean environment for all Fijians. The levy would predominantly target
visitors staying in luxury accommodations and who come to enjoy the natural beauty and recreational
opportunities in Fiji. Tourism operators will have to pay a small additional charge to support
environmental protection programs (Fiji Revenue and Customs Authority 2016). However, it is not yet
clear how these funds will be used (Isoa Korovulavula, USP, pers. comm., 10 June 2016; Susana
Waqainabete-Tuisese, CI, pers. comm., 11 June 2016; Yap et al. 2016).
The Environmental Levy will be levied at 6% on the ‘turnover’ of prescribed service providers (which
are listed under the Schedule of the Environmental Levy Act). In this instance, ‘turnover’ means the
total charges for prescribed services billed to consumers. The levy is effective from 1 January 2016
(Fiji Revenue and Customs Authority 2016). It is still unclear how this fund will be used to provide
grants, seed funding, or other forms of support for the establishment of economic and financial
mechanisms to support environmental conservation.
There is also an environment levy within the Airport Departure Tax, which is currently FJD10. The
revenue from this tax also goes into the government’s consolidated revenue fund with no specific
targeting of this revenue for environmental purposes (Yap et al. 2016).
3.1.2 Challenges and opportunities for expansion
The environmental Levy has been established by a legislative act that provides the required legal
mandate for the implementation of such a levy. If this revenue is used to support environmental
conservation, then the levy may provide a sustainable financing mechanism with which to establish
and maintain a range of conservation initiatives. On the other hand, if this revenue goes into the
consolidated revenue funds and is not targeted toward conservation, then there is likely to be little
environmental benefit. Currently, these levy funds are not being used to fund conservation.
3.2 Taxes, fees, levies: Marine user fee systems
3.2.1 Shark Levy, Shark Reef Marine Reserve
This voluntary contribution system began in 2003 as an agreement between two villages who owned
traditional rights to Shark Reef (located between Viti Levu and Beqa Island) and a dive operator. The
dive operator was granted access to the area in return for villagers not fishing on parts of the reef. The
dive operator collected a voluntary daily park contribution (currently FJD20 per diver; Beqa
Adventure Divers 2016) from each visitor, which was split equally between these two villages.
4 Note: portions of this section are taken directly from Greenhalgh and Mangubhai (2016).
17The marine reserve at Shark Reef was formally established in 2004. Since then, other villages have
joined the initiative leading to an expansion of the protected area. They also receive a donation from
the tourism revenue. Other incentives included in the agreement are dive master training for villagers,
training of fish wardens to monitor the area, and the dive operator acting as the intermediary with the
relevant Fijian authorities, helping to procure moorings and markers and assisting villages in the
monitoring of protected areas (Brunnschweiler 2010).
3.2.2 Namena Marine Reserve
The Namena Marine Reserve is located between Viti Levu and Vanua Levu in the traditional fishing
grounds of the Kabulau Community. The community not only wanted to protect its marine fisheries
from over-exploitation due to poaching and poor management, but also wanted to develop tourism to
provide a sustainable income for the community. To meet the costs of managing the area (e.g. patrols,
moorings, and fuel) they established a voluntary donation (FJD30/person) for those who visited the
park. The donation supports tertiary scholarships.
Challenges still exist from the lack of adequate enforcement and laws to protect marine protected
areas (Namena Park Reserve 2016). This reserve suffered substantial damage during Cyclone Winston
(Mangubhai 2016) and it is currently unclear whether the resort, which provided substantial clientele,
will reopen (Namena Island Dive Resort 2017).
3.2.3 Challenges and opportunities for expansion
As long as there is a charismatic resource about which visitors care and are willing to pay to visit,
voluntary contributions to conservation have the potential to provide regular income streams to
communities. One factor to consider with voluntary contributions, however, is the local uniqueness of
the place/species visitors are paying to see/use and the number of potential visitors.
The overall cost of the experience is also likely to be an issue for some visitors, whose costs may
already include airfares, accommodation, and meals as well as the cost of experiences. Costs are
becoming an issue in Fiji. Taxes (VAT, Service Turnover Tax, and Environmental Levy) paid by tourists
have risen from 15.5% to 25% (or 61%). Excise and import taxes have increased causing wine prices,
for example, to increase by 53%, and departure taxes have been raised. The cost base has also
increased (e.g. for building supplies, fruit, and vegetables), which is passed on to visitors (Lal 2016).
These cost increases all raise the holiday costs for tourists, who compare Fiji with other destinations,
suggesting that the tourism industry’s appetite for new user fees may be limited. The rising costs for
tourism were a concern expressed by Helen Sykes (resort support consultant, pers. comm., 4 May
2016) in terms of maintaining visitor numbers and the future of these kinds of fees.
The Regulation of Surfing Areas Decree 2010 (hereafter ‘Surfing Decree’) has also made the continued
and expanded use of this kind of mechanism challenging. This decree ‘enables unrestricted access to
any surfing area (where surfing is defined as surfing and any water sport) by all persons, including
tourists, hotels, and businesses engaged in providing and promoting surfing or any other water sport’
(Fiji Government 2010). This decree thus makes it difficult for communities to lease, license, or use
some other instruments in relation to surfing areas, broadly defined.
3.3 Subsidies and grants: Trust funds
3.3.1 Sovi Basin Trust Fund
The Sovi Basin Trust Fund was established as an endowment fund to provide financial sustainability of
the Sovi Basin Protected Area in the Naitasiri and Namosi provinces of Viti Levu over the long term.
18The total amount targeted for the capitalisation of the Trust Fund is USD4.25 million (National Trust of
Fiji 2013). The Trust Agreement was signed in 2010 with an initial endowment of USD3.627 (from
contributions from Fiji Water and Conservation International’s Global Conservation Fund (Yap et al.)).
The funds are invested in an offshore account – HSBC Trustee (Singapore) Ltd (Susana Waqainabete-
Tuisese, pers. comm., 15 June 2016). The GEF4 (PAS4: Forest Conservation and Protected Area
Management Project in Fiji) is also contributing USD0.25m into the Sovi Basin Trust Fund. The first set
of dividends from the Trust was paid to the communities in 2015 (Susana Waqainabete-Tuisese, pers.
comm., 29 June 2016).
The Trust Fund supports 3 areas:
Annual royalty and lease payments to Sovi Basin Protected Area landowners.5 These payments
include an annual lease fee and an annual timber royalty (for standing trees) in lieu of timber
harvest. This lease amount is determined by the iTaukei Land Trust Board (TLTB).
Annual contributions to the Community Conservation and Development Fund. The fund’s
purpose is to provide benefits to the six-landowning village communities.6 Not all members of
the landowning villages are landowners, so to ensure that all village members have an incentive
to protect the area, the fund has been set up to finance community projects. Depending on the
accrued interest of the Trust Fund, an equal amount is disbursed annually to all communities.
Management budget for the National Trust of Fiji, which manages the protected area (National
Trust of Fiji 2013).
The protected area, which the Sovi Basin Trust supports, took approximately 9 years to establish.
Conservation International began its engagement with the local communities in 2003 and acquired a
five-year development lease from the Sovi Basin’s landowners in 2005. A 99-year lease for the Sovi
Basin Protected Area was signed in 2012 between National Trust of Fiji (NTF) and TLTB (National
Trust of Fiji 2013). The original size of the protected area was 23 400 ha but 7096 ha have been given
to a mining interest (under the Section 11(2) of the Mining Act [Cap 14]7). The size of the protected
area is now 16 304 ha (Susana Waqainabete-Tuisese, pers. comm., 15 June 2016).
3.3.2 Challenges and opportunities for expansion
Establishing Trusts for on-going conservation of the environment has merit, although it is too early to
assess the effectiveness of the Sovi Basin Trust Fund in terms of delivering community and
conservation benefits. However, based on the learnings to date, the successful establishment of
Conservation Trusts should have:
Legal protection status for the land/marine area which the trust supports to ensure there is an
ability to legally enforce the conditions of any agreement. Establishment likely requires:
o Sufficient time to engage with landowners to jointly define and agree to the conditions of
5 The land within the area is communally owned by 13 mataqali: Buasauni, Buluya, Nabukebuke, Nakaulevu,
Nakulasa, Naitavuni, Namataniqavi, Nasava, Nawaisomo, Tabaivunaqumu, Vetawa, Waibasaga, and Waituitui.
Sovi Basin landowners are resident in six villages: Delailasikau, Nadakuni, Naivucini, Namosi, Naseuvou, and
Nukusere. None of these villages is located within the SBPA but in a number of river valleys adjacent to the SBPA.
The villages of Namosi and Nukusere are within the Province of Namosi. The four remaining villages are within
the Province of Naitasiri.
6 These villages are Delailasakau, Nadakuni, Naivucini, Namosi, Naseuvou, and Nukusere.
7 www.paclii.org/fj/legis/consol_act_OK/ma81/
19any protected area agreement, e.g. expectation for the community (such as no logging),
expectation of the management entity (such as payments to the community),and building
trust and understanding between the parties.
o Enforceable lease agreements (or similar arrangements) between resource owners and
an independent manager of the protection area.
o Establishment of a governance structure and management entity.
An initial source of funds/endowment of sufficient size to provide an on-going revenue stream
to manage the protected area and to meet any of the financial obligations laid out in the legal
agreement.
Strong governance structure for both the management of the trust and the protected area.
Without these conditions in place, it is less likely that these trusts will be successful.
3.4 Subsidies and grants: Environmental grants
3.4.1 Mamanuca Environment Society
This initiative can loosely be classified as a financial instrument because funds and personnel are
being provided to support efforts to protect and restore dry forest habitat on Malolo Island, on which
Fijian crested iguanas have been found. This species was previously believed to be extinct on the
island. Fiji Airways is one of the major sponsors of the initiative (Mamanuca Environment Society
2016).
3.4.2 Challenges and opportunities for expansion
Grants rely on funding agencies (e.g. bilateral, government, private sector, and philanthropic
organisations) to provide on-going funding to support initiatives. Funding via grants may be uncertain
in the medium- to long-term, and the amount and longevity of the investment will depend on the
strategic direction of the funding agency and the amount of funding available. If a larger amount of
funding is available, then trust funds or something similar could be established to provide a reliable
funding streams into the future (also see Section 3.3). The size of this revenue stream may be small
and will depend on the performance of financial markets. In this situation, transparent and effective
governance structures are required.
3.5 Environmental markets: Carbon market
REDD and REDD+ are global initiatives to stop tropical deforestation. They emerged under the United
Nations Framework Convention on Climate Change in 2007, and there are now many nations
developing their ‘readiness’ to receive payments for reducing deforestation against a business-as-
usual baseline.
Fiji submitted a Readiness Preparation Proposal (R-PP) to the Forest Carbon Partnership Facility in
2013 and has received a four-year readiness grant to implement the R-PP and to develop its REDD+
strategy. The readiness grant will fund the implementation of the R-PP, which began in 2014 and is
expected to last 4 years. It is likely that Fiji will develop a subnational-level programme through pilot
projects that will later be nested into a national programme. National pilot projects are underway in
Emalu, Navosa province (Viti Levu) and Vinuvia (Vanua Levu). There are also community projects
being implemented by Conservation International in Ra Province (Viti Levu) and by Live and Learn on
Drawa (Vanua Levu) (the REDD desk 2016).
203.5.1 The Nakavaudra Forest Carbon Project
The Nakavaudra Forest Carbon Project in Ra Province is an integrated, multiple-benefit project to
generate offsets to meet Fiji Water’s carbon commitment, to create a buffer around the Nakavaudra
Range rainforest, and to establish a restoration project that provides employment (through
restoration activities in the short term) and sustainable timber harvest in the longer term. The project
involves the planting of hardwood timber species for community income generation as well as native
species on steeper slopes. This project is expected to be verified against the Climate, Community, and
Biodiversity Standard and Verified Carbon Standard (Conservation International 2016).
3.5.2 Drawa Community REDD+ Project
The Drawa Community REDD+ Project, Vanua Levu, involves changing land use from logging to forest
protection with carbon. The area is protected by a 30-year perpetually renewable lease covenant;
landowners have given up their rights to harvest timber and instead will sell carbon offsets. This
project will generate 22,764 carbon credits annually, with the first issuance expected in the first
quarter of 2017. Credits are certified to the Plan Vivo Standard (Ekos 2017).
3.5.3 Challenges and opportunities for expansion
Most REDD+ projects rely on a solid demand for their credits to remain viable. To date, most of this
demand has come from voluntary buyers and bilateral government deals as the compliance offset
market for carbon has been slow to develop. While demand has been increasing, the sheer volume of
supply far outweighs the demand for these credits (Fig. 4) (Forest Trends Ecosystem Marketplace
2015). This oversupply will be an on-going risk to these projects in the short- to medium-term (and
possibly longer).
21Figure 4 Historical voluntary offset (or credit) supply and demand including estimated future supply and demand
based on assumption of lower prices but very positive policy signals
3.6 Ecolabels
3.6.1 Fiji’s tuna industry
In 2012, the Fiji Tuna Boat Owners Association (FTBOA)’s albacore longline fishery was certified as
sustainable by the Marine Stewardship Council (MSC). This certification was not only the first fishery
to be certified in Fiji, but it was also the first tuna longline fishery in the world to be certified (MSC
2016). The key opportunity with MSC certification is the potential to develop new markets in countries
with high demand for certified sustainable seafood (WWF 2012).
3.6.2 Challenges and opportunities for expansion
This type of mechanism depends on the ability of an industry/area/organisation to meet certification
requirements on an on-going basis and on markets being prepared to either pay a premium for these
products or to give preferential access for these products in their market. To achieve scale, these
mechanisms often rely on many small operators individually meeting the standards/requirements of
the ecolabel.
224. ENVIRONMENTAL AND CONSERVATION ISSUES: AN OVERVIEW
A range of environmental and conservation issues and challenges in Kadavu where identified through
district ICM meetings, through a series of participatory workshops on ecosystem services held at the
district level, through household surveys conducted across Kadavu, and through meeting with local
officials.
Through the ecosystem services workshops, the environmental issues and resources were spatially
mapped (see Greenhalgh et al. 2016). Coastal inundation, poaching in qoliqoli (community marine
areas), sedimentation of the coastal zone (particularly related to road development), and water source
contamination/supply were noted by many villages and districts as important environmental issues.
While burning was not noted as being important by communities, it was noted as a problem by
Ministry of Agriculture staff on Kadavu. There was also a heavy dependence on yaqona for commercial
cash cropping. It was noted in a number of the strategy sessions associated with the participatory
ecosystem services workshops that some districts were interested organic agriculture production and
also that there seemed to be an increasing use of chemicals, mostly herbicides, for agricultural
production.
Within the terrestrial and marine space are some important areas of biodiversity. In the Nakasaleka
and Nabukelevu districts are forested areas rich in endemic species, including Kadavu Shining (Musk)
Parrot, Kadavu Honeyeater, Kadavu Fantail, and Whistling Dove (Masibalavu & Dutson 2006). The
northern part of the island is home to the Great Astrolabe Reef, which is noted for its rich sea life.
Species such as the large potato cod spawn off Sanima Province and the general health of the reefs
around Kadavu is considered sound.
As the Integrated Coastal Management (ICM) Plan for Kadavu is still being finalized, we will be using
the observations from the district ICM meetings, district-level ecosystem service workshops,
household surveys, and meetings with local officials as a basis for identifying potential economic and
financial mechanisms.
5. FEASIBILITY OF ECONOMIC AND FINANCIAL MECHANISMS
Of the possible mechanisms to consider (Table 2/Fig. 3) the more appropriate mechanisms in the
Kadavu context include:
User fees/levies: leveraging the unique biodiversity and natural resources on and around
Kadavu.
Environmental markets: financial incentives to improve environmental stewardship.
Eco-labelling: incentive to grow crops in an environmentally sustainable manner to maintain,
protect, and/or improve the current state of native and agricultural ecosystems.
These mechanisms are examined further in this assessment. The initial feasibility screening is based
on a rapid market assessment to eliminate those mechanism with a limited (or no) viable market
(Table 2). An assessment of the risks and opportunities is then undertaken. To carry out these
assessments a number of people and organisations were consulted and they are listed in Appendix 1.
23Table 2 Summary of assessment components used for the feasibility assessment
Assessment component Elements
Initial screening: Market assessment Supply of environmental good/service
Demand for the environmental good/service
Extended assessment: Risks and opportunities Operational risks and opportunities
Regulatory and legal risks and opportunities
Reputational risks and opportunities
Market and product risks and opportunities
Financing risks and opportunities
Cost-benefit analysis Net present value of options
5.1 Market Assessment
The market assessment examines the potential supply and demand for the environmental goods
and/or services being enhanced/created/protected through the use of economics or financial
mechanisms. If the supply and/or demand is not regular or is limited in size or lifespan then the
mechanism is not considered feasible in this assessment for on-going conservation purposes.
Enforcement and implementation challenges are also considered within the rapid assessment.
5.1.1 User fees/levies
This mechanism charges a fee or levy on resource users. In the Kadavu context, there are four key
resource users to which a fee/levy could be applied: tourists/visitors with primarily non-consumptive
uses of the natural environment (the exception would be fishing), farmers who utilise the land to grow
crops or to graze livestock, fishers who predominantly fish in the in-shore fishery, and the
communities who will soon start harvesting the planted pine. Fees or levies are only considered for the
commercial use of resources, not where the resource is used for subsistence purposes.
a) Coral reefs, beaches, natural areas: There is a good
Box 1: Regulation of surfing areas decree
supply of coral reefs, beaches, and natural areas in 2010 (Fiji Government 2010)
Kadavu (Table 3). However, the Surfing Decree
(Box 1) makes it difficult for communities to lease, Section 6(1) Any person may, whether
individually or in a group, access and
license, or use some other instruments in relation use any surfing area for the purposes of
to surfing areas (where surfing is defined as surfing or any water sport, without
surfing and any other water sport). It should be obtaining any permit or approval from
noted that there is an informal fee arrangement in any person and without the payment of
any monies or any compensation to any
place when divers dive in areas outside their person, for the use of any such surfing
resort’s dive sites. However, diving outside resort area.
dive sites is not common given the number of
excellent dive sites accessible to each resort (Dive manager, Matana/Dive Kadavu, 25 July
2016).
24In terms of demand by visitors/tourists to use these resources, there are 11 resorts/
accommodation places in Kadavu ranging from the basic to 6-star luxury (See Appendix 2).
Visitor statistics are not available specifically for Kadavu. However, the ‘others’ category in the
visitor statistics (which includes Kadavu) indicate room occupancy is approximately 20% in
those areas (Fiji Bureau of Statistics 2017). Based on our conversations with Matana Resort,
this estimate is reasonable (Selini Nasaica, Matana/Dive Kadavu, 20 July 2016). Travel to
Kadavu is restricted to five direct flights per week from Nadi to Kadavu and one direct flight
per week from Suva to Kadavu on small planes to Vunisea (Fiji Airways 2017), private sea
plane, helicopter flights, and the cargo/passenger ferry from Suva. The International Visitor
Survey 2014 noted that the vast majority of visitors visited outlying areas of Fiji for rest and
relaxation (~80%) (Tupou Moeofo, Tourism Fiji, pers. comm., 28 April 2017).
Given the relatively limited number of visitors, limited access, and the implications of the
Surfing Decree, the implementation of a visitor fee or levy is not considered to be feasible at
this time. The situation on Kadavu is quite different to Vatu-i-Ra, especially in terms of access
for tourists. The number of potential tourists will be always restricted by the limited number of
flights or boats to Kadavu. In Vatu-i-Ra the access to the area and number of potential visitors
is likely to grow over time given it is located on Viti Levu, the main entry point into Fiji. In
Kadavu there is also an informal dive fee operating but there is not anything similar in the
Vatu-i-Ra.
b) Agricultural land: While yaqona is commercially grown, remaining agricultural production is
largely subsistence. The land used for agricultural production is owned and managed by
communities. While some land that is currently forested could be converted to agricultural
production (Table 4), the ownership structure and the large number of subsistence farmers
mean that it would be difficult to collect any levy or fee on the use of agricultural land for
commercial production, particularly in those less accessible areas. This mechanism is also a
regulatory mechanism and therefore typically perceived less favourably than voluntary
mechanisms, such as eco-certification which is described later. For these reasons we do not
consider this option to be feasible.
c) Fishery: The in-shore fishery is owned and managed by communities. Each village has its own
qoliqoli of which a certain portion has typically been set aside as a no-take zone (or locally-
managed marine areas; LMMAs). As with the agricultural land, there is a mix of subsistence
and commercial fishing. The state of the fishery is mixed, and poaching is considered a
challenge (Table 3). Approximately 65% of villages in the household survey conducted in 2016
indicated that poaching was a challenge, with 86% of those villages that perceived poaching as
being a challenge believing it is getting worse. Greenhalgh et al. (2016) provides more
information on fish consumption, fisheries, and LMMAs.
There was also some uncertainty by communities as to their ability to enforce any fishing
restrictions in LMMAs caused by the Surfing Decree. Given the ownership structure, the large
number of potential users of the fisheries, and variability of when fishing is occurring, who is
fishing, and the amount caught, it would be difficult to implement a user fee or levy. Therefore,
we do not consider this option to be feasible.
There is some big game fishing around Kadavu but similar to the coral reefs, beaches and
natural areas above a fishing fee would be limited by the visitor numbers. Therefore, such a fee
is not considered any further.
25d) Forestry: Pine was widely planted across Kadavu (Fig. 5). Many of these pines are at
harvestable age and a portable sawmill has been bought in to process the pine (Kadavu
Provincial Administrator, pers. comm., July 2016). The actual area under pine is not known and
it is not yet clear whether all the pines will be harvested or whether the areas being harvested
will be replanted. The cost of transporting the pines is expected to be high, and there are
challenges with loading the pines onto sea transport. Therefore, there have been community
discussions on the use of the harvested pine for local construction instead of sending the logs
to Suva or other markets (Isoa Korovulavula, pers. comm., April 2017). It is expected that the
supply of this resource is therefore limited over the long–term, and it would not be feasible to
place a levy or fee on the harvested timber.
Table 3 Resources on Kadavu
Resource Resource User Resource condition
Coral reefs, Visitor/tourist The general condition of these areas are being maintained (pers. comms,
beaches, community members in ecosystem service workshops, July 2016).
natural However, some degradation has been experienced in specific
terrestrial circumstances (e.g. building of roads) and also through coastal inundation
areas (Greenhalgh et al. 2016).
Exotic forest Foresters Much of the areas planted for pine is ready for harvest.
Agricultural Village/ 6–42% of the class 1 and 2 land is being used for agricultural purposes
land communities (Table 4). It is generally believed by community members that the
condition of land is being maintained (pers. comms, community members
in ecosystem service workshops, July 2016). Communities note land slips
and erosion in some areas due to livestock grazing and cropping. There is
also an increasing use of fertilisers and herbicides in some areas, which
may indicate changes in production practices rather than a decline in land
condition (Greenhalgh et al. 2016).
Ocean/reef Villages/ The health of the fishery is mixed. Responses by community members
fishery communities indicated that health is declining in some areas/species and improving in
other areas/species. Poaching is perceived to be an increasing threat
(Greenhalgh et al. 2016).
26Table 4 Agricultural statistics for Kadavu Island (Source: Kadavu Provincial Administrator, 2017)
Districts Population Demography Arable Land & % of Usage
Average
Total Yaqona
No. 19- Yaqona Yaqona
No. of Existing Class Used % of per Plants
Tikina of Population 55yrs Class 2 Total (qty)
Value (FJ$)
Household Farmers 1 Land usage Farmer
Vlg
Male (ha)
Nabukelevu 11 460 2,266 512 366 191 1,287 1,478 465 31% 375 137,250 4,117,500
Yawe 6 138 717 186 142 104 830 934 390 42% 880 125,000 3,750,000
Ravitaki 8 221 786 196 246 347 1,342 1,689 452 27% 673 165,500 4,965,000
Tavuki 10 315 1,427 299 333 410 2,428 2,838 438 15% 1,135 378,000 11,340,000
Sanima 11 302 559 131 534 177 2,215 2,392 258 11% 215 115,000 3,450,000
Naceva 6 131 1,450 579 110 463 2,975 3,438 434 13% 559 61,500 1,845,000
Yale 5 122 343 352 92 87 1,120 1,207 192 16% 302 27,750 832,500
Nakasaleka 12 251 2,446 72 333 528 3,016 3,544 480 14% 627 208,750 6,262,500
Ono 6 154 741 176 132 189 2,027 2,216 143 6% 114 15,000 450,000
Total 75 2,094 10,695 2,503 2,288 2,496 17,240 19,736 3,252 16% 539 1,233,750 37,012,500Figure 5 Planted pine in Kadavu (Source: Kadavu Provincial Administrator, 2017)
5.1.2 Environmental markets
Three environmental markets are considered:
Biodiversity offsets/market related to development
Carbon market through a reduction in burning and/or clearance of forested land for
agriculture.
Water quality market related to degradation from farming and road development.
5.1.2.1 Biodiversity offsets
There is little private development8 on Kadavu and therefore little pressure on biodiversity. The one
exception would be the proposed road development. This development is government-financed to
support the economic development of the area. For this type of market, the government would be the
buyer and the community would be the supplier of alternative areas of biodiversity protection. There
are a number of points to consider with this mechanism in this context:
The community needs for improved transport access to many areas is likely to override
decisions on whether to build roads or not.
8Agricultural development is considered community development as land is not being sold to outside investors
who then benefit from commercial production. Environmental impact assessment requirements have been strengthened for infrastructure
development projects (Department of Environment, pers. comm., 26 April 2016).
The roads are unlikely to pass through the areas of high terrestrial biodiversity.
Coastal zone impacts are likely to dominate, e.g. impacts of sedimentation.
5.1.2.2 Water quality markets
Water quality is perceived to be quite good for most of the island. There were some exceptions noted
in the ecosystem services workshops in July 2016 where water quality issues were mentioned in
relation to past road development and where farms were upstream of drinking water sources. For this
mechanism the buyers would be communities and therefore are not likely to participate in any formal
market. Sources of contamination from farming areas can be addressed through moving farming fields
and the Department of Environment has been notified of the on-going sedimentation issues related to
the road. This mechanism is not pursued further due to the localised nature of the impacts and the
challenges with legacy issues that would not be addressed through this kind of market.
5.1.2.3 Carbon markets
The REDD+ carbon market, if any, is the most likely environmental market to evolve in Kadavu. As
noted in the section on user fees and levies above, there is uncertainty about the likelihood of
replanting after pine is harvested. There are two areas known for high terrestrial biodiversity, namely
Nabukelevu and Nakasaleka (Korovulavula 2016). For a REDD+ project to be viable, there needs to be
a threat of loss. While there was some indication of pressure on forested areas for agricultural
expansion, communities surrounding these areas of high biodiversity indicated in the ecosystem
workshops conducted in July 2016 that they understood the value of these areas and would not expect
these areas to be cleared in the future. In addition, as indicated in Section 3, the expected supply of
these types of credits exceeds the current demand and future demand is uncertain.
Therefore, environmental markets mechanisms are not considered any further in this feasibility
assessment.
5.1.3 Eco-certification
Yaqona is the most commonly grown commercial crop and would be the mostly likely candidate for
eco-certification (Greenhalgh et al. 2016). The supply of yaqona is increasing in Kadavu and there is
additional land that could be utilised for yaqona production (Table 4). The interest in organic
production is also quite high in Kadavu with the chief of Daviqele village stating that the whole district
of Nabukelevu wants to go organic (Nabukelevu Ecosystem Services Workshop, July 2016).
The demand for kava (yaqona) has been increasing globally, predominantly based on demand from the
US market (Donny Jason Lee, Lami Kava, pers. comms, 27 April 2017). Some concerns were raised by
Lami Kava about the high price of yaqona currently being sought by Kadavu farmers, which has led to
a reduction in their exports to the US; demand in the domestic market, however, has remained steady.
There is an expectation that prices will stabilise again once the perceived and actual shortages related
to Cyclone Winston have been corrected (Donny Jason Lee, Lami Kava, pers. comms, 27 April 2017).
Exporters indicated there is a likely demand for certified organically grown yaqona, and some
exporters (Agricultural Marketing Authority, A1 Kava and Spices, Lami Kava) are already only
sourcing yaqona from areas that are more likely to be organic. One exporter, the Agricultural
Marketing Authority, stated that they no longer buy yaqona from Vitu Levu or Tavenui because of the
expected use of chemicals; instead, they buy from the outer islands (but not Kadavu). Based on the July
2016 household survey most yagona is grown without the use of chemicals, but there was concern
29You can also read