Feasibility of the Olympic marathon under climatic and socioeconomic change - Nature
←
→
Page content transcription
If your browser does not render page correctly, please read the page content below
www.nature.com/scientificreports
OPEN Feasibility of the Olympic
marathon under climatic
and socioeconomic change
1* 2 2 3
Takahiro Oyama , Jun’ya Takakura , Minoru Fujii , Kenichi Nakajima &
4
Yasuaki Hijioka
There are concerns about the impact of climate change on Olympic Games, especially endurance
events, such as marathons. In recent competitions, many marathon runners dropped out of their
races due to extreme heat, and it is expected that more areas will be unable to host the Games due to
climate change. Here, we show the feasibility of the Olympic marathon considering the variations in
climate factors, socioeconomic conditions, and adaptation measures. The number of current possible
host cities will decline by up to 27% worldwide by the late twenty-first century. Dozens of emerging
cities, especially in Asia, will not be capable of hosting the marathon under the highest emission
scenario. Moving the marathon from August to October and holding the Games in multiple cities in
the country are effective measures, and they should be considered if we are to maintain the regional
diversity of the Games.
The global land temperature in 2011–2020 increased by 1.59 °C from 1850 to 1900 and is projected to increase
throughout the twenty-first century1. Heat stress, which is a stress effect on an organism that results from
exposure to excessive ambient t emperatures2, has become apparent in humans and is expected to increase fur-
ther. During 1991–2018, 37% of heat-related deaths in 732 locations across all continents were attributable
to anthropogenic climate change3. Population exposure to “deadly heat” (wet bulb temperatures above 32 °C)
may increase by a factor of five to ten by 2070–2080 compared with 20204, and the number of excess global
temperature-related deaths is projected to be 83 million with the 4.1 °C rise by 21005. While elderly individuals
and children are particularly vulnerable to heat stress, individuals competing in outdoor sports may also be at
risk6. Tennis matches were suspended during the 2014 Australian Open after temperatures exceeded 43°C7, and
40 of 68 female marathon runners dropped out at a temperature of 33 °C with 73 percent humidity in the 2019
IAAF World Championships in Doha8. High air temperatures and elevated humidity negatively affected the
performance of Olympic marathon runners in 1896–20049.
The marathon is one of the most symbolic events of the modern Summer Olympic Games (hereinafter called
the Games), which are the most watched and most expensive event on e arth10; thus, the feasibility of the marathon
in the Games has important implications both for the health of athletes and the culture of modern humanity.
Smith et al.11 revealed that few cities outside of Western Europe will be viable to hold the Olympic marathon
by 2085 under the Representative Concentration Pathway (RCP) 8.5 based on the wet bulb globe temperature
(WBGT)12. DeChano-Cook and S helley7 pointed out that many historical host cities of the summer and winter
Games will no longer be suitable because of the increases in temperature and sea level.
The purpose of this study is to explain the feasibility of hosting the Olympic marathon more comprehensively,
considering the variations in climate change projections, the hourly climatic characteristics of cities, future
socioeconomic conditions, and adaptation measures (AMs) that have not been adequately considered in previous
studies. We hypothesize that these climatic, socioeconomic, and adaptation factors all have distinctive impacts
on the feasibility of hosting an Olympic marathon, and this study quantifies these impacts. We consider the
variation in climate change by projecting the future WBGT in August in the mid- and late twenty-first centuries
(2040–2059 and 2080–2099) using seven global climate models (GCMs; namely, GFDL_ESM2M, HadGEM2_
ES, IPSL_CM5A_LR, MIROC5, MIROC_ESM, MRI_CGCM3, and NorESM1_M) and four emission scenarios
(RCP 2.6, 4.5, 6.0, and 8.5)13. Since an increase in the WBGT has a negative impact on the performance of most
1
Department of Environment Systems, Graduate School of Frontier Sciences, The University of Tokyo, 5‑1‑5,
Kashiwanoha, Kashiwa 277‑8561, Japan. 2Social Systems Division, National Institute for Environmental Studies,
16‑2, Onogawa, Tsukuba 305‑8506, Japan. 3Material Cycles Division, National Institute for Environmental
Studies, 16‑2, Onogawa, Tsukuba 305‑8506, Japan. 4Center for Climate Change Adaptation, National Institute for
Environmental Studies, 16‑2, Onogawa, Tsukuba 305‑8506, Japan. *email: oyama.takahiro@nies.go.jp
Scientific Reports | (2022) 12:4010 | https://doi.org/10.1038/s41598-022-07934-6 1
Vol.:(0123456789)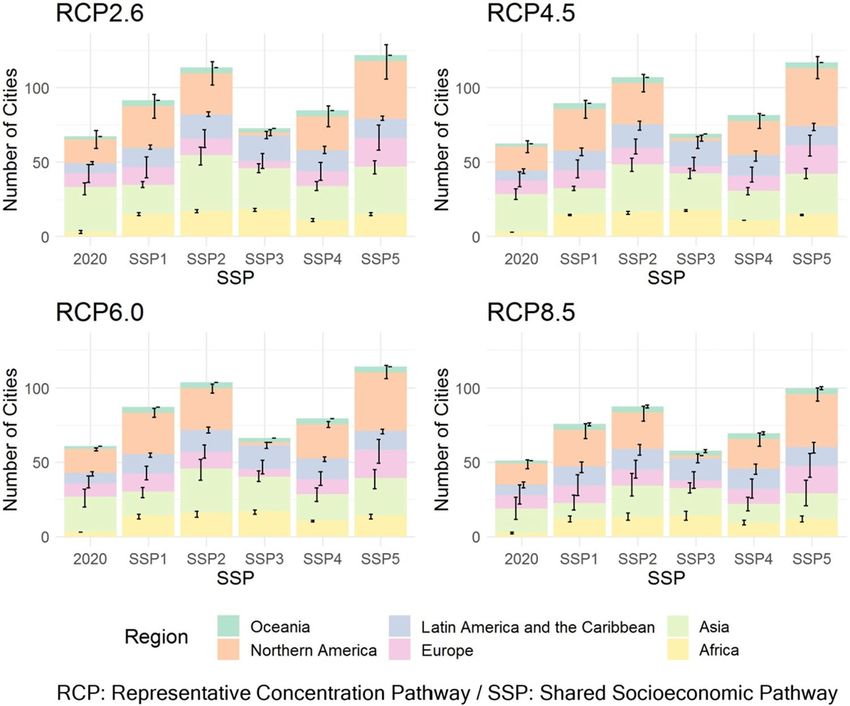
www.nature.com/scientificreports/
marathon runners including elite athletes14,15, and since the WBGT standards suggested by the International
Institute for Running Medicine (IIRM)16 and American College of Sports Medicine (ACSM)17 are referred to
in the management of various marathons, we adopt the WBGT as an indicator of the feasibility of hosting an
Olympic marathon. We utilize the seven GCMs included in the S14 retrospective meteorological forcing dataset
(S14FD)18, which was developed based on the Coupled Model Intercomparison Project Phase 5 (CMIP5)19. We
reproduce hourly urban climatic characteristics by applying a bias correction using meteorological observation
data based on the method of Takakura et al.20. We consider future socioeconomic conditions using the param-
eters of population21,22, the gross domestic product (GDP)23, and its growth rate in the 2030–2050 period and
the 2070–2090 period, both are 10 years before the evaluation periods, based on the five Shared Socioeconomic
Pathways (SSPs)24. We quantify the effects of AMs that have been adopted or considered in recent Games, such
as holding the marathon late at night or early in the morning. The main text presents the results for the late
twenty-first century (2080–2099), while the results for the mid-twenty-first century (2040–2059) are presented
in the Supplementary Information (SI).
Results
Climate change impacts under current socioeconomic conditions. First, to clarify the impact of
climate change alone, we evaluated the number of cities that could host the Olympic marathon in August dur-
ing the late twenty-first century (2080–2099) under the socioeconomic conditions in 2020, changing only the
climatic conditions according to the four RCPs. A total of 70 cities in 25 countries were selected based on (1)
socioeconomic conditions as of 2010 (an urban population of 2.5 million or more, a national GDP of 300 billion
dollars or more (purchasing power parity (PPP), Int’l $ 2005) as of 2010 and a GDP growth rate above 0% as of
2010–2015); (2) an elevation of less than 1,600 m 11; and (3) the availability of meteorological data for WBGT
correction using the method of Takakura et al.20. See the Methods section for the rationale behind the selection
criteria above.
As evaluation criteria for cities, the WBGT levels were set as follows based on the four alert levels (low, mod-
erate, high, and extreme) in the IIRM Medical Care m anual16.
WBGT level 1 (good): There is a greater than 90% probability that the WBGT will fall below 18°C for at
least three consecutive hours between 7:00 and 21:00 in August. WBGT level 1 corresponds to a low alert
level and “good conditions” in the IIRM’s manual.
WBGT level 2 (caution): Level 1 does not apply, and there is a greater than 90% probability that the WBGT
will fall below 22°C for at least 3 consecutive hours between 7:00 and 21:00 in August. WBGT level 2 cor-
responds to a moderate alert level and “less than ideal conditions” in the IIRM’s manual.
WBGT level 3 (warning): Levels 1 and 2 do not apply, and there is a greater than 90% probability that the
WBGT will fall below 28°C for at least 3 consecutive hours between 7:00 and 21:00 in August. WBGT level
3 corresponds to a high alert level and “potentially dangerous conditions” in the IIRM’s manual.
WBGT level 4 (cancel): Levels 1, 2, and 3 do not apply. WBGT level 4 corresponds to an extreme alert level
and “event cancelled / extreme and dangerous conditions” in the IIRM’s manual.
We determine that cities with WBGT levels of 1 to 3 can host the Olympic marathon, while those with a
WBGT level of 4 cannot. It has recently been found that the performance of elite marathon runners improves as
the dry bulb temperature r ises25, which is closely related to the WBGT. However, there would have been few cases
where the WBGT exceeded 28 °C in the Berlin Marathon races covered in the study even momentarily, based
on the dry bulb temperature range in the races. Therefore, the use of WBGT Level 4 (28 °C) as a threshold for
the impossibility of holding a marathon is consistent with the results of the aforementioned research. The 90%
lympics11,26,27,
criterion is set in reference to previous studies on the feasibility of hosting the summer and winter O
and the duration (3 h) and timing (between 7:00 and 21:00 in August) is set based on the general competition
time of the Olympic marathon, where all Olympic marathons since the 1980 Moscow Olympics were held, except
for the men’s and women’s marathons at the 1988 Seoul and 2000 Sydney Olympics, the women’s marathon at
the 1996 Atlanta Olympics, and the women’s marathon at the 2020 Tokyo Olympics, which was moved up by an
hour the day before to start at 6:0028–33.
As a result, globally, the number of cities that can host the Olympic marathon (WBGT levels 1–3) significantly
decreases as the amount of greenhouse gas emissions increases toward the late twenty-first century (2080–2099)
(Fig. 1). Under historical (1994–2013) climate conditions, all cities (70 cities) can host the Olympic marathon,
while the number of cities decreases to 67.3 (96%) under RCP2.6 and to 51.0 (73%) under RCP8.5 in 2080–2099.
The number of safer cities with WBGT levels 1 to 2 decreased from 24 (34%) under historical climate conditions
to 20.7 (30%) under RCP2.6 and to 12.3 (18%) under RCP8.5. The error bars indicate the range between the
maximum and minimum values of the seven GCMs, and the ranges are large enough to be considered. Therefore,
under the current situation where it is not possible to judge the superiority of a particular GCM, the results based
on various GCMs, as shown in this paper, are more reliable. The detailed number of cities, including the upper
and lower limits by the seven GCMs, is given in Supplementary Table 1. The results for the mid-twenty-first
century (2040–2059) are shown in Supplementary Fig. 1 and Supplementary Table 2.
Regionally, there are three patterns in the decrease in the number of cities that can host the Olympic marathon
(Fig. 2). The number of cities by country is shown in Supplementary Fig. 3 and the result for the mid-twenty-first
century (2040–2059) is shown in Supplementary Fig. 2.
Pattern 1: Asia. The number of cities that can host the Olympic marathon decreases significantly as the
amount of greenhouse gas emissions increases. Among the viable cities, the number of cities with a relatively
low heat risk (WBGT levels 1–2) is very small and will decrease further with climate change. This result may
Scientific Reports | (2022) 12:4010 | https://doi.org/10.1038/s41598-022-07934-6 2
Vol:.(1234567890)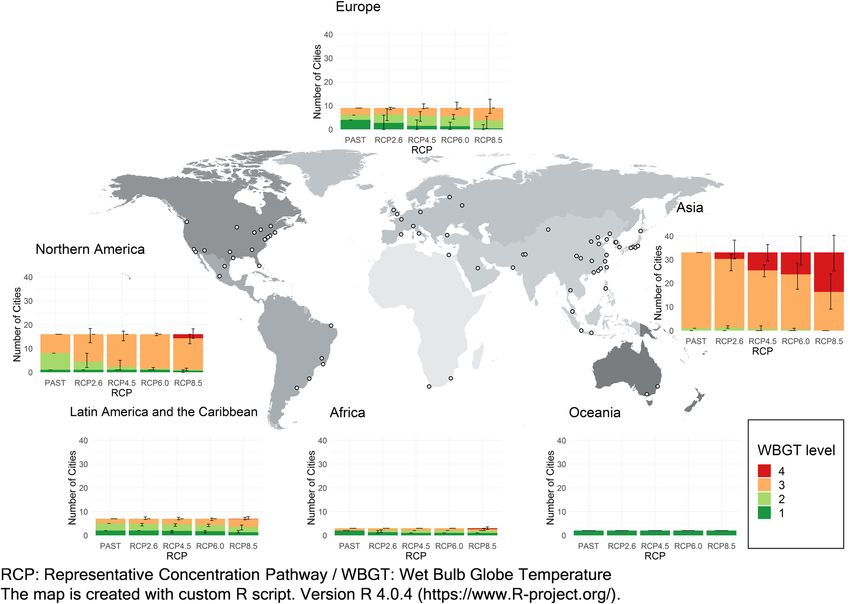
www.nature.com/scientificreports/

                                 Figure 1.  The WBGT levels of 70 cities in August in the late-twenty-first century (2080–2099). The cities are
                                 selected under the socioeconomic conditions in 2010. The bars represent the average of the seven GCMs. Error
                                 bars indicate the range between the maximum and minimum values of the seven GCMs.

                                 Figure 2.  The WBGT levels of 70 cities in August in the late-twenty-first century (2080–2099) by region. The
                                 cities are selected under the socioeconomic conditions in 2010. The bars represent the average of the seven
                                 GCMs. Error bars indicate the range between the maximum and minimum values of the seven GCMs.

Scientific Reports |   (2022) 12:4010 |              https://doi.org/10.1038/s41598-022-07934-6                                                   3

                                                                                                                                          Vol.:(0123456789)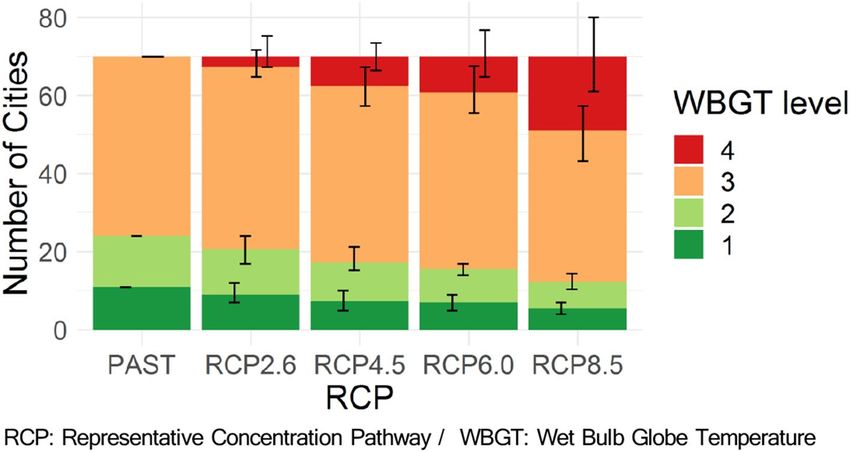
www.nature.com/scientificreports/
be because many cities in Asia are in the mid-latitude zone of the Northern Hemisphere and are affected by the
Asian monsoon, resulting in hot and humid summers.
Asia: This region contains the largest number of cities (33) out of the 70 total cities. Under historical
(1994–2013) climate conditions, all cities (33 cities) can host the marathon, while the number of cities
decreases to 30.3 (92%) under RCP2.6 and to 16.3 (49%) under RCP8.5. The number of cities with a
relatively low heat risk (WBGT levels 1–2) decreases from 1 (3%) under historical climate conditions to
none under RCP8.5.
Pattern 2: North America, Latin America and the Caribbean, and Africa. The number of cities
that can host the event (WBGT levels 1–3) only slightly decreases even under the highest emission scenario,
while the number of cities with a relatively low heat risk (WBGT levels 1–2) will decrease due to climate change.
This finding may be because many cities are in the high latitudes of the Northern Hemisphere (North America)
or the Southern Hemisphere (Latin America and the Caribbean, and Africa) and are thus less likely to be hot and
humid in August than Pattern 1 (Asia).
North America: This region contains the second largest number of cities (16 cities). Under historical
(1994–2013) climate conditions, all cities can host the marathon. Under RCP8.5, the number of cities
decreases to 15.3 (96%), but under the other scenarios, the number of cities does not change at all or
remains mostly unchanged. The number of cities with relatively low heat risk (WBGT levels 1–2) decreases
from 8 (50%) under historical climate conditions to 4.4 (28%) under RCP2.6 and to 1.0 (6%) under RCP8.5.
Latin America and the Caribbean: This region contains the third-smallest number of cities (7 cities).
Under historical (1994–2013) climate conditions, all cities can host the marathon. The number of cities
does not change at all or only slightly decreases under the four RCP scenarios. The number of cities with
a relatively low heat risk (WBGT level 1–2) decreased from 5 (71%) under historical climate conditions
to 3.6 (51%) under RCP8.5.
Africa: The region contains the second-smallest number of 3 target cities. Under historical (1994–2013)
climate conditions, all cities can host the Olympic marathon. The number of cities decreases to 2.6 (87%)
under RCP8.5, but under the other scenarios, the number does not change at all or remains mostly
unchanged. The number of cities with a relatively low heat risk (WBGT levels 1–2) does not decrease
even under RCP8.5, however, the number of cities with WBGT level 1 decreases from 2 (66%) to 1 (33%)
under RCP8.5.
Pattern 3: Europe and Oceania. The number of cities that can host the Olympic marathon does not
decrease even under the highest emission scenario. There were originally many cities with a relatively low heat
risk (WBGT levels 1–2), which will be the case under future climate conditions. This finding may be because
many cities are in the high latitudes of the Northern Hemisphere (Europe) or in the Southern Hemisphere (Oce-
ania), where the WBGT is unlikely to be high in August.
Europe: This region contains the third largest number of target cities, 9. Under historical (1994–2013)
climate conditions, all cities can host the Olympic marathon, and under all RCP scenarios, the number
does not change at all. The number of cities with a relatively low heat risk (WBGT levels 1–2) decreases
from 6 (67%) under historical climate conditions to 3.7 (41%) under RCP8.5.
Oceania: This region contains the smallest number of target cities, 2. Even under the highest emission
scenario, the number of cities that can host the Olympics does not decrease, and all four cities are deter-
mined to be safe (WBGT level 1) under all RCP scenarios.
Climate change impacts under future socioeconomic conditions. Next, we estimate the number
of cities that can host the Olympic marathon in the late twenty-first century (2080–2099), considering future
socioeconomic scenarios (SSPs 1–5) (Fig. 3). Here, all combinations of the four RCPs and five SSPs are shown to
identify the wide range of impacts due to climate change and socioeconomic conditions, but it should be noted
that the combinations of RCP2.6 and SSP3 and RCP8.5 and SSPs 1–4 are infeasible24. The number of cities by
country is shown in Supplementary Figs. 3–8, and the results for the mid-twenty-first century (2040–2059) are
shown in Supplementary Figs. 9–14.
We selected target cities using the same criteria as in the evaluation of 70 cities for current socioeconomic
conditions. The numbers of selected cities for the five SSPs are 94 for SSP1 (sustainability scenario), 120 for SSP2
(middle of the road scenario), 79 for SSP3 (regional rivalry scenario), 90 for SSP4 (inequality scenario), and 126
for SSP5 (fossil-fueled development scenario).
Globally, as in the results under current socioeconomic conditions, the number of cities that can host the
Olympic marathon tends to decrease as the amount of greenhouse gas emissions increases, especially in Asia. The
number of cities under each emission scenario is the highest for SSP5 and the lowest for SSP3. Under all SSPs,
the number of possible host cities increases from the current socioeconomic conditions (2020). For example,
under RCP2.6, the number of cities ranges from 72.7 (SSP3) to 122 (SSP5), while under RCP8.5, the number of
cities ranges from 57.6 (SSP3) to 99.9 (SSP5).
For all SSPs, the number of possible cities under RCP8.5 is approximately 20% lower than that under RCP2.6,
and the impact of the emission scenarios is apparent. Dozens of emerging cities, mainly in Asia, that could host
Scientific Reports | (2022) 12:4010 | https://doi.org/10.1038/s41598-022-07934-6 4
Vol:.(1234567890)www.nature.com/scientificreports/
Figure 3. The number of cities that can host the Olympic marathon in August in the late-twenty-first century
(2080–2099) by RCP/SSP/region. The bars represent the average of the seven GCMs. Error bars indicate the
range between the maximum and minimum values of the seven GCMs.
the summer Olympics due to economic development under the low emission scenarios will not be able to host
the Olympics under RCP8.5, the highest emission scenario.
Effects of adaptation measures on climate change impacts under future socioeconomic condi-
tions. In this section, we evaluate the change in the number of cities that can host the Olympic marathon in
August due to AMs in the late twenty-first century (2080–2099) (Fig. 4). The four types of AMs in Table 1 are
adopted in this study. AM 1, 2, and 3 have been adopted or considered for the recent Games and can be repro-
duced with the spatiotemporal resolution of this study. AM 4 implements 1, 2, and 3 at the same time. The results
for all four RCPs in the mid- and late-twenty-first centuries are shown in Supplementary Figs. 15–18.
Under RCP2.6, the effects of AMs are limited due to the originally small decrease in the number of host cities
(Fig. 4, upper part). Under RCP8.5, the effects of AMs are more pronounced, and the effects of single AMs are
greater in the order of AM2, AM3, and AM1 (Fig. 4, lower part), while AM1 is the most common measure, and
the majority of the possible cities’ increase occurs in Asia. The effect of AM4, in which all adaptation measures
are implemented simultaneously, is the greatest, and more than 95% of the selected cities will be able to host the
Olympic marathon even under RCP8.5.
The WBGT levels under specific RCPs/SSPs/AMs in the late twenty-first century (2080–2099) are shown
for 19 cities that have hosted and/or are scheduled to host the Games since 1948 (Fig. 5). Note that we excluded
Mexico City, which was the host city in 1968 because its elevation of more than 1600 m did not meet our condi-
tions for city selection.
If no adaptation measures are taken (NM), the number of cities with a high heat risk (WBGT level 3) will
increase from 7 under the past climate to 10 to 12 (out of 19 cities) under the future climate. Even for Tokyo,
which is assumed to be WBGT level 3 at the time of the 2020 Tokyo Olympics, the venues for marathons and
race walks were relocated to Sapporo, a city more than 800 km away in the north, due to concerns about heat36.
Thus, it is highly likely that equivalent measures will be required in other future host cities if they are assessed
as WBGT level 3.
Among the single AMs, the effect of holding the event in October (AM2: Oct) is the highest. In most cities,
the WBGT level will be 1 or 2 even under RCP8.5. On the other hand, in Rio de Janeiro, Sydney, and Brisbane,
which are in the Southern Hemisphere, there are no effects of the measure, or rather, the WBGT level increases.
Holding the event in multiple cities in a country (AM3: BC) may or may not be effective depending on the cities.
Countries with more diverse domestic climates (cooler metropolises) may be advantageous. Notably, this study
does not include cities for which sufficient climate data have not been collected, and the actual effect may be
greater. The case where all AMs are implemented at the same time (AM4: All) is the most effective, with all cities
Scientific Reports | (2022) 12:4010 | https://doi.org/10.1038/s41598-022-07934-6 5
Vol.:(0123456789)www.nature.com/scientificreports/
Figure 4. Change in the number of cities that can host the Olympic marathon due to AMs (RCP2.6, RCP8.5)
in the late-twenty-first century (2080–2099) by SSP/region. The bars represent the average of the seven GCMs.
Error bars indicate the range between the maximum and minimum values of the seven GCMs.
Scientific Reports | (2022) 12:4010 | https://doi.org/10.1038/s41598-022-07934-6 6
Vol:.(1234567890)www.nature.com/scientificreports/
Adaptation measure 1 (AM1: All day) Holding the Olympic marathon between 22:00 and 6:00 in August
Holding the Olympic marathon between 7:00 and 21:00 in October
Adaptation measure 2 (AM2: October) Example: Since 1980, the men’s marathons at the 1988 Seoul Olympics and the 2000 Sydney
Olympics were held in October32
Holding the Olympic Games in multiple cities in a country and the Olympic marathon
between 7:00 and 21:00 in August
Example: The Tokyo Organizing Committee of the Olympic and Paralympic Games changed
Adaptation measure 3 (AM3: By country)
the venue for the women’s and men’s marathons and the race walk from Tokyo to Sapporo,
according to International Olympic Committee (IOC) ’s strong recommendation concerning
the excessive thermal load in Tokyo34
Implementing AMs 1 to 3 simultaneously. This measure has not been implemented or consid-
Adaptation measure 4 (AM4: All)
ered for the Olympic Games to the best of our knowledge
Holding the Olympic marathon between 7:00 and 21:00 in August. All Olympic marathons
since the 1980 Moscow Olympics have been held during this time, except for the men’s and
Cf. No measure women’s marathons at the 1988 Seoul Olympics and 2000 Sydney Olympics, and the women’s
marathon at the 1996 Atlanta Olympics and 2020 Tokyo Olympics, which was moved up by an
hour the day before to start at 6:0028–32,35
Table 1. List of AMs adopted in this study with examples.
&OLPDWH 6RFLHW\ (FRQRP\
+RVWwww.nature.com/scientificreports/
fact that the evaluation is based on hourly WBGT rather than daily average WBGT, as in Smith et al.11, may have
contributed to the difference in results. The use of seven GCMs in this study is also likely to contribute to the
difference in results from Smith et al.11, who used two GCMs, since the error bars in the figures show significant
variations among GCMs. Furthermore, we quantified the impacts of socioeconomic conditions (SSPs 1–5) and
the effectiveness of adaptation measures in addition to the impacts of climate change.
The number of countries participating in the Games has increased from 14 in the first modern Games in
Athens in 189637 to 206 in Rio de Janeiro in 2 01638, and since the Munich Olympics in 1972, each of the Games
has been held on a different continent from the previous one, which suggests that regional diversity is becoming
increasingly important in the Games. If the Games are to be held in various regions of the world in the future,
adaptation measures including the four presented in this paper, are worth considering, in addition to mitigating
the impacts of climate change by reducing greenhouse gas emissions. In particular, these adaptation measures
will be necessary for many cities to be able to host marathons with relatively low heat risk (WBGT levels 1–2).
Hosting the Olympics in October (AM2) was found to be an effective adaptation measure, but it requires
negotiation with broadcasters in North America (US and Canada), which pays the majority of the International
Olympic Committee’s broadcasting rights fees39. In North America, July and August are off-season for sports,
which may be the reason why most of the recent Games have been held in those m onths40. The share of broad-
casting rights fees from Asia, Europe, Central America, South America, and the Caribbean is i ncreasing39, but
it is not clear whether they will be sufficient to offset the possible decline in broadcasting rights fees for North
America. In addition, another effective measure for holding the Games in multiple cities in a country (AM3)
may increase the cost related to infrastructure, security, and logistics; therefore, careful consideration of cost-
effectiveness is necessary.
For example, holding the Games in a city with existing infrastructure and experience in hosting large-scale
sporting events and/or limiting the number of spectators and people involved in the Games would reduce the
costs associated with AM2 and AM341,42. The above proposal is consistent with the proposal by Muller et al.10
from the viewpoint of the sustainability of the Games (e.g., drastic reduction in the scale of the Games or rotating
the Games among the existing host cities).
Some issues should be considered in the future. (1) The Games include many outdoor events other than the
marathon. It is desirable to evaluate the thermal conditions for such events and to consider possible competition
programs within 16 days, which is the basic duration of the Games43. (2) Although the focus of this study is on
athletes, the heat risk to spectators, who make up the majority of those involved, should be considered as well. (3)
In this study, the evaluation was based on the WBGT of representative points in each city, and therefore, micro-
climatic conditions in the city and adaptation measures, such as the construction of heat-shielding pavements,
planting of trees, and misting, were not considered. Such evaluations require a large computational resource for
modeling and/or detailed measurements in the field; therefore, it is realistic to use these methods for a smaller
number of cities. (4) The cities selected in this study may differ from those that can host the Olympic Games in
the future due to the lack of relevant data. Factors such as political rights, experience in hosting world champi-
onships, the population support for the Games, dispute with the IOC, and existing stadium infrastructure are
also important for being selected as a host c ity44, but it is difficult to predict the situation of such factors in the
mid- and late twenty-first centuries. Therefore, we did not include them in the city selection. Additionally, many
cities particularly in Africa and Latin America are excluded due to the lack of sufficient meteorological obser-
vation data to reproduce the climatic characteristics of cities, even though they have sufficient socioeconomic
conditions to be selected. Moreover, from the perspective of sustainability, Olympic Agenda 2 02045, presented
by the IOC as a reform plan for the Olympic Movement, encourages the use of simple temporary facilities rather
than new venues, and it allows the games to be held in locations other than the host city (e.g., where facilities
already exist). Therefore, it is possible that smaller cities than those targeted in this study will be allowed to host
the Olympics in the future. Based on the above, it is necessary to review the conditions for selecting cities in
the future, taking into account the improvement in related data and the trend of sustainability improvement in
the Olympics. (5) The WBGT, which was used as the index in this study, has several limitations, including the
tendency to underestimate heat in environments where sweat evaporation is limited (high humidity and low
wind speed), the inability to take into account conditions such as exercise intensity and clothing, and the lack of
evidence on the relationship with health risks in s ports46,47. In the future, it is necessary to develop more robust
methods for assessing health risks in marathon running and sports in general.
Methods
Selection of cities for evaluation. Referring to the papers that studied the selection of host cities for the
Games44,48 and the conditions of the historical host cities, we selected 165 cities in 66 countries based on the fol-
lowing four perspectives: (1) the urban population, (2) national GDP and its growth rates, (3) elevation, and (4)
the availability of meteorological observation data to reproduce the climatic characteristics of the city. Regarding
socioeconomic conditions, (1) and (2), since the selection of host cities generally starts approximately 10 years
before the G ames48, this study use data from 2010 (for 2020), the 2030–2050 period (for 2040–2059), and the
2070–2090 period (for 2080–2099), 10 years before the evaluation period. The specific conditions for the four
perspectives are described as follows.
Condition 1: The city has a population of at least 2.5 million. A study of bids for the 1992–2020 Summer
Olympic Games pointed out that a city population of 2.5 million or more is an important factor in being selected
as a host c ity44. In reality, competitions are rarely all held in a single city, and in most cases, competitions are
also held in neighboring cities. Therefore, in this study, the selection is made based on the population of urban
agglomerations (“the population contained within the contours of a contiguous territory inhabited at urban
density levels without regard for administrative boundaries”21). We use data from 2010 (for 2020), the 2030–2050
Scientific Reports | (2022) 12:4010 | https://doi.org/10.1038/s41598-022-07934-6 8
Vol:.(1234567890)www.nature.com/scientificreports/
period (for 2040–2059), and the 2070–2090 period (for 2080–2099). The data for each period is acquired or
calculated using the following methods.
2010: The annual population of urban agglomerations in 2 01021.
2030–2050: These data were calculated by multiplying the urban population in 2020 by the ratio of the
projected national population in 2020 and the average population from 2030 to 2050 in five-year intervals
for each S SP22.
2070–2090: These data were calculated by multiplying the urban population in 2020 by the ratio of the
projected national population in 2020 and the average population from 2070 to 2090 in five-year intervals
for each S SP22.
Condition 2: The national GDP is no less than $300 billion (PPP, Int’l $ 2005) and the GDP growth rate is
above 0%. Olympic-related expenditures are often made on a national basis and on a city basis. After the 1992
Summer Olympic Games in Barcelona, no host city had a national GDP of less than $300 billion 10 years before
the Games49. Therefore, we set the threshold at $300 billion. Regarding GDP, its medium-term growth rate is
important for being selected as a host c ity44, and after the 1992 Summer Olympics in Barcelona, there was no
host city with an average national GDP growth rate of less than 0% from 15 to 10 years before the Games. For
these reasons, we set a GDP growth rate of above 0% as a condition. We use data from 2010 (GDP for 2020), the
2010–2015 period (GDP growth rate for 2020), the 2030–2050 period (GDP and its growth rate for 2040–2059),
and the 2070–2090 period (GDP and its growth rate for 2080–2099)22. For each SSP, the national GDPs in 2010,
the average GDP from 2030 to 2050, and the average GDP from 2070 to 2090 are u sed22.
11. Given the negative effects of a high elevation on
Condition 3: The elevation of the city is less than 1,600 m
long-distance running, including marathons that became apparent at the 1968 Mexico City Olympics9, cities
with elevations higher than 1,600 m should not be viable for hosting marathon competitions.
Condition 4: There is a meteorological station within 20 km of the representative point of the city, with at least
2,500 data points collected from May to October (summer season in the Northern Hemisphere) over multiple
years at intervals of 3 h or less. This condition was established to adequately reproduce the site-specific WBGT,
referring to the SI of Takakura et al.20. We used terrestrial weather station d ata51 and solar radiation d
ata52 cor-
responding to the weather stations.
Calculating site‑specific hourly resolution WBGT. To consider holding a marathon in a particular city
for a few hours of the day, it is necessary to calculate the site-specific hourly resolution WBGT. The environmen-
tal conditions during Olympic competitions vary even from start to finish during the same r ace9. In many cases,
the output of GCMs does not provide diurnal variations, and the spatial resolution is coarse (e.g., horizontal
resolution > 50 km), so it is not suitable for this study. Dynamical downscaling of GCM output using regional
climate models (RCMs) is a common solution for spatiotemporally detailed calculations, but it is computation-
ally expensive and not suitable for extensive global studies, such as this one. Therefore, we adopt the method of
Takakura et al.20, which can provide site-specific hourly resolution WBGT prediction with only relatively simple
calculations using GCM outputs, and we can achieve the objective of this study with a reasonable amount of
computation.
In Takakura et al.20, bias correction of WBGT calculated from each grid of GCMs was performed using the
observation records of WBGT in six cities in Japan. In this study, however, we use the hourly resolution meteoro-
logical data of each city to calculate the equivalent WBGT data using the method of Liljegren et al.53 since most
of the cities in the world do not have published WBGT observation records. Additionally, we used natural spline
interpolation to create 24-h data for cities where data existed at 3-h intervals or less and excluded other cities
since many cities do not have a complete set of 24-h observation data. For more explanations of the calculation,
see Takakura et al.20 and Supplementary Fig. 33.
Statistical analysis. The feasibility of hosting the Olympic marathon in each city is assessed by comparing
the 90th percentile of the WBGT between 7:00 and 21:00 in the RCP/target period (e.g. RCP4.5/2080–2099),
averaged over seven GCMs, with the conditions of four WBGT levels defined in “Climate change impacts under
current socioeconomic conditions”. To mitigate the effects of interannual variability of the climate, the period
covered is 20 years, and this setting is commonly used in IPCC reports1. The 90th percentile is used to identify
the 90% probability of the definition of WBGT levels. In Figs. 1, 2, 3 and 4, the maximum and minimum 90th
percentiles of seven GCMs are shown as error bars to represent the variability among climate models.
Setting of adaptation measures. We evaluate the effect of four AMs that have been adopted or con-
sidered in recent Games (except AM4) and can be reproduced with the spatiotemporal resolution of this study.
However, it has not been confirmed whether these measures were considered heat countermeasures when they
were adopted or considered in the past. See Table 1 for details.
Data availability
The datasets generated and/or analyzed during the current study are available from the corresponding author
upon reasonable request.
Received: 14 September 2021; Accepted: 28 February 2022
Scientific Reports | (2022) 12:4010 | https://doi.org/10.1038/s41598-022-07934-6 9
Vol.:(0123456789)www.nature.com/scientificreports/
References
1. IPCC. Climate Change 2021: The Physical Science Basis. Contribution of Working Group I to the Sixth Assessment Report of the
Intergovernmental Panel on Climate Change (Cambridge University Press, 2021).
2. VandenBos, G. R. APA dictionary of psychology. APA dictionary of psychology. https://dictionary.apa.org/heat-stress.
3. Vicedo-Cabrera, A. M. et al. The burden of heat-related mortality attributable to recent human-induced climate change. Nat. Clim.
Change 11, 492–500 (2021).
4. Coffel, E. D., Horton, R. M. & De Sherbinin, A. Temperature and humidity based projections of a rapid rise in global heat stress
exposure during the 21st century. Environ. Res. Lett. 13, 014001 (2018).
5. Bressler, R. D. The mortality cost of carbon. Nat. Commun. 12, 1–12 (2021).
6. Brocherie, F., Girard, O. & Millet, G. P. Emerging environmental and weather challenges in outdoor sports. Climate 3, 492–521
(2015).
7. DeChano-Cook, L. M. & Shelley, F. M. Climate change and the future of international events. In Routledge Handbook of Sport and
the Environment (eds McCullough, B. P. & Timothy, K. B.) 66–78 (Routledge, 2017). https://doi.org/10.4324/9781315619514.ch5.
8. Lenskyj, H. J. Athletes’ rights, Athletes’ lives. in The Olympic Games: A Critical Approach, 145–170 (Emerald Publishing Limited,
2020). https://doi.org/10.1108/978-1-83867-773-220201010.
9. Peiser, B. & Reilly, T. Environmental factors in the summer Olympics in historical perspective. J. Sports Sci. 22, 981–1002 (2004).
10. Müller, M. et al. An evaluation of the sustainability of the Olympic Games. Nat. Sustain. 4, 340–348 (2021).
11. Smith, K. R. et al. The last Summer Olympics? Climate change, health, and work outdoors. Lancet 388, 642–644 (2016).
12. Yaglou, C. P. & Minard, D. Control of heat casualties at military training centers. AMA. Arch. Ind. Health 16, 302–316 (1957).
13. van Vuuren, D. P. et al. The representative concentration pathways: An overview. Clim. Change 109, 5–31 (2011).
14. Ely, M. R., Cheuvront, S. N., Roberts, W. O. & Montain, S. J. Impact of weather on marathon-running performance. Med. Sci.
Sports Exerc. 39, 487–493 (2007).
15. Knechtle, B. et al. The role of weather conditions on running performance in the boston marathon from 1972 to 2018. PLoS ONE
14, 1–16 (2019).
16. Mears, S. & Watson, P. IIRM Medical Care Manual. International Institute for Race Medicine Web site. https://racemedicine.org/
iirm-medical-care/ (2015) https://doi.org/10.2105/AJPH.61.7.1280-b.
17. American College of Sports Medicine. American College of Sports Medicine position stand on prevention of thermal injuries
during distance running. Med Sci Sport. Exerc 16, ix–xiv (1984).
18. Iizumi, T., Takikawa, H., Hirabayashi, Y., Hanasaki, N. & Nishimori, M. Contributions of different bias-correction methods and
reference meteorological forcing data sets to uncertainty in projected temperature and precipitation extremes. J. Geophys. Res.
122, 7800–7819 (2017).
19. Taylor, K. E., Stouffer, R. J. & Meehl, G. A. An overview of CMIP5 and the experiment design. Bull. Am. Meteorol. Soc. 93, 485–498
(2012).
20. Takakura, J., Fujimori, S., Takahashi, K., Hijioka, Y. & Honda, Y. Site-specific hourly resolution wet bulb globe temperature recon-
struction from gridded daily resolution climate variables for planning climate change adaptation measures. Int. J. Biometeorol. 63,
787–800 (2019).
21. United Nations. World Urbanization Prospects: The 2018 Revision. https://population.un.org/wup/Publications/Files/WUP2018-
Report.pdf (2018).
22. Samir, K. C. & Lutz, W. The human core of the shared socioeconomic pathways: Population scenarios by age, sex and level of
education for all countries to 2100. Glob. Environ. Change 42, 181–192 (2017).
23. Dellink, R., Chateau, J., Lanzi, E. & Magné, B. Long-term economic growth projections in the Shared Socioeconomic Pathways.
Glob. Environ. Change 42, 200–214 (2017).
24. Riahi, K. et al. The Shared Socioeconomic Pathways and their energy, land use, and greenhouse gas emissions implications: An
overview. Glob. Environ. Change 42, 153–168 (2017).
25. Knechtle, B. et al. Elite marathoners run faster with increasing temperatures in Berlin marathon. Front. Physiol. 12, 1–10 (2021).
26. Scott, D., Steiger, R., Rutty, M. & Johnson, P. The future of the Olympic Winter Games in an era of climate change. Curr. Issues
Tour. 18, 913–930 (2015).
27. Scott, D., Steiger, R., Rutty, M. & Fang, Y. The changing geography of the Winter Olympic and Paralympic Games in a warmer
world. Curr. Issue Tour. 22, 1301–1311 (2019).
28. International Olympic Committee. TOKYO 2020 Olympic Schedule & Results. https://o lympi cs.c om/t okyo-2 020/o lympi c-g ames/
en/results/all-sports/olympic-schedule.htm (2021).
29. World Athletics. Olympic Games-Past Editions. https://w orlda thlet ics.o
rg/c ompet ition
s/o lympi c-g ames/t he-x xxii-o lympi c-g ames-
athletics-7132391/event-calendar (2021).
30. London Committee of the Olympic Games and Paralympic Games Limited. Official results book XXX Olympic games London 2012.
(London Committee of the Olympic Games and Paralympic Games Limited, 2013).
31. Beijing Organizing Committee for the Games of the XXIX Olympiad. Official report of the Beijing 2008 Olympic Games. (Beijing
Organizing Committee for the Games of the XXIX Olympiad, 2010).
32. Sports Reference LLC. Summer Games Index. https://web.archive.org/web/20200417040515/https://www.sports-reference.com/
olympics/summer/.
33. Novicov, I. & Organising Committee of the Games of the XXII Olympiad, in Games of the XXII Olympiad : official report of the
Organising Committee of the Games of the XXII Olympiad, Moscow, 1980, Vol. 3: Participants and results. (Organising Committee
of the Games of the XXII Olympiad, 1981).
34. Takayama, N., Hori, H. & Watanabe, H. Evaluation of heatstroke risk at Sapporo in the Tokyo 2020 Summer Olympic marathon
event compared with Tokyo. J. Agric. Meteorol. 76, 174–179 (2020).
35. International Olympic Committee. Competition schedule change on women’s marathon. https://o lympi cs.c om/t okyo-2 020/e n/n ews/
competition-schedule-change-on-womens-marathon (2021).
36. International Olympic Committee. International Olympic Committee announces plans to move Olympic marathon and race walking
to Sapporo - Olympic News. https://olympics.com/ioc/news/international-olympic-committee-announces-plans-to-move-olymp
ic-marathon-and-race-walking-to-sapporo (2019).
37. International Olympic Committee. Athens 1896. https://olympics.com/en/olympic-games/athens-1896.
38. International Olympic Committee. Rio 2016. https://olympics.com/en/olympic-games/rio-2016.
39. International Olympic Committee. OLYMPIC MARKETING FACT FILE 2020 EDITION. https://stillmed.olympic.org/media/
DocumentLibrary/OlympicOrg/Documents/IOC-Marketing-and-Broadcasting-General-Files/Olympic-Marketing-Fact-File.pdf
(2020).
40. Boykoff, J. & Gaffney, C. The Tokyo 2020 Games and the End of Olympic History. Capital. Nat. Social. 31, 1–19 (2020).
41. Baade, R. A. & Matheson, V. A. Going for the Gold: The Economics of the Olympics. In Global Entertainment Media: Content,
Audiences, Issues Vol. 30 (ed. Cooper-Chen, A.) 221–236 (L. Erlbaum, 2005).
42. Preuß, H., Andreff, W. & Weitzmann, M. Cost and Revenue Overruns of the Olympic Games 2000–2018 (2019). https://doi.org/10.
1007/978-3-658-24996-0.
43. International Olympic Committee. Charter in force as from 17 July 2020. https://olympics.com/ioc/olympic-charter (2020).
Scientific Reports | (2022) 12:4010 | https://doi.org/10.1038/s41598-022-07934-6 10
Vol:.(1234567890)www.nature.com/scientificreports/
44. Maennig, W. & Vierhaus, C. Winning the Olympic host city election: Key success factors. Appl. Econ. 49, 3086–3099 (2017).
45. International Olympic Committee. Olympic Agenda 2020, in 127th IOC Session, 1–25 (2014).
46. Budd, G. M. Wet-bulb globe temperature (WBGT)-its history and its limitations. J. Sci. Med. Sport 11, 20–32 (2008).
47. Brotherhood, J. R. Heat stress and strain in exercise and sport. J. Sci. Med. Sport 11, 6–19 (2008).
48. Poast, P. D. Winning the Bid: Analyzing the International Olympic Committee’s Host City Selections, vol. 0629 (2007).
49. Gapminder. Total GDP (PPP$, inflation-adjusted). https://www.gapminder.org/data-blog/total-gdp-in-ppp/.
50. NOAA National Centers for Environmental Information. Global Surface Hourly. https://www.ncei.noaa.gov/data/global-hourly/
(2001).
51. Japan Meteorological Agency. Past weather data (hourly) (in Japanese). https://www.data.jma.go.jp/obd/stats/etrn/.
52. NASA/LARC/SD/ASDC. SRB_REL3.0_SW_DAILY_UTC_NC. https://data.nasa.gov/Earth-Science/SRB_REL3-0_SW_DAILY_
UTC_NC/yunj-tnsy (2019).
53. Liljegren, J. C., Carhart, R. A., Lawday, P., Tschopp, S. & Sharp, R. Modeling the wet bulb globe temperature using standard mete-
orological measurements. J. Occup. Environ. Hyg. 5, 645–655 (2008).
Acknowledgements
The authors would like to thank members of the Hijioka-Fujii-Nakajima Laboratory at the University of Tokyo
and the Center for Climate Change Adaptation of NIES for active discussions.
Author contributions
T.O. devised the methods, developed the programs other than those done by J.T., and wrote the manuscript.
J.T. collected and processed the output of the climate model and further developed a program for calculating
the WBGT. M.F., K.N., and Y.H. directed the study. All authors participated in the interpretation of the results,
discussion, and revision of the manuscript.
Competing interests
T.O. is currently working as a full-timer at Mitsubishi Research Institute, Inc., which is associated with research,
consulting, and ICT solutions. The other authors declare no conflicts of interest.
Additional information
Supplementary Information The online version contains supplementary material available at https://doi.org/
10.1038/s41598-022-07934-6.
Correspondence and requests for materials should be addressed to T.O.
Reprints and permissions information is available at www.nature.com/reprints.
Publisher’s note Springer Nature remains neutral with regard to jurisdictional claims in published maps and
institutional affiliations.
Open Access This article is licensed under a Creative Commons Attribution 4.0 International
License, which permits use, sharing, adaptation, distribution and reproduction in any medium or
format, as long as you give appropriate credit to the original author(s) and the source, provide a link to the
Creative Commons licence, and indicate if changes were made. The images or other third party material in this
article are included in the article’s Creative Commons licence, unless indicated otherwise in a credit line to the
material. If material is not included in the article’s Creative Commons licence and your intended use is not
permitted by statutory regulation or exceeds the permitted use, you will need to obtain permission directly from
the copyright holder. To view a copy of this licence, visit http://creativecommons.org/licenses/by/4.0/.
© The Author(s) 2022
Scientific Reports | (2022) 12:4010 | https://doi.org/10.1038/s41598-022-07934-6 11
Vol.:(0123456789)You can also read