FARMER-FOCUSED ROUTES TO MARKET - AN EVALUATION OF SOCIAL, ENVIRONMENTAL, AND ECONOMIC CONTRIBUTIONS OF GROWING COMMUNITIES - NEF Consulting
←
→
Page content transcription
If your browser does not render page correctly, please read the page content below
FARMER-FOCUSED
ROUTES TO MARKET
AN EVALUATION OF SOCIAL, ENVIRONMENTAL, AND
ECONOMIC CONTRIBUTIONS OF GROWING COMMUNITIES
FARMER-FOCUSED ROUTES TO MARKET: GROWING COMMUNITIES [

 CONTRIBUTIONS OF GROWING COMMUNITIES
FARMER-FOCUSED       ROUTES TO MARKET
An evaluation of the social, environmental, and economic
contributions of Growing Communities
December 2020

Authors:       Christian Jaccarini, Manuela Lupton-Paez, Jasmeet Phagoora
Funder:        Farming the Future

                             The consultancy of the New Economics Foundation, NEF
                             Consulting helps put new economics into practice with people
                             and the planet at the heart of decision-making.

.                            The New Economics Foundation is the UK’s leading think tank
                             promoting social, economic, and environmental justice to
                             transform the economy so that it works for people and the planet.

                           Growing Communities is a London-based social enterprise
                             The
                           that is consultancy
                                   reshaping theof food
                                                   the New
                                                        and Economics    Foundation,
                                                             farming systems          NEF
                                                                              that feed us
                           soConsulting
                              they work helps
                                          betterput
                                                 for new  economics
                                                     us, our         intoand
                                                             community    practice with people
                                                                             our planet.
                             and the planet at the heart of decision-making.

                           The Soil Association is a UK non-governmental organisation,
                             The New
                           formed      Economics
                                   in 1946          Foundation
                                            to pioneer           is the UK’s
                                                       a world where    we canleading
                                                                                 live inthink tank
                             promoting   social, economic, and   environmental
                           harmony with nature. The Soil Association is a leading justicevoice
                                                                                           to
                           intransform  the economy
                              the sustainable         so that it works
                                               food movement,           for people
                                                                 advocating          and the planet.
                                                                              for a visionary
                           future for UK farming.

The contents of this report can be shared freely. Please contact us if you would like to
publish the report, or extracts from it, on a website or in any other way. Unless explicitly
agreed otherwise, all publishing rights remain with NEF Consulting.

NEF Consulting Limited
New Economics Foundation
10 Salamanca Place, London SE1 7HB
www.nefconsulting.com
Tel: 020 7820 6300

                                                                                               2
FARMER-FOCUSED ROUTES TO MARKET: GROWING COMMUNITIES [

  CONTRIBUTIONS OF GROWING COMMUNITIES
CONTENTS
INTRODUCTION .................................................................................................................. 7
   Growing Communities ....................................................................................................... 7
   Evaluation scope ............................................................................................................... 8
Mapping and evidencing Outcomes .................................................................................... 10
   Farmers ........................................................................................................................... 10
   Food processors.............................................................................................................. 12
   Employees ...................................................................................................................... 13
   Food eaters – veg scheme customers and households ................................................... 14
   Food eaters – farmers market customers and households .............................................. 16
   The environment ............................................................................................................. 17
FINDINGS........................................................................................................................... 21
   Costs ............................................................................................................................... 21
   Assessing impact ............................................................................................................ 21
   Outcomes ........................................................................................................................ 21
   Cost-benefit ratio ............................................................................................................. 26
   Limitations ....................................................................................................................... 28
Conclusions ........................................................................................................................ 29
Appendix 1: Theory OF Change Session ............................................................................ 30
APPENDIX 2: Modelling assumptions ................................................................................. 35
   Population assumptions .................................................................................................. 35
   Indicators and net change assumptions........................................................................... 36
      Farmers ....................................................................................................................... 36
      Food processors .......................................................................................................... 37
      Employees ................................................................................................................... 38
      Environment................................................................................................................. 39
      Food eaters – farmers market ...................................................................................... 41
      Food eaters – veg scheme ........................................................................................... 42
   Financial proxies ............................................................................................................. 43
      Farmers ....................................................................................................................... 43
      Food processors .......................................................................................................... 44
      Employees ................................................................................................................... 44
      Environment................................................................................................................. 45
      Food eaters – farmers market customers and households ........................................... 46
      Food eaters – veg scheme customers and households................................................ 46

                                                                                                                                         3
FARMER-FOCUSED ROUTES TO MARKET: GROWING COMMUNITIES [

 CONTRIBUTIONS OF GROWING COMMUNITIES
EXECUTIVE SUMMARY
Growing Communities is an organisation, based in Hackney, London that aims to harness
the collective buying power of their local community and direct it towards those farmers who
are producing food in a sustainable way. Over 2019/2020, the New Economics Foundation
(NEF) conducted an evaluation of the impact of Growing Communities’ two primary
consumer offers: its weekly veg scheme and its farmers market. The impact of these
operations on consumers, farmers, food processors, employees, ‘food eaters’, and the
environment are all considered.

Growing Communities’ core operations cost £1,688,600 in the 2019/2020 financial year
(FY); 54% of this was borne by veg scheme customers and 40% by farmers market
customers. The average veg scheme customer spent £641 per annum, while the average
farmers market customer spent £837 per annum. These customers are the individuals that
directly purchase food via Growing Communities. As this food often feeds household
members as well as direct customers, we also refer to a larger group of people made up of
customers and their households that we call ‘food eaters’ or consumers.

These operations generated an estimated £6,294,000 in social, economic, and
environmental value in the 2019/2020 FY. The greatest proportion of this, circa 60%, went
to veg scheme customers and their households, who received £3,836,000. The next largest
share of the value generated was for farmers market customers and their households who
received £1,638,000. The environment was the next largest recipient, with Growing
Communities’ operations creating over £508,000 in value annually. Farmers, employees,
and food processors received £312,000.

The average customer (including veg scheme and farmers market) received £2,461 in
benefits for their households, while generating £228 of value for the environment, £76
for farmers, £52 for employees of Growing Communities, and £13 for food processors.

For veg scheme ‘food eaters’, the value of improvements in health reported (£631)
were more significant than the value of food received (£301). The social element of the
veg scheme is estimated to create £310 in social interactions and £60 in sense of
community for veg scheme members. Members also saved £310 worth of time by not
shopping in a supermarket as much.

For farmers market customers, the estimated value of health improvements generated
were lower but still significant at £398. This finding is consistent with the less veg-based
nature of the market, resulting in the less pronounced dietary changes reported which might
lead to less significant health benefits. Though the farmers market sees a larger number of
people gather than at veg scheme collection points, the social benefit of the farmers market
is slightly smaller, creating an estimated £245 in value in social interactions and £74 in
sense of community per customer. Additional value was created in terms of improved
knowledge of food and reduced food waste.

Growing Communities’ work supports significant environmental improvements, the
largest of which was in improved levels of carbon sequestered within the soil, which
is estimated to be worth £413,000 per annum. It is important to note that there is

                                                                                           4
FARMER-FOCUSED ROUTES TO MARKET: GROWING COMMUNITIES [
CONTRIBUTIONS
considerable OF GROWING
uncertainty around this COMMUNITIES
estimate, as the benefits stabilise after a period of time
after organic farming approaches have been adopted.
Categorising environmental benefits into either supply-chain benefits or consumer
behaviour and packaging benefits, we find that the vast majority of the value created
derives from the Growing Communities supply chain; £478,500 of environmental
benefit is created through more environmentally friendly farming practices. Shifting
patterns of consumer behaviour results in additional value worth £29,700.
It is interesting to note that the environmental benefits of organic farming in the supply
chain (£478,500) exceed the yield forgone (£106,000), suggesting that organic farming is
preferable to conventional methods, even before considering wider factors such as health
and wellbeing.
The greatest benefit created for farmers is the wellbeing benefit of feeling that their
work was more appreciated. This was closely followed by the impact of managing better
financially and feeling more secure in their job. The value of reduced pressure to scale up
their operations was also significant at £625 per farmer, as was the increased autonomy
over what they can produce.
The most significant value created by Growing Communities for its employees is to
enable them to manage better financially. This benefit is worth an estimated £1,077 per
employee. The residential-centric nature of the employment, which reduces commuting time,
was the next most valuable contribution to its employees, worth an average of £994 in time
and £45 in costs per annum. Reduced childcare costs were significant at an average of £868
per employee, while physical health benefits were also significant (£207).
Food processors were the stakeholder for whom the least value was created in aggregate
relative to other stakeholders. The support received from Growing Communities and
other stall holders at the market was estimated to be worth over £1,000 per year to
food processors. The improvement in financial wellbeing was markedly less than for
farmers at £436 per capita, compared to £1,820. The value of being part of a social group
(£640) was greater than that created for farmers (£69) or customers.
Our analysis estimates that Growing Communities generated £6,293,700 in economic,
commercial, social, and environmental value in 2019/2020, from £1,688,600 of costs
(including the opportunity costs) giving it an overall cost-benefit ratio of £3.73 of
value generated for each £1 of costs. This ratio is the primary measure to be used when
assessing the total economic efficiency of the Growing Communities operations.
Interestingly, the cost-benefit ratio remains high even when the focus is just on food eaters.
For each £1 spent by consumers they, and their households, receive an additional £2.46 in
benefit.
The findings presented in this report are subject to several limitations. Where considerable
uncertainty exists, we have made conservative assumptions to ensure that the findings
presented remain robust. The most significant of these is around the value of
environmental production benefits, many of which have not been included. The
environmental benefits associated with shortened supply chains and reduced transportation
5FARMER-FOCUSED ROUTES TO MARKET: GROWING COMMUNITIES [
CONTRIBUTIONS
measured in terms ofOF GROWING
changes COMMUNITIES
in greenhouse gas (GHG) emitted have been excluded
entirely. In light of this, the findings can be viewed as a conservative estimate of the
value created by this model of food production and distribution.
6FARMER-FOCUSED ROUTES TO MARKET: GROWING COMMUNITIES [
CONTRIBUTIONS OF GROWING COMMUNITIES
INTRODUCTION
Growing Communities
Growing Communities is a community-based organisation that has operated in Hackney,
North London, for the last 20 years. They aim to provide an alternative to the current
conventional food system by harnessing the collective buying power of their local community
and directing it towards those farmers who are producing food in a sustainable way.
Growing Communities has two primary customer offers; a subscription-based weekly veg
scheme and a weekly farmers market. The veg scheme brings customers fresh, organic,
seasonal fruit and veg each week. Customers are able to select the size of bag of veg or fruit
they would like and then collect it from one of the Growing Communities distribution points,
which include local businesses and community venues across Hackney. The weekly farmers
market is run every Saturday in Stoke Newington and offers a wide range of produce to
consumers including produce from many of the farmers who directly supply the veg scheme.
In addition, people can buy dairy and meat from sustainable family farms; fresh, sustainably
caught fish from the English Channel; hand-made baked goods; fermented foods;
kombucha; pickles; and hemp products.
Growing Communities works directly with farmers and producers, as well as wholesalers to
develop their supply chain. They also operate a farm in Dagenham and eight small market
gardens in Hackney, known as the Patchwork Farm. In 2019/2020, 100% of food sold at the
farmers market and 53% of food for the veg scheme was sourced directly from producers
(including Growing Communities’ own production), with the remaining share coming from
wholesalers.
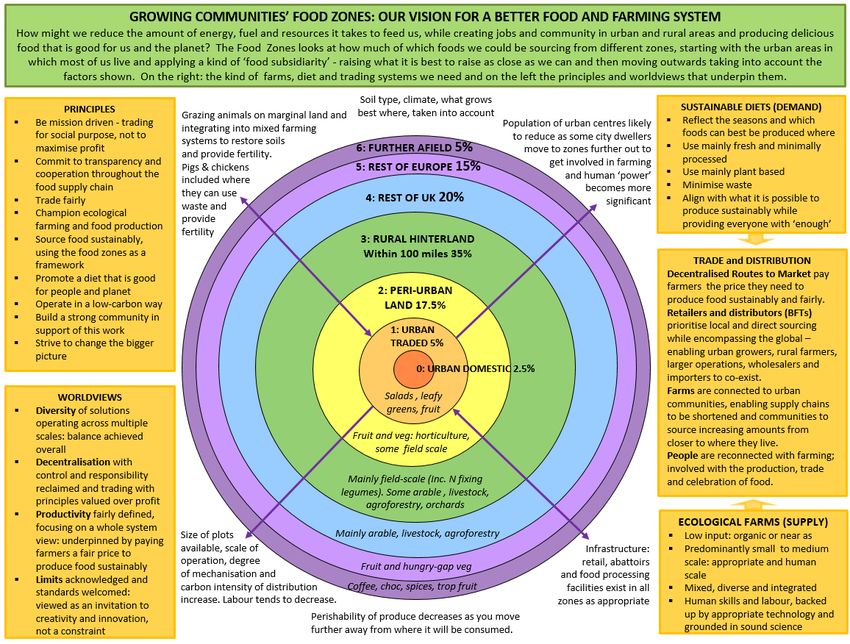
Growing Communities describes their operation as a principle-led approach to selecting the
suppliers they work with. Central to this is the concept of Food Zones, which identify foods
that can be sourced from different distances from the city and is illustrated in Figure 1.
This is implemented through a buying policy which requires Growing Communities to source
certified organic produce and apply a hierarchy of purchasing, obtaining produce from their
own growing sites first and then buying produce that can be grown in the UK directly from
local and regional farmers. The next preference is purchasing produce that can be grown in
the UK from wholesalers followed by buying from Europe produce that could be grown in the
UK as a staple or main crop but which is in short supply. At certain times of the year, they
buy produce from Europe that is not grown as a main crop in the UK or cannot be grown in
the UK at all. This is sourced from as close to the UK as possible. The only produce they
purchase from outside Europe is bananas, which are considered a staple and are extremely
difficult to source within Europe. Air-freighted or ‘hothouse’ produce is not purchased.
In addition, the buying policy seeks to support farmers to grow produce most appropriate for
their land. The typical agreement reached between Growing Communities and farmers in
their supply chain includes a commitment to paying the price that farmers set for the produce
(and not to haggle), to work in partnership, and to pay invoices within two weeks. Although
both parties agree on the main products to be supplied and the timing, Growing
Communities pledges to purchase all produce agreed on.
Growing Communities also administers grant-funded programmes of work on its Dagenham
Farm which include providing opportunities for volunteers from low-income households and
7FARMER-FOCUSED ROUTES TO MARKET: GROWING COMMUNITIES [
CONTRIBUTIONS
people OF GROWING
experiencing mental COMMUNITIES
health issues to help on the farm; actively recruiting trainees
who are single, local, unemployed parents; and hosting school and college visits.
Evaluation scope
NEF conducted an evaluation of the impact of Growing Communities weekly veg scheme
and farmers market over the period 2019/2020.
Certain Growing Communities activities have been excluded from the scope of the
evaluation, namely:
Grown in Dagenham (2016–2018) and Recipe for Life (May 2018–June 2019), two multi-
year grant-funded projects, were excluded from the analysis due to data quality.
The Better Food Traders network, a collection of 11 enterprises supported by Growing
Communities to operate similar models. These enterprises are excluded as they are not
directly operated by Growing Communities. It is our hope that these enterprises will use
the evaluation toolkit, informed by this evaluation and made freely available by NEF, to
evaluate their own operations.
Better Food Shed, a hub in Barking established by Growing Communities supporting
farmers to deliver their London orders. This is not evaluated as it is not part of the core
operating model identified as the scope of this research.
This evaluation was conducted in partnership with Growing Communities and the Soil
Association.
8FARMER-FOCUSED ROUTES TO MARKET: GROWING COMMUNITIES [
Figure 1. Proportion and type of produce typically purchased from each Food Zone; source: Growing Communities
9FARMER-FOCUSED ROUTES TO MARKET: GROWING COMMUNITIES [
MAPPING AND EVIDENCING OUTCOMES
In October 2019, the evaluation team came together with partners from Growing
Communities and the Soil Association to map the stakeholders and identify outcomes
relevant to the evaluation through the development of a Theory of Change (ToC).
Stakeholders are individuals (or entities) affected by or effect change. Outcomes are defined
as the change that occurs as a result of an activity (eg improved emotional wellbeing of
participants). The stakeholders included in the evaluation, and the nature of their
engagement with Growing Communities are illustrated in Table 1.
The ToC diagrams are detailed in Appendix 1.
Table 1. Material stakeholders included in the evaluation
Stakeholder group Description of engagement with Growing Communities
Farmers Organic, local farmers directly supply food to the veg scheme and
farmers market.
Food processors Food processors sell products at the weekly farmers market.
Employees Growing Communities’ direct employees.
‘Food eaters’ via Growing Communities supplies food to veg scheme customers and
the veg scheme their households that they collect from distribution points
‘Food eaters’ via People attend the weekly farmers market in Stoke Newington,
the farmers market purchasing food directly from farmers and food processors.
The environment The environment is affected by the farming practices undertaken in
the Growing Communities supply chain, by the transportation and
storage of produce, by waste generated in production and
consumption, and by changes in behaviour among food eaters.
For each of the stakeholders detailed in Table 1, a range of outcomes has been identified. In
the evaluation, it has been possible to include a sub-set of these outcomes in a social cost-
benefit analysis through a process of monetisation. Other outcomes have been quantified
but excluded from the social cost-benefit analysis or excluded from the evaluation due to
data quality. The outcomes included in the evaluation for each stakeholder are described in
the following section.
Farmers
Over the evaluation period, 24 organic farmers directly supplied food to the veg scheme and
farmers market generating £890,300 in sales in 2019/2020. Their outcomes are described in
Table 2.
10FARMER-FOCUSED ROUTES TO MARKET: GROWING COMMUNITIES [
Table 2. Farmers’ outcomes, by type
Outcome type Description
Monetised Cost savings from less food waste
Reduced pressure on farmers to scale up their operations
Increased autonomy over what they can produce
Wellbeing benefit of being part of a social group at the farmers
market
Wellbeing benefit of managing better financially
Wellbeing benefit of perceived improvements in jobs security
Feeling their work is more appreciated
Quantified Increased produce sold
Change in turnover
More people employed
This economic activity is captured in the food services delivered to
consumers, so is not monetised in this part of our modelling
Unquantified N/A
Growing Communities buys food directly from farmers on terms that are advantageous to
both parties. The typical agreement reached between Growing Communities and farmers
includes a commitment to purchase as much produce as possible. This, together with other
more sustainable practices, reduces food waste on the farm. Figure illustrates that a net
balance of 31% of farmers surveyed agreed they have produced less food waste since
working with Growing Communities.
Growing Communities also commits to paying the price that farmers set for the produce, to
work in partnership, to pay invoices within two weeks, and to apply agreed purchase plans.
This appears to be beneficial for farmers, with 42% reporting a meaningful improvement in
their financial wellbeing; 26% reporting improved job security; 85% reporting increased
turnover, with sales increasing by an average of 87%; and 85% reporting that their work is
more appreciated since working with Growing Communities. Farmers also reported
employing four more people, on average since working with Growing Communities. In the
evaluation, to avoid double counting, turnover, higher pay, and increased employment are
not included as benefits for farmers but included through the greater value of the product
provided to food eaters, as such, they are treated as quantified rather than monetised
outcomes (Figure 2).
11FARMER-FOCUSED ROUTES TO MARKET: GROWING COMMUNITIES [
Figure 2. Gross change in farmer outcomes
Produce sold * 87%
Increased turnover * 85%
Culture of appreciation 85%
Financial wellbeing ^ 42%
Less food waste 31%
Perceived job security ^ 26%
Reduced pressure to scale up 23%
Autonomy 8%
Part of a social group ^ 3%
* Quantified (non-monetised) outcomes, ^the change is a percentage point change (i.e. a difference between two
percentages) rather than a percentage change or proportion, n= 12 to 14
Food processors
Over the evaluation period, 13 food processors sold food or products at the farmers market,
generating £158,810 in sales in 2019/2020. Their outcomes are described in Table 3.
Table 3. Food processors’ outcomes, by type
Outcome type Description
Monetised Feeling supported by Growing Communities and other stalls
Wellbeing benefit of managing better financially
Wellbeing benefit of being part of a social group at the farmers
market
Quantified Access to low-cost, high-quality inputs
Change in consumer demand
Change in turnover
Change in reputation
Support received to incubate their business
Change in the number of people they employ
Economic activity (employment, turnover, demand) is captured in
the food services delivered to consumers, so is not monetised in
this part of our modelling.
Unquantified N/A
Growing Communities works with a range of food processors including bakers, chocolatiers,
and hot-food vendors. The market’s high environmental and social standards seem to have
benefited food processors, with 23% reporting reputational gains and 25% reporting
improved access to low-cost, high-quality inputs (Figure 3).
12FARMER-FOCUSED ROUTES TO MARKET: GROWING COMMUNITIES [
Almost all food processors report improved demand, with an average increase in turnover of
67%; 17% report improved financial wellbeing (which is less than the 42% of farmers) and
an average increase in employment of five people.
On average, food processors strongly agreed (71%) that “support from Growing
Communities was the reason… my business [became] self-sustaining”. Processors also
report a 46 percentage point increase in support from market traders compared to previous
arrangements. Similarly, the proportion of food processors reporting that they feel part of a
social group increased by 50 percentage points since they began working with Growing
Communities.
Figure 3. Gross change in food processor outcomes
Increased demand * 92%
Small business incubation * 71%
Increased turnover * 67%
Part of social group ^ 50%
Support from GC and others* 46%
Access to low-cost, high-quality inputs *^ 25%
Improved reputation * 23%
Financial wellbeing 17%
* Quantified (non-monetised) outcomes, ^the change is a percentage point change (i.e. a difference between two
percentages) rather than a percentage change or proportion, n= 6,
Employees
Growing Communities directly employed 36 people in the evaluation period, 14 of whom had
dependent children. Their outcomes are described in Table 4.
Table 4. Growing Communities employees’ outcomes, by type
Outcome type Description
Monetised Reduction in childcare costs
Reduction in travel costs
Reduction in travel time
Improved physical wellbeing
Wellbeing benefit of managing better financially
Quantified N/A
Unquantified N/A
Of the 36 people employed, 12% mainly work on growing sites, 40% mainly work in the
office or from home, and 44% work in mainly veg packing and delivery, with the remaining
4% of staff working at the farmers market. No staff works a 5-day working week (35 hours)
13FARMER-FOCUSED ROUTES TO MARKET: GROWING COMMUNITIES [
with Growing Communities. On average employees work 2.6 days, (24% work for 2 days),
with variation of 1 to 4.5 days per week; 36% of employees have other jobs, including roles
in art, education, care and social enterprises.
Growing Communities pays all its employees the real London Living Wage as a minimum
and caps pay at a maximum of twice this rate. They offer free staff lunches on the days
when most staff are in the office. Since working with Growing Communities, 12% of
employees reported an improvement in their financial wellbeing, while employees report a
marginal 1% increase in physical health. Growing Communities offers flexible working
arrangements. The 14 employees with children reported that they are able to care for their
children for an average of 7 extra hours per week. Employees also reported reduced
commuting time and cost, reflecting Growing Communities’ localised neighbourhood-
oriented approach to food distribution (Table 5).
Table 5. Gross change in employee outcomes
Outcome Indicator description Change in
indicator
Improved financial Change in proportion reporting that they are 12%
wellbeing managing well financially (% reporting valuable
outcomes)
Reduction in childcare Average annual change in number of additional 375 hours
costs caring hours, among those with kids
Reduction in travel Average change in annual travel costs £141
costs
Reduction in travel Average change in travel time per year, hours 230 hours
time
Improved physical Average self-assessed change in health 1%
health
n= 5 to 25
Food eaters – veg scheme customers and households
Growing Communities supplies food that feeds an estimated 3,027 people of which 1,421
are veg scheme customers. Customers on average spent £640 via the scheme in 2019/2020
(£910,350 in total). Their outcomes are described in Table 6.
Table 6. Veg scheme food eaters’ outcomes, by type
Outcome type Description
Monetised Food received
Change in average number of food portions wasted
Change in perceived general health
Increase in adventurous cooking
Increase in knowledge of food
Reduced time spent in the supermarket
Increase in social interactions
Change in sense of community
Quantified Change in cooking habits
Change in use of re-usable packaging
Unquantified Specific health benefits of eating organic food
Specific health benefits of dietary changes
Other wellbeing benefits
14FARMER-FOCUSED ROUTES TO MARKET: GROWING COMMUNITIES [
Benefits to the state of improved health
Consumers reported increased knowledge of local and seasonal food since they began
purchasing food from Growing Communities with 64% agreeing that their knowledge has
increased, and 61% reporting being more aware of the source of their food, as shown in
Figure 4.
There is evidence that consumers developed more sustainable consumption habits with 84%
of customers reporting that they eat more seasonal food, 41% of customers reporting eating
more fresh and unprocessed food, and 23% reporting more adventurous cooking since
joining the veg scheme. The average customer increased the number of meals they cooked
from raw ingredients by around 1 meal per week since joining. Meanwhile, food waste
declined, with the average food eater wasting 33 fewer portions annually than before joining;
13% of customers increasing the amount of re-usable packaging they take with them on their
weekly shop.
Customers also reported increases in their social wellbeing with 60% agreeing that they feel
involved and part of the Growing Communities network, while there was a 14 percentage
point increase in customers reporting that they felt a strong sense of community.
Growing Communities operates a series of collection points across Hackney where
consumers chat to other members or simply pick up their bag of food. As a result, veg
scheme consumers reported saving 50 hours each year in time that would have otherwise
been spent supermarket shopping.
Food eaters reported that their general health improved by 26% since joining, equivalent to
an annual increase of 10%. This may have been driven by shifts towards more vegetable-
based diets. On average, food eaters cut down the amount of meat they ate each year by 61
portions, fish by 31 portions, and dairy by 61 portions, while increasing the number of
portions of vegetables consumed annually by 115 portions.
It is outside the scope of this evaluation to assess:
Whether Growing Communities customers gain any benefit from specifically eating more
organic food, though this may be included in the improvement noted in their self-
assessed general health scores.
The extent to which improvements in health result in reduced healthcare costs for the
state.
Figure 4. Gross change in veg scheme food eater outcomes
15FARMER-FOCUSED ROUTES TO MARKET: GROWING COMMUNITIES [
Seasonal eating* 84%
Knowledge of food 64%
Awareness of food's provenance* 61%
Social interactions 60%
Eating fresh/unprocessed food* 41%
Adventurous cooking 22%
Sense of community ^ 14%
Use of re-usable packaging *^ 13%
Self-assessed general health ^ 10%
* Quantified (non-monetised) outcomes, ^the change is a percentage point change (i.e. a difference between two
percentages) rather than a percentage change or proportion, n= 122 to 117
Food eaters – farmers market customers and households
Growing Communities supplies food via the farmers market that feeds an estimated 1,961
people of which 934 attend the market. An estimated 14% of these people are also veg
scheme members. For modelling purposes, we assume veg scheme members are
subsumed in the farmers market customer stakeholder group, leaving 1,687 farmers market
food eaters of which 803 are customers. Growing Communities customers spent an average
of £820 via the market in 2019/2020, totalling £765,404 across all customers. Their
outcomes are shown in the table below.
Table 7. Farmers market food eaters’ outcomes, by type
Outcome type Description
Monetised Food received
Change in average number of food portions wasted
Change in perceived general health
Increase in adventurous cooking
Increase in knowledge of food
Reduced time spent in the supermarket
Increase in social interactions
Change in sense of community.
Quantified Change in cooking habits
Change in use of re-usable packaging
Unquantified Specific health benefits of eating organic food
Specific health benefits of changes in the number of portions of
meat, dairy, fish, vegetables, and fruit consumed
Other wellbeing benefits
Benefits to the state of improved health
16FARMER-FOCUSED ROUTES TO MARKET: GROWING COMMUNITIES [
Consumers reported increased knowledge of local and seasonal food since they began
purchasing food from Growing Communities with 48% agreeing that their knowledge has
increased and 35% reporting being more aware of the source of their food.
Though this change is less pronounced than for veg scheme customers, there is evidence of
an increase in sustainable consumption habits, with 56% of customers reporting that they
eat more seasonally since joining Growing Communities, 37% eating more fresh and
unprocessed food, and 21% cooking more adventurously. The average customer increased
the number of meals they cook from raw ingredients by around one meal every two weeks.
Food waste has reduced, with the average food eater wasting 42 fewer portions annually.
Customers did not report a meaningful change in the amount of re-usable packaging they
take with them on their weekly shop.
Customer reported an increase in social wellbeing since attending the farmers market with
55% agreeing that they feel involved and part of the Growing Communities network, while
there was a 15 percentage point increase in customers reporting that they felt a strong
sense of community.
Food eaters reported that their general health improved by a marginal 2%, markedly lower
than for veg scheme customers (Figure 5). Food eaters also reported a less significant
change in diet. On average, food eaters cut down the amount of meat they ate each year by
10 portions, while fish consumption increased by 0.5 portions and dairy by 12 portions. The
number of portions of vegetables consumed annually increased by 88 portions on average.
Figure 5. Gross change in farmers market food eater outcomes
Seasonal eating * 56%
Social interactions 55%
Knowledge of food 48%
Eating fresh/unprocessed food * 37%
Awareness of food's provenance * 35%
Sense of community ^ 15%
Self-assessed general health ^ 2%
Adventurous cooking 1%
* Quantified (non-monetised) outcomes, ^the change is a percentage point change (i.e. a difference between two
percentages) rather than a percentage change or proportion, n= 232 to 64
The environment
The environment is affected by the farming practices undertaken in Growing Communities
supply chain, by the transportation and storage of produce, by waste generated in
production and consumption, and by changes in behaviour among food eaters.
Environmental outcomes are shown in the table below.
17FARMER-FOCUSED ROUTES TO MARKET: GROWING COMMUNITIES [
Table 8. Environmental outcomes, by type
Outcome type Description
Monetised Mitigation of climate change:
Reduced GHG emissions due to the exclusion of use of
synthetic nitrogen fertiliser
Reduced GHG emissions due to reduced use of other non-
renewable resources – arable farms
Increase in organic matter (carbon) in soil over time
Change in GHG emissions due to changed livestock units on
farms
Change in GHG emissions due to changes in food eaters’ diets
Change in GHG emissions due to reduced online food orders
due to delivery
Other:
Improved biodiversity and landscape beauty due to organic
farming practices
Improved water quality due to the exclusion of use of synthetic
nitrogen fertiliser
Quantified N/A
Unquantified Change in GHG from reduction in use of other non-renewable
resources – livestock farms
Reduced eutrophication of water courses from reduction in use
of other non-renewable resources
Reduced GHG emissions from reduced transportation from
farms to distribution hub
Change in the impact on human health from the exclusion of
the use of pesticides and antibiotics
Change in the impact on human health from micro-organisms
and bovine spongiform encephalopathy (BSE), i.e. mad cow
disease
Change in reusable containers impacting reduced plastic and
GHG emissions and biodiversity
Improved air quality from reduced transportation
Growing Communities supports farmers to use organic, agro-ecological farming practices to
reduce their environmental impact. Organic farming excludes the use of synthetic nitrogen
fertiliser relying instead on biological nitrogen fixation by legumes.1 This provides public
benefits in particular in terms of reduced GHG emissions (related to both manufacture and
use of nitrogen fertiliser), reduced leaching and pollution of water courses, and reduced
impacts on biodiversity, particularly insects. For GHG emissions, each kilogram of nitrogen
use reduced saves approximately 10kg in GHG emissions (CO2-equivalents).2
In terms of impacts on water quality, substantial amounts of nitrogen applied to land in
conventional farming are not utilised, resulting in nitrogen losses through leaching and
evaporation. Nitrogen surpluses have been found to be 40%–50% lower on organic farms
than non-organic, meaning less nitrogen leaches into the water table.
Organic farming excludes the use of all herbicides and almost all pesticides and fungicides.
It relies instead on crop diversification/rotations and biological controls, supported by natural
predators from uncropped land, as well as mechanical weed control in limited
circumstances, particularly in horticulture. As a result, organic farming has significant
18FARMER-FOCUSED ROUTES TO MARKET: GROWING COMMUNITIES [
positive impacts on biodiversity ranging from soil micro-organisms and earthworms through
to non-crop plants (including many rare, red-list species), insects and pollinators, wild
mammals and birds.3
One study4 found that, on average:
The number of arable plant species was 95% higher.
The number of field margin plant species was 21% higher.
The number of farmland bird species was 35% and their abundance 24% higher.
The number of insect pollinator species was 23% and their abundance 26% higher.
The abundance of earthworm species was 78% and their biomass 94% higher.
This evaluation monetises the value of estimated biodiversity improvements, utilising
conservative estimates recommended by Department for Environment, Food and Rural
Affairs (Defra).
Organic farming practices emphasise the recycling of organic matter from plants and
livestock, as well as the inclusion of fertility-building phases, with or without livestock, in
organic crop rotations. These materials not only recycle nutrients, but they also supply
organic matter to the soil. Research5 demonstrates that organic farms contribute significantly
to higher soil organic matter levels, better soil structure, more biological diversity, more
earthworms, and less soil erosion as a result. It is noted that soil organic matter levels do not
increase indefinitely following a system change but stabilise at a new equilibrium level. It is
estimated that organic practices will result in a one percentage point increase in soil organic
carbon over 10 years on organic rotational land.6
Ruminant livestock are considered important in organic farming because of their potential to
be utilised in the fertility building phase of organic rotations. On cropping farms, livestock
may be used when fertility is being rebuilt on rotational land, while stocking rates on
grassland are typically 20%–25% lower on organic farms.i The increased GHG emissions
from higher effective stocking rates on cropping farms, as well as the reduced GHG
emissions from lower stocking rates are both accounted for in our analysis.
This evaluation excludes the monetisation of the impact of reducing other non-renewable
resources on livestock farms; reduced eutrophication of water courses from reduced use of
other non-renewable resources; and the impact on human health from the exclusion of
pesticides, antibiotics, and from changes in microorganisms.
The evaluation found that Growing Communities’ customers and their households reduce
the amount of meat, fish, and dairy and increase the number of vegetables they eat. These
food sources have different carbon footprints. Producing 1 kg of beef emits 60 kg of GHGs
(CO2-equivalents), while peas emits just 1 kg per kg produced. Overall, animal-based foods
tend to have a higher footprint than plant-based. For example, lamb and cheese both emit
more than 20 kg CO2-equivalents per kilogram on average.7 Our modelling accounts for the
impact of dietary changes on GHG emissions.
iStocking rates also reflect the reliance on bought-in feeds, and reduced stocking rates on organic
farms are a reflection of greater reliance on farm-sourced feed.
19FARMER-FOCUSED ROUTES TO MARKET: GROWING COMMUNITIES [
Food eaters also report changes in the amount of food they waste. All else being equal,
lower food waste reduces production and so reduces GHG emissions. These consumption
changes are accounted for within our modelling.
Growing Communities’ customers also report reducing the number of online food orders they
make, with online orders falling by approximately six orders annually for veg scheme
customers and three orders for farmers market customers. We account for the estimated
impact this has on GHG emissions.
Growing Communities’ veg scheme also seeks to reduce the amount of plastic packaging
used. As a result, veg scheme customers report a 24 percentage point reduction in the
amount of plastic packaging that their weekly food shop comes in. We account for the GHG
embodied within this but are unable to assess its potential impact on biodiversity or
landscape values.
Growing Communities’ buying policy utilises the concept of Food Zones, which looks at how
much of which foods can be sourced from different distances from the city. Growing
Communities only buys certified organic produce and does not purchase any air-freighted or
‘hothouse’ produce. A hierarchy of purchasing operates where referencing locally produced
options where available. This buying policy ought to reduce the distance travelled by food
within the supply chain, and the carbon intensity of that transport, potentially reducing the
amount of energy required in food transportation and storage. Assessing this impact is
outside the scope of this evaluation as existing applicable research is limited, so a
meaningful assessment would require a full carbon audit of Growing Communities’ supply
chain as well as that of a more conventional routes to market.
20FARMER-FOCUSED ROUTES TO MARKET: GROWING COMMUNITIES [
FINDINGS
Costs
Growing Communities’ core operations cost £1,688,600 in the 2019/2020 financial year
(Table 9); 54% of this was borne by veg scheme customers and 40% by farmers market
customers. An opportunity cost of £106,000 was incurred as a result of the production
choices of the farmers who directly supply it. By producing food organically, the amount of
food produced was an estimated 25% lower when compared to conventional methods.
Though this cost is not actually paid, it is implicitly borne so must be included in our analysis.
The reduced yield was estimated using an average reduction in yield informed by a related
research.8
Table 9. Annual cost of Growing Communities' operations, 2019/2020
Cost Proportion of total cost
Annual cost to VS customers £910,400 54%
Annual cost to FM customers £672,200 40%
Yield forgone attributable to GC £106,000 6%
£1,688,600
The average veg scheme customer spent £641 per annum, while the average farmers
market customer spent £837 per annum.
Assessing impact
In the previous chapter we described the gross change experienced by Growing
Communities’ stakeholders. To understand this impact, we need to understand the net
change Growing Communities is responsible for. This requires a consideration of the
following:
Deadweight. Also known as the counterfactual, deadweight represents the change in
the outcome that would have occurred anyway for the stakeholders, in the absence of
the involvement or existence of Growing Communities.
Attribution. Not all of the change experienced may have been attributable to Growing
Communities. To remove the proportion of change that was caused by other factors
occurring at the same time, we applied a percentage of attribution.
Displacement. The improvement in certain outcomes may have resulted in
displacement (ie resulting in an equivalent worsening of the same outcomes for other
people not involved in Growing Communities’ activities). The full details of the
deadweight, attribution, and displacement assumptions and financial proxies used in the
modelling are detailed in Appendix 2.
Outcomes
Growing Communities generated an estimated £6,294,000 in social, economic, and
environmental value in the 2019/2020 FY. The greatest proportion of this, circa 60%, went to
veg scheme customers and their households, who received £3,836,000. The next largest
share of the value generated was for farmers market customers and their households who
21FARMER-FOCUSED ROUTES TO MARKET: GROWING COMMUNITIES [
received £1,638,000. The environment was the next largest recipient, with Growing
Communities operations creating over £508,000 in value annually. Famers, employees, and
food processors received £312,000 (Table 10).
Table 10. The economic, social, and environmental impact of Growing Communities, by stakeholder 2019/2020
Value Proportion of total value
Food processors £28,000 0.4%
GC employees £115,000 1.8%
Farmers £169,000 2.7%
The environment £508,000 8.1%
Farmers market customers + households £1,638,000 26.0%
Veg scheme customers + households £3,836,000 60.9%
£6,294,000
The average customer (including veg scheme and farmers market) received £2,461 in
benefits for their households, whilst generating £228 of value for the environment, £76 for
farmers, £52 for Growing Communities employees, and £13 for food processors (Figure ).
Figure 6. Average value of benefits per customer
£3,000
£2,461
£2,500
£2,000
£1,500
£1,000
£500
£228
£13 £52 £76
£-
Food processors GC employees Farmers Environment Food eaters
A breakdown of the value created for veg scheme customers and their households (Table
11) illustrates that the estimated value of improved health per customer (£1,344) is greater
than the value of food (£641),
The social element of the veg scheme is estimated to create £310 in social interactions and
£60 in sense of community for veg scheme members. Customers also saved £310 worth of
time by not shopping in supermarkets.
22FARMER-FOCUSED ROUTES TO MARKET: GROWING COMMUNITIES [
Table 11. Annual value created for veg scheme customers, by outcome (2020 prices)
Outcome Total Value per Value per
value customer food-
eater
Change in average number of portions wasted – VS £38,539 £27 £13
Increase in adventurous cooking – VS £39,116 £28 n/a
Increase in knowledge of food – VS £44,179 £31 £15
Change in sense of community – VS £85,576 £60 n/a
Reduced time spent in the supermarket – VS £368,146 £259 n/a
Increase in social interactions –VS £440,923 £310 n/a
Food received – VS £910,353 £641 £301
Change in perceived general health – VS £1,909,128 £1,344 £631
For farmers market customers the estimated value of health improvements generated were
lower but still significant at £836 (Table 12). This finding is consistent with the less veg-
based nature of the market, resulting in the less pronounced dietary changes reported for
farmers market customers which might lead to less significant health benefits. This is
mirrored by the much smaller benefit seen from adventurous cooking for farmers market
customers.
Interestingly, though the farmers market sees a larger number of people gather than at veg
scheme collection points, the social benefit of the farmers market is slightly smaller, creating
an estimated £245 in value in social interactions and £74 in sense of community per
customer. Additional value was created in terms of improved knowledge of food (£20) and
reduced food waste (£27).
Table 12. Annual value created for farmers market customers, by outcome (2020 prices)
Outcome Total Value per Value per
value customer food-eater
Increase in adventurous cooking – FM £661 £1 £0
Increase in knowledge of food – FM £15,964 £20 £9
Change in average number of portions wasted – £21,624 £27 £13
FM
Change in sense of community – FM £59,506 £74 £35
Increase in social interactions – FM £197,088 £245 £117
Change in perceived general health – FM £671,162 £836 £398
Food received -FM £672,249 £837 £399
23FARMER-FOCUSED ROUTES TO MARKET: GROWING COMMUNITIES [
In terms of environmental benefits, the greatest value created was in improved levels of
carbon sequestered within the soil, which is estimated to be worth £413,000 per annum. It is
important to note that there is considerable uncertainty around this estimate, as the benefits
stabilise after a period of time after organic farming approaches have been adopted. We
assume this period to be to be 10 years in our modelling. We noted that Growing
Communities has enabled small-scale farmers to expand their organic operations, applying
these farming approaches to additional land. Additionally, we are aware that the approach
has to be adopted for a considerable period of time for the benefit to accrue. We feel
confident that Growing Communities provides the financial stability for this to take place, as
evidenced by farmers’ outcomes.
Categorising environmental benefits into either supply-chain benefits or consumer-behaviour
and packaging benefits, we find that the vast majority of the value created derives from the
Growing Communities supply chain: £478,500 of environmental benefit is created through
more environmentally friendly farming practice and shifting patterns of consumer
consumption behaviour results in additional value worth £29,700. It is interesting to note that
the environmental benefits of organic farming in the supply chain (£478,500) exceed the
yield forgone (£106,000), suggesting that organic farming is preferable to conventional
methods, even before considering wider factors such as health and wellbeing.
Table 13. Annual value created for the environment, by outcome (2020 prices)
Outcome Total value
Higher imputed levels of Livestock Units (LU) on arable and -£15,727
horticultural farms
Change in average number of dairy portions eaten a week (net) – FM -£1,290
Change in average number of fish portions eaten a week (net) – FM -£83
Improved biodiversity – arable land £217
Change in the number of online food orders £363
Less packaging waste on food – VS £603
Change in average number of portions wasted – FM £1,243
Improved biodiversity – improved grassland £1,390
Change in average number of meat portions eaten a week (net) – FM £1,497
Change in average number of portions wasted – VS £2,215
Reduced GHG (no nitrogen fertiliser, grassland) £3,139
Change in average number of fish portions eaten a week (net) – VS £4,213
Lower levels of Livestock Units (LU) on livestock farms £6,609
Change in average number of dairy portions eaten a week (net) – VS £7,922
Change in average number of meat portions eaten a week (net) – VS £13,027
Reduced GHG (lower use of other non-renewable resources) – £13,106
arable/horticulture
Reduced GHG (no nitrogen fertiliser, crops) £24,814
Improved water quality (no nitrogen fertiliser) £31,309
Increase in organic matter (carbon) over time £413,680
The greatest benefit created for farmers is the wellbeing benefit of feeling that their work was
more appreciated. This was closely followed by the impact of managing better financially and
feeling more secure in their job. The value of reduced pressure to scale up their operations
24FARMER-FOCUSED ROUTES TO MARKET: GROWING COMMUNITIES [
was also significant at £625 per farmer, as was the increased autonomy over what they can
produce. The social benefit of the farmers market itself was the least significant, only
contributing an estimate £29 in value per farmer annually.
Table 14. Annual value created for farmers, by outcome (2020 prices)
Outcome Total Value per
value farmer
The wellbeing benefit of being part of a social group at the £699 £29
farmers market
Increased autonomy over what they can produce £3,036 £126
Reduced pressure on farmers to scale up their operations £15,000 £625
Cost savings from less food waste £22,615 £942
The wellbeing benefit of perceived improvements in job £34,917 £1,455
security
The wellbeing benefit of managing better financially £43,683 £1,820
Feeling their work is more appreciated £48,679 £2,028
The most significant value created by Growing Communities for its employees is to enable
them to manage better financially (Table 15). This benefit is worth an estimate £1,077 per
employee. The residential-centric nature of employment, which reduces commuting time,
was the next most valuable contribution to its employees, worth an average of £994 in time
and £45 in costs per annum. Reduced childcare costs were also significant at an average of
£868 per employee, while physical health benefits were also significant (£207).
Table 15. Annual value created for employees, by outcome (2020 prices)
Outcome Total value Value per employee
Reduction in travel costs £1,620 £45
Improved physical wellbeing £7,446 £207
Reduction in childcare costs £31,255 £868
Reduction in travel time £35,777 £994
The wellbeing benefit of managing better financially £38,786 £1,077
Food processors were the stakeholder for who the least value was created in aggregate
relative to other stakeholders (Table 16). The support received from Growing Communities
and other stall holders at the market was estimated to worth over £1,000 per year to food
processors. The improvement in financial wellbeing was markedly less than for farmers at
£436 per capita, compared to £1,820. The value of being part of a social group (£640) was
greater than that created for farmers (£69) or customers.
Table 16. Annual value created for food processors, by outcome (2020 prices)
Outcome Total Value per food
value processor
The wellbeing benefit of managing better financially £5,674 £436
The wellbeing benefit of being part of a social group at £8,322 £640
the farmers market
Support from Growing Communities and other stall £13,778 £1,060
holders
25You can also read