FACTBOOK, 2021-2022 Dr. Christopher Gilmer, President - West Virginia University at Parkersburg
←
→
Page content transcription
If your browser does not render page correctly, please read the page content below
FACTBOOK, 2021-2022 Dr. Christopher Gilmer, President

Contents
Definition of Terms.......................................................................................................... 4
Chapter 1: About West Virginia University Parkersburg .................................................. 7
    History of the Institution .............................................................................................. 7
       Main Campus ........................................................................................................... 7
       Jackson County Center ............................................................................................ 8
       Additional Locations ................................................................................................ 8
    Mission ........................................................................................................................ 9
    Vision ........................................................................................................................... 9
    Values Statement ......................................................................................................... 9
    Philosophy ................................................................................................................... 9
    Goals ......................................................................................................................... 10
    Our Accreditors ......................................................................................................... 10
       Academic Program Accreditation .......................................................................... 10
    Programs of Study ..................................................................................................... 12
       Certificates ............................................................................................................. 12
       Associate Degrees ................................................................................................. 12
       Baccalaureate Degrees .......................................................................................... 13
       Skill Sets ................................................................................................................. 13
Chapter 2: Enrollment ...................................................................................................14
    Fall Census Headcount ..............................................................................................14
    Fall Full Time Equivalent (FTE)...................................................................................14
    Fall Full-Time and Part-Time Students .......................................................................15
    Fall First-Time Freshmen Headcount .........................................................................15
    Fall Dual Credit-Early College Enrollment .................................................................16
    Parent Educational Level ...........................................................................................16
    Workforce and Economic Development (WED) Training ...........................................17
       Skill Enhancement ..................................................................................................17
       Skill Set...................................................................................................................18
       Advanced Skill Set ................................................................................................19
Chapter 3: Demographics ............................................................................................. 20

1
Fall Enrollment by Gender ......................................................................................... 20
    Fall Enrollment by Racial or Ethnic Minority Status.................................................... 21
    Fall Enrollment by Traditional/Non-Traditional Age .................................................. 21
    Fall Enrollment by Parent Educational Level ............................................................. 22
    Enrollment by WV County ......................................................................................... 22
       Fall 2015 Headcount Enrollment............................................................................ 22
       Fall 2016 Headcount Enrollment............................................................................ 23
       Fall 2017 Headcount Enrollment............................................................................24
       Fall 2018 Headcount Enrollment............................................................................ 25
       Fall 2019 Headcount Enrollment............................................................................ 26
       Fall 2020 Headcount Enrollment............................................................................ 27
Chapter 4: Faculty and Staff .......................................................................................... 27
    Summary of Faculty (Full-Time and Part-Time) ........................................................... 27
    Percent of Faculty by Gender .................................................................................... 28
    Percent of Faculty by Minority/Non-Minority Status .................................................. 28
    Summary of Non-Instructional Staff (Full-Time and Part-Time) .................................. 29
    Percent of Classified Staff by Gender ........................................................................ 29
    Percent of Classified Staff by Minority/Non-Minority Status ...................................... 30
    Percent of Non-Classified Staff by Gender ................................................................ 30
    Percent of Non-Classified Staff by Minority/Non-Minority ........................................ 31
    Student-Faculty Ratio ................................................................................................ 31
Chapter 5: Finances ...................................................................................................... 31
    Operating Budget ..................................................................................................... 31
Chapter 6: Financial Aid ................................................................................................ 32
    Promise Scholarship................................................................................................... 32
    WV Higher Education Grant Program........................................................................ 32
    WV HEAPS Grant ....................................................................................................... 32
    Federal Direct Loans (Subsidized).............................................................................. 32
    Federal Direct Loans (Unsubsidized).......................................................................... 32
    Federal Direct Parent Loans (PLUS) ........................................................................... 33

2
Federal Work Study ................................................................................................... 33
    Federal Pell Grant ...................................................................................................... 33
    Federal Supplemental Educational Opportunity Grant (SEOG) ................................ 33
Chapter 7: Retention, Persistence, Graduation ............................................................. 34
    Freshmen Cohort Retention Fall-to-Fall-Starting Institution ...................................... 34
    Retention Fall-to-Fall ................................................................................................. 34
    Retention Fall-to-Spring Starting Institution .............................................................. 35
    Number of Degrees and Certificates Awarded ......................................................... 35
    Number of Students Transferring to A Four-Year Institution after Attending a Two-
    Year Institution ........................................................................................................... 36

3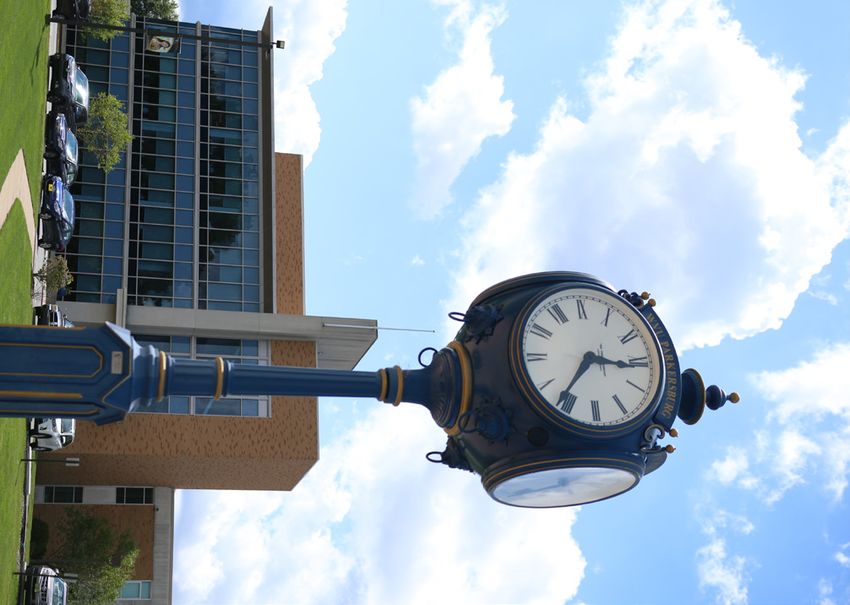
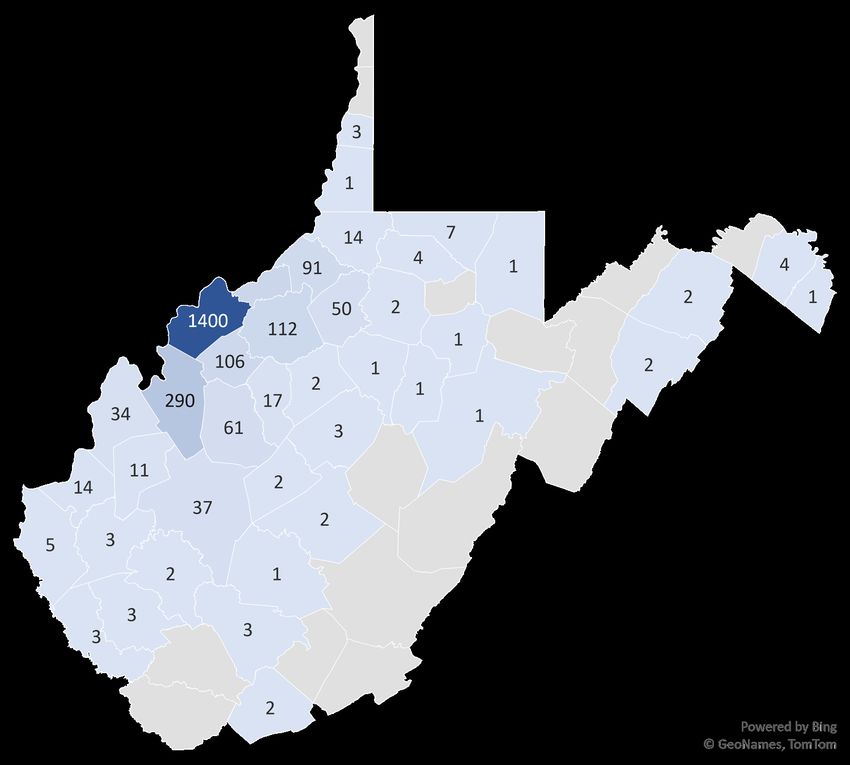
Definition of Terms
Aid Awarded to Students
Source: WV Higher Education Policy Commission
This measure represents the percentage of students receiving federal, state, or
institutional grants or waivers divided by the annual unduplicated headcount for the
year. It does not include veterans’ benefits, vocational rehabilitation benefits, other
educational benefits, or loans but does include work study.

Enrollment by WV County
Source: WV Higher Education Policy Commission
The graphs represent enrollment at the institution by WV county. For each county, the
darker the shading, the higher the enrollment.

Fall End-of-Term First-Time Freshmen Headcount
Source: WV Higher Education Policy Commission
This figure measures the enrollment of all new first-time freshmen.

Fall End-of-Term High School Dual Enrollment
Source: WV Higher Education Policy Commission
This measure reflects the number of the institution’s total headcount enrollment
comprised of high school students enrolled in college classes while still in high school.

Fall Headcount
Source: WV Higher Education Policy Commission
This measure reflects the number of the institution’s total headcount (all students)
enrolled at the institution.

Fall Headcount by Age Type
Source: WV Higher Education Policy Commission
This measure reflects the age type – a traditional student – 24 and under 24 years old
non-traditional student – start college 25 or older other – under 17 or if no birth year is
provided.

Fall Headcounts by Gender
Source: WV Higher Education Policy Commission
The measure reflects the number of students by gender.

Fall Headcount by Racial or Ethnic Minority Status
Source: WV Higher Education Policy Commission
The measure reflects the number of students by racial or ethnic minority status.

4

Fall Headcount Full and Part-Time Students
Source: WV Higher Education Policy Commission
This measures the number of students that are full-time (enrolled in 12 or more credit
hours) and the number of students that are part-time (enrolled for less than 12 credit
hours).

Fall-to-Fall Retention Starting Term

Source: WV Higher Education Policy Commission
This indicator reflects the percentage of first-time freshmen in a fall entry cohort who
enrolled the following fall at the same institution.

Fall-to-Spring Retention Starting Term
Source: WV Higher Education Policy Commission
This indicator reflects the percentage of first-time freshmen in a fall entry cohort who
enrolled in the spring semester of the same academic year at the same institution.

Number of Degrees and Certificates Awarded
Source: WV Higher Education Policy Commission
This measurement represents the total number of academic credentials at the
certificate and associate level awarded by an institution within an academic year.

Number of Students Transferring to a Four-Year Institution after Attending a Two-Year
Institution
Source: WV Higher Education Policy Commission
This calculation includes the number of students from the institution that transferred to
a four-year institution.

State Appropriations
Source: WVU Parkersburg Administration
This figure represents money designated to WVU Parkersburg from the State of West
Virginia.

Student-to-Faculty Ratio
Source: Integrated Postsecondary Education Data System (IPEDS)
This metric is calculated by dividing total full-time equivalent (FTE) enrollment by total
FTE for instructional staff.

5
Total Operating Budget
Source: WV Higher Education Policy Commission
This figure includes all budgeted expenses for WVU Parkersburg. (does not include
grants) per fiscal year.

Total Revenue
Source: WVU Parkersburg Administration
The figure represents the total amount of money coming into WVU Parkersburg
through tuition, etc., per fiscal year.

Total Expenses
Source: WVU Parkersburg Administration
This figure includes the total amount of expenses that WVU Parkersburg is occurring
per fiscal year.

6
Chapter 1: About West Virginia University Parkersburg
History of the Institution
WVU Parkersburg was founded in 1961 as the Parkersburg Branch of West Virginia
University (WVU). In 1971, it became Parkersburg Community College (PCC), one of the
state’s first comprehensive community colleges, and was governed by the West
Virginia Board of Regents. Three years later, the college established its Jackson County
Center (JCC) in Ripley.

In a reorganization of the state’s higher education governance structure, the West
Virginia Legislature enacted S.B. 420, which in addition to other initiatives renamed
PCC as West Virginia University at Parkersburg. With this change, WVU Parkersburg
was designated as a regional campus of WVU and transferred its governance to the
newly formed University System of West Virginia.

In 2008, the state legislature changed the governance structure of WVU Parkersburg.
With this change in governance structure, the college became part of the statewide
network of independently accredited community colleges known as the West Virginia
Community and Technical College System (CTSC). It began being controlled by a local
board of governors. The Board of Governors approved a memorandum of
understanding with WVU on May 18, 2009, which outlined a formal relationship
between the two schools and designated WVU Parkersburg as an “affiliated institution”
of WVU. The college’s primary service area consists of seven counties in West Virginia:
Jackson, Pleasants, Ritchie, Roane, Tyler, Wirt and Wood.

Main Campus
The college first opened in an abandoned elementary school on Emerson Avenue in
Parkersburg. The bell from the elementary school, which was cast in 1902 by
the Meneely Bell Company, is still used in campus ceremonies and is part of the
college's official seal. In 1965, Wood County voters approved a bond levy for to
construct a new educational complex. The college moved to its current location once
construction was completed in 1969. The campus now resides at 300 Campus Drive,
Parkersburg, WV.

The campus is home to the main administrative building, the Workforce and Economic
Development building and the Caperton Center for Applied Technology, which
opened in 1999. Recently completed facilities include the Applied Technology Center,
the Coplin Health Clinic and Eldon Miller Plaza.

The Caperton Center for Applied Technology involves an innovative approach to
delivering programs that respond to evolving employment needs. The facility is shared

7
by WVU Parkersburg and Wood County Schools. High school students may earn high
school and college credit in a number of dual credit courses, thus taking advantage of
a seamless transition from high school to college.

Jackson County Center
WVU Parkersburg’s JCC was established in 1974 as an outreach program in Jackson
and Roane counties. Many services available on the Parkersburg campus are also
available at JCC. Courses offered enable students to gain and complete various one-
year degree certificates, transfer degrees such as the Associate of Arts and Associate of
Science, or the Associate of Applied Science Board of Governors degree. Students can
also complete the general education requirements for various degree levels, including
baccalaureate degrees. Courses offered at JCC in conjunction with online and hybrid
delivery provide the means to complete additional degrees through the Jackson
County Center. The Center is at 107 Academy Drive, Ripley, WV.

Additional Locations
In August 2020, the WVUP on Market opened in downtown Parkersburg. It houses the
WVU Parkersburg Center for Civic Engagement and Innovation and shares space with
the West Virginia Center for Civic Life. The Center for Civic Engagement and
Innovation, an extension of the college’s Office of the President, works to provide
opportunities for WVU Parkersburg students and faculty and members of the
community to engage with each other in meaningful ways. The Center for Civic
Engagement writes grants, hosts training sessions and develops business relationships
for WVU Parkersburg that benefit the community, students, and faculty.

In addition, WVUP on Market also shares space with the region’s Substance Use
Disorder Collaborative and hosts the Arts Collaborative of the Mid-Ohio Valley. The
Arts Collaborative of the Mid-Ohio Valley, a collaborative of 12 arts and humanities
organizations, works together to build and sustain their organizations using shared
marketing and annual special projects. Members of the Arts of the MOV, such as the
WV Symphony Orchestra-Parkersburg and the Oil, Gas and Industrial Historical
Association, use this as their meeting space. In January 2022, the WV Small Business
Development Center also moved to WVUP on Market from the Workforce and
Economic Development building. WVUP on Market is truly a place where the college
and community meet.

The college also has the Riverhawk Farm, developed to expand sustainable agriculture
practices in the Mid-Ohio Valley. Through the Workforce and Economic Development
Division, the college offers a short-term certificate program in sustainable agriculture to
provide hands-on training to students in the areas of ranching, soil sampling and

8
preparation, planting methods, marketing and budgeting and more. The Riverhawk
Farm is even partnered with the Mister Bee Potato Chip company to grow 10 acres of
specialty chipping potatoes for the woman-owned business. WVU Parkersburg also
plans to work with the WV Department of Agriculture to give student veterans the
chance to receive agricultural training with the WV Vets to Agriculture program.

Mission
West Virginia University at Parkersburg provides accessible, life-changing educational
opportunities in a safe and supportive environment. WVU Parkersburg is the region’s
premier college recognized for quality education, commitment to student
empowerment, workforce collaboration and community involvement.

Vision
WVU Parkersburg is the region’s premier college recognized for quality education,
commitment to student empowerment, workforce collaboration and community
involvement.

Values Statement
   • INTEGRITY – Exemplify personal integrity, intellectual integrity and ethics in all
       we do.
   • RESPECT – Demonstrate civility and tolerance toward others.
   • INCLUSIVENESS – Embrace diversity, individual and group, in the broadest
       sense.
   • PARTNERSHIPS – Develop responsive and productive alliances with our campus
       and communities.
   • CREATIVITY AND INNOVATION – Encompass creativity and innovation in all
       aspects of the college.

Philosophy
WVU Parkersburg faculty and staff individually and collectively hold the responsibility of
providing educational and cultural opportunities in the college’s service community
based on the following principles.
    1. Education holds a central position in the creation, development and nurturing of
       a society.
    2. Education should be constantly cognizant of the fact that all persons are
       individuals of worth and are entitled to be treated with dignity and respect.
    3. Education functions under the realization that equal opportunity to access and
       to benefit from teaching and learning must be afforded to all persons.
    4. Education provides the opportunity for all citizens in a democratic society to
       explore, to discover and to develop their special aptitudes and interests.

9
5. Education holds as a sacred trust; its responsibility to assist persons in their
quest for a fulfilling life and for responsible citizenship in a world characterized
by change.
Goals
In support of its Philosophy and to accomplish its Mission, WVU Parkersburg will:
• Maintain and establish first-rate, relevant academic programs.
• Provide focused and effective student support.
• Be the region’s premier path to personal success through the recruitment,
retention, graduation, and job placement of our students.
• Lead our region with excellent, sustainable facilities and a financial condition
that supports long-term institutional success.
• Foster excellent community relationships and maintain a superb reputation.
• Provide the optimal institutional climate for all campus members to achieve
community success and professional satisfaction.
Our Accreditors
WVU Parkersburg is accredited by the Higher Learning Commission
(hlcommission.org), a regional accreditation agency recognized by the U.S.
Department of Education, to offer certificate, associate and bachelor's degrees. The
Higher Learning Commission (HLC) is an independent corporation founded in 1895 as
one of six regional institutional accreditors in the United States. HLC accredits degree-
granting post-secondary educational institutions in the North Central region of the
United States. Its purpose is to advance the common good through quality assurance
of higher education as the leader in equitable, transformative and trusted accreditation
in the service of students and member institutions. It serves as a champion of quality
higher education by working proactively in support of students, institutions and their
communities.
Academic Program Accreditation
The following academic programs have additional specialized accreditation, as
indicated.
Business
ACBSP - WVU Parkersburg’s business programs are accredited by the Accreditation
Council for Business Schools and Programs (ACBSP). The council is a specialized
accrediting organization that reviews the quality and integrity of business degree
programs. ACBSP accredits all business programs at all degree levels.
Education
10CAEP - The Education Division at WVU Parkersburg was awarded national accreditation by the Council for the Accreditation of Educator Preparation (CAEP) in 2020. It is an Education Preparation Program that has accreditation to ensure teacher candidates meet rigorous standards prior to graduation. CAEP advances equity and excellence in educator preparation through evidence-based accreditation that assures quality and supports continuous improvement to strengthen P-12 student learning. CE International - The elementary education program is also nationally recognized by the Association of Childhood Education International (CE International). Childhood Education International’s mission is to develop and amplify innovative solutions to education challenges that affirm children’s learning and development as the pathway to sustainable futures for all. Nursing ACEN - The Nursing programs at WVU Parkersburg are accredited by the Accreditation Commission for Education in Nursing (ACEN). The purpose of ACEN is to provide specialized accreditation for all levels of nursing education and transition-to-practice programs. The Accreditation Commission for Education in Nursing (ACEN) supports the interests of nursing education, nursing practice and the public by the functions of accreditation. Accreditation is a voluntary, peer-review, self-regulatory process by which non-governmental associations recognize educational institutions or programs that have been found to meet or exceed standards and criteria for educational quality. Accreditation also assists in the further improvement of the institutions or programs as related to resources invested, processes followed, and results achieved. The monitoring of certificate, diploma, and degree offerings is tied closely to state examination and licensing rules and the oversight of preparation for work in the profession. Surgical Technology CAAHEP – The Surgical Technology program at WVU Parkersburg is accredited by the Commission on Accreditation of Allied Health Education Programs (CAAHEP). The Commission on Accreditation of Allied Health Education Programs is the largest programmatic accreditor of the health sciences professions. In collaboration with its Committees on Accreditation, CAAHEP reviews and accredits over 2100 individual education programs in 32 health science occupations. CAAHEP accredited programs are assessed on an ongoing basis to assure that they meet the Standards and Guidelines of each profession. 11
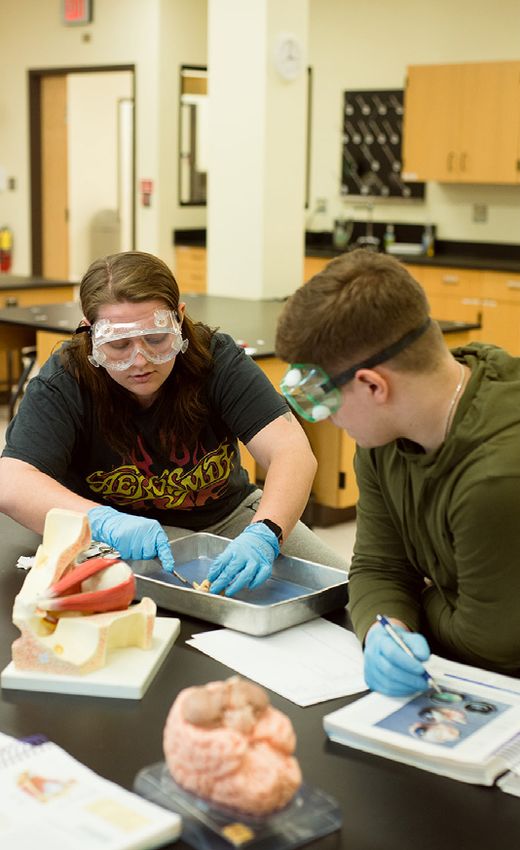
Programs of Study
Certificates:
   • Business Administration, C.A.S.
   • Chemical & Polymer Operator Technology, C.A.S.
   • Child Development, C.A.S.
   • Criminal Justice, C.A.S.
   • Digital Media Production, C.A.S
   • Electricity and Instrumentation, C.A.S.
   • General Education
   • Industrial Maintenance, C.A.S.
   • Patient Care Technician, C.A.S.
   • Pharmacy Technician, C.A.S.
   • Residential and Commercial Electricity, C.A.S.
   • Welding, C.A.S

Associate Degrees:
   • Advanced Manufacturing Technology, A.A.S.
   • Associate of Arts, A.A.
   • Associate of Science, A.S.
   • Board of Governors, A.A.S
   • Business Administration, A.S., A.A.S.
   • Child Development, A.A.S.
   • Computer Information Technology, A.A.S.
   • Computer Science, A.A.S.
   • Criminal Justice, A.A.S.
   • Digital Communication, A.A.S.
   • Digital Media Production, A.A.S.
   • Drafting, A.A.S.
   • Electrical Reliability and Maintenance, A.A.S.
   • Multi-Craft Technology, A.A.S.
   • Nursing, A.A.S
   • Occupational Development (Apprenticeship), A.A.S.
   • Reliability and Maintenance Technology, A.A.S.
   • Strategic Communication, A.A.S.
   • Surgical Technology, A.A.S.
   • Surgical Technology (C.S.T. to A.A.S.)
   • Technical Studies (Cooperative Education), A.A.S.
   • Welding, A.A.S.

12
Baccalaureate Degrees:
   • Business Administration (Accounting concentration), B.S.
   • Business Administration (Accounting & Financial Management concentration),
      B.A.S.
   • Business Administration (General Business concentration), B.S.
   • Business Administration (Management & Marketing), B.A.S.
   • Child Development, B.A.S.
   • Child Development, B.A.S.
   • Communication & Media Studies (Digital Communication concentration), B.A.S.
   • Communication & Media Studies (Strategic Communication concentration),
      B.A.S.
   • Criminal Justice, B.A.S.
   • Cybersecurity & Network Administration, B.A.T.
   • Elementary Education, B.A.
   • Multi-Disciplinary Studies B.A.
   • Nursing (RN to BSN), B.S.
   • Regents Bachelor of Arts, R.B.A.
   • Software Engineering, B.A.T.
   • Supervisory Management, B.A.S.

Skill Sets
    • Assistant Teacher
    • Broadcast
    • Creative Writing
    • Entrepreneurial Studies
    • Event Planning
    • Graphic Design
    • History
    • Leadership
    • Literature
    • Media Writing
    • Microsoft Office
    • Organizational Communication
    • Photography
    • Psychology
    • Purchasing Competency
    • Social Media
    • Sociology

13
Chapter 2: Enrollment
Fall Census Headcount
Headcount refers to the number of individual and unduplicated students enrolled
during the timeframe indicated. These numbers reflect individual full-time as well as
part-time students.
2900 2833
2825
2800
2700
2626
2568
2600
2480
2500
2405
2400
2300
2200
2100
F 2015 F 2016 F 2017 F 2018 F 2019 F 2020
Fall Full Time Equivalent (FTE)
FTE means Full-time Equivalency. It is used to reflect the total number of students who
would be attending if they each were enrolled full-time. Full-time enrollment consists of
12 or more credit hours per semester. Those students who enroll in less than 12 credit
hours are considered part-time students.
2500
2082
2000 1881 1843 1809 1769
1706
1500
1000
500
0
F 2015 F 2016 F 2017 F 2018 F 2019 F 2020
14Fall Full-Time and Part-Time Students
The number of individuals enrolled as full-time or part-time students for the reflected
year.
1800 1446 1510 1503 1405 1249 1213
1584
1600
1379 1413
1400
1200 1058
977 1000
1000
800
600
400
200
0
F 2015 F 2016 F 2017 F 2018 F 2019 F 2020
# Full Time Students # Part-Time Students
Fall First-Time Freshmen Headcount
First-time freshmen are students who have never attended college after graduating
high school. This chart reflects the number of these students each year.
700
611 609
600
484 474 474
500 457
400
300
200
100
0
F 2015 F 2016 F 2017 F 2018 F 2019 F 2020
First Time Freshmen
15Fall Dual Credit-Early College Enrollment
The Early College program allows eligible high school students to take college-level
courses on either their school’s campus or the WVU Parkersburg campus for a reduced
tuition rate. This chart reflects the number of individual students enrolled in this
program.
2500
1955
2000
1647
1500
933
1000 760
591 612
500
0
F 2015 F 2016 F 2017 F 2018 F 2019 F 2020
Dual Enrollment-Early College
Parent Educational Level
Students attending West Virginia University at Parkersburg come from a variety of
educational backgrounds. Some students grew up in families where at least one parent
or guardian had a college degree. Others grew up in households where the parent or
guardians had no experience in college.
100%
90%
80%
1172
70% 1520 1398 1414 1599
1925 1721
60%
50%
348
40%
355 355 238
30% 367 361 334
383 192
20% 185 194 165
192 187 793
10% 407 383 617
394 389 401
0%
2015 2016 2017 2018 2019 2020 2021
# College Degree # Some College # No College # Unknown
16Overall Percentage of Parent Education Level
2015-2021
18.8%
7.52%
59.8% 13.91%
% College Degree % Some College % No College % Unknown
Workforce and Economic Development (WED) Training
The Workforce and Economic Development Division offers local businesses, industries
and organizations a variety of training opportunities designed to increase employee
productivity and efficiency, helping them to maximize profits.
Skill Enhancement
1,353
2019-2020
1,347
2,449
2018-2019
2,449
2,813
2017-2018
2,805
4,073
2016-2017
4,073
0 500 1,000 1,500 2,000 2,500 3,000 3,500 4,000 4,500
Registrations Number of Completers
1735,000
31,262
30,000
25,000
20,000
15,000
11,477
10,000 9,872
6,266
5,000
0
2016-2017 2017-2018 2018-2019 2019-2020
Total Contact Hours
Skill Set
2019-2020 1,781
1,396
2018-2019 81
79
2017-2018 551
536
2016-2017 572
571
0 500 1,000 1,500 2,000
Registrations Number of Completers
18100,000
90,000
87,150
80,000
70,000
60,000
50,000
40,000
30,000 30,732 31,262
20,000
10,000
5,092
0
2016-2017 2017-2018 2018-2019 2019-2020
Total Contact Hours
Advanced Skill Set
12
2018-2019
9
3
2017-2018
3
13
2016-2017
13
0 2 4 6 8 10 12 14
Registrations Number of Completers
197,000
6,390
6,000
5,000
4,000
3,600
3,000
2,000
1,000 980
0
2016-2017 2017-2018 2018-2019
Total Contact Hours
Chapter 3: Demographics
Fall Enrollment by Gender
1805
1741 1690
1541 1492 1494
1084 1028
1024 988
911 936
F 2015 F 2016 F 2017 F 2018 F 2019 F 2020
# Male # Female
20Fall Enrollment by Racial or Ethnic Minority Status
100%
90%
80%
70%
60%
2612 2411 2249 2181 2541 2375
50%
40%
30%
20%
10%
213 157 231 224 292 251
0%
F 2015 F 2016 F 2017 F 2018 F 2019 F 2020
# Minority # Non-Minority
Fall Enrollment by Traditional/Non-Traditional Age
Traditional student refers to students who are 18 to 23 years of age. Non-traditional
refers to students who are 24 or more years of age.
2500
1925
2000
1702 1729
1517 1458
1500 1416
1060
968 972
1000 850
727 701
500
0
F 2015 F 2016 F 2017 F 2018 F 2019 F 2020
# Traditional Students # Non-Traditional Students
21Fall Enrollment by Parent Educational Level
100%
90%
80%
1172
70% 1520 1398 1414 1599
1925 1721
60%
50%
348
40%
355 355 238
30% 367 361 334
383 192
20% 185 194 165
192 187 793
10% 407 383 617
394 389 401
0%
2015 2016 2017 2018 2019 2020 2021
# College Degree # Some College # No College # Unknown
Enrollment by WV County
Fall 2015 Headcount Enrollment
22Fall 2016 Headcount Enrollment 23
Fall 2017 Headcount Enrollment

24
Fall 2018 Headcount Enrollment

25
Fall 2019 Headcount Enrollment

26
Fall 2020 Headcount Enrollment

Chapter 4: Faculty and Staff
Summary of Faculty (Full-Time and Part-Time)
       160

       140     145
                         133
       120
                                       107
       100
                                                90                     86
        80                                                    83
                75                              73            76       73
                         70            71
        60

        40

        20

         0
              F 2015    F 2016       F 2017    F 2018       F 2019    F 2020

                         # Full-Time Faculty    # Part-Time Faculty

27
Percent of Faculty by Gender
100%
90%
80%
36 36 37
70% 41 42 40
60%
50%
40%
30%
39 34 34
20% 32 34 33
10%
0%
F 2015 F 2016 F 2017 F 2018 F 2019 F 2020
Male Female
Percent of Faculty by Minority/Non-Minority Status
100%
7.14%
90% 20.00%
80%
46.48% 47.95% 51.32% 53.42%
70%
60%
50% 64.00% 91.43%
40%
30%
52.11% 50.68% 47.37% 45.21%
20%
10% 16.00%
0% 1.43% 1.41% 1.37% 1.32% 1.37%
F 2015 F 2016 F 2017 F 2018 F 2019 F 2020
% Minority % Non-Minority % Unknown
28Summary of Non-Instructional Staff (Full-Time and Part-Time)
200
179
180
160
137 132 135
140 123
112
120
100
80
60
40
20
0
F 2015 F 2016 F 2017 F 2018 F 2019 F 2020
Total Non-Instructional Staff
Percent of Classified Staff by Gender
100%
90%
80%
70% 59.60% 59.60% 64.90% 62.10% 62.90% 61.20%
60%
50%
40%
30%
20% 40.40% 40.40% 35.10% 37.90% 37.10% 38.80%
10%
0%
F 2015 F 2016 F 2017 F 2018 F 2019 F 2020
% Male Classified Staff % Female Non-Classified Staff
29Percent of Classified Staff by Minority/Non-Minority Status
100%
90%
80%
70% 57.70% 56.70%
64.00%
60%
91.60% 89.70% 90.60%
50%
40%
30%
20% 42.30% 43.30%
36.00%
10%
8.40% 10.30% 9.40%
0%
F 2015 F 2016 F 2017 F 2018 F 2019 F 2020
% Minority % Non-Minority
Percent of Non-Classified Staff by Gender
100%
90%
80%
45.20%
52.90% 54.10% 52.50% 53.50%
70% 60.00%
60%
50%
40%
30%
54.80%
47.10% 45.90% 47.50% 46.50%
20% 40.00%
10%
0%
F 2015 F 2016 F 2017 F 2018 F 2019 F 2020
% Male Non-Classified Staff % Female Non-Classified Staff
30Percent of Non-Classified Staff by Minority/Non-Minority
100%
90%
80%
70% 60.00% 55.90% 59.50%
60%
90.00% 90.70% 92.90%
50%
40%
30%
20% 47.00% 44.10% 40.50%
10%
10.00% 10.00% 7.10%
0%
F 2015 F 2016 F 2017 F 2018 F 2019 F 2020
% Minority % Non-Minority
Student-Faculty Ratio
18
16
16 15 15 15 15
14
14
12
10
8
6
4
2
0
F 2015 F 2016 F 2017 F 2018 F 2019 F 2020
Chapter 5: Finances
Operating Budget
FY15 FY16 FY17 FY18 FY19
Total Operating Budget $26,694,983 $22,075,288 $22,075,114 $22,433,947 $24,160,709
Revenue $28,980,000 $29,267,000 $28,143,000 $28,121,000 $28,213,000
Expenses $27,862,000 $29,910,000 $25,199,000 $25,243,000 $25,667,000
State Appropriations $ 9,859,000 $ 9,397,000 $ 9,331,000 $ 9,087,000 $ 9,995,000
31Chapter 6: Financial Aid
Promise Scholarship
FY15 FY16 FY17 FY18 FY19
# Recipients 99 122 112 112 105
% of Total Recipients 32.2% 37.8% 34.0% 36.8% 35.6%
Total Awards $322,185 $395,890 $372,234 $406,676 $396,569
% of Total Awards 34.0% 36.9% 33.0% 35.9% 35.6%
WV Higher Education Grant Program
FY15 FY16 FY17 FY18 FY19
# Recipients 608 585 625 560 483
% of Total Recipients 16.3% 15.6% 18.2% 18.2% 16.0%
Total Awards $1,227,454 $1,253,234 $1,323,884 $1,167,100 $1,072,682
% of Total Awards 15.9% 15.6% 18.2% 18.0% 16.1%
WV HEAPS Grant
FY15 FY16 FY17 FY18 FY19
# Recipients 52 54 63 72 73
% of Total Recipients 13.8% 15.0% 19.4% 18.0% 22.0%
Total Awards $97,555 $98,478 $124,000 $139,775 $141,500
% of Total Awards 15.5% 17.9% 22.6% 21.8% 24.8%
Federal Direct Loans (Subsidized)
FY15 FY16 FY17 FY18 FY19
# Recipients 648 729 899 959 1033
% of Total Recipients 19.0% 18.9% 19.9% 19.0% 19.9%
Total Awards $2,107,822 $2,118,267 $2,553,853 $2,855,253 $2,984,200
% of Total Awards 22.1% 19.6% 20.2% 20.0% 20.2%
Federal Direct Loans (Unsubsidized)
FY15 FY16 FY17 FY18 FY19
# Recipients 843 811 781 631 627
% of Total Recipients 18.6% 18.0% 19.2% 17.8% 18.8%
Total Awards $2,987,988 $2,943,101 $2,716,285 $2,332,558 $2,615,678
% of Total Awards 20.7% 20.0% 20.3% 19.3% 22.2%
32Federal Direct Parent Loans (PLUS)
FY15 FY16 FY17 FY18 FY19
# Recipients 1 3 1 4 2
% of Total Recipients 1.4% 4.1% 1.7% 8.0% 3.6%
Total Awards $7,864 $13,860 $3,217 $12,725 $16,225
% of Total Awards 1.7% 3.5% 1.0% 4.4% 5.6%
Federal Work Study
FY15 FY16 FY17 FY18 FY19
# Recipients 50 48 45 63 141
% of Total Recipients 15.8% 18.8% 15.8% 23.9% 42.6%
Total Awards $106,207 $105,194 $91,140 $122,427 $567,801
% of Total Awards 15.6% 18.2% 16.8% 22.3% 58.3%
Federal Pell Grant
FY15 FY16 FY17 FY18 FY19
# Recipients 1586 1441 1388 1182 1100
% of Total Recipients 15.8% 16.0% 16.3% 15.7% 14.9%
Total Awards $5,485,774 $5,253,573 $5,216,114 $4,634,202 $4,285,759
% of Total Awards 15.4% 15.3% 16.6% 16.0% 15.1%
Federal Supplemental Educational Opportunity Grant (SEOG)
FY15 FY16 FY17 FY18 FY19
# Recipients 114 92 106 74 111
% of Total Recipients 8.9% 8.7% 8.4% 5.2% 7.7%
Total Awards $75,167 $60,788 $73,416 $59,177 $64,282
% of Total Awards 10.6% 9.5% 11.4% 8.2% 8.8%
33Chapter 7: Retention, Persistence, Graduation
Freshmen Cohort Retention Fall-to-Fall-Starting Institution
56.00%
53.70%
54.00%
52.00%
50.00%
47.60%
48.00% 46.80%
46.00%
44.00%
42.00%
Fall 2015 Fall 2017 Fall 2020
1st Year Retention - Fall to Fall
Retention Fall-to-Fall
70.00%
58.70%
60.00% 55.90% 54.40%
51.60%
49.20% 48.80%
50.00%
40.00%
30.00%
20.00%
10.00%
0.00%
Fall 2015 Fall 2016 Fall 2017 Fall 2018 Fall 2019 Fall 2020
Retention: Fall to Fall Starting Institution
34Retention Fall-to-Spring Starting Institution
Retention Fall to Spring
82.00%
79.70%
80.00%
77.90%
78.00%
76.00% 76.00%
76.00%
74.00% 73.30%
72.00%
70.00%
Fall 2015 Fall 2016 Fall 2017 Fall 2018 Fall 2019
Retention: Fall to Spring Starting Institution
Number of Degrees and Certificates Awarded
Total # Degrees & Certificates Awarded
900
793 798
800 755
688
700 647 645
600
500
400
300
200
100
0
15-16 16-17 17-18 18-19 19-20 20-21
35Number of Students Transferring to A Four-Year Institution after Attending a Two-Year
Institution
These numbers represent the number of students each year who transferred to a four-
year institution. Although WVU Parkersburg offers bachelor’s degrees, these numbers
only represent those who transferred to a different institution that offers bachelor’s
degrees.
Transfer to Any Four-Year Institution
80
70
67
70 62
60
47 46
50
40
30
20
10
0
Fall 2015 Fall 2016 Fall 2017 Fall 2018 Fall 2019
Transfer to Four-Year Institution - All
36You can also read