Extreme Temperatures - Gloucester County Hazard Mitigation ...
←
→
Page content transcription
If your browser does not render page correctly, please read the page content below
Hazard Mitigation Plan 2022 Update
                                                                                       GLOUCESTER COUNTY, NJ

4.3.6          Extreme Temperatures
The following section provides the hazard profile (hazard description, location, extent, previous occurrences
and losses, probability of future occurrences, and impact of climate change) and vulnerability assessment for
the extreme temperature hazard in Gloucester County.

2022 Plan Update Changes
   •   The hazard profile has been significantly enhanced to include a detailed hazard description, location,
       extent, previous occurrences, probability of future occurrence, and climate change impacts.
   •   New and updated figures from other federal and state agencies are incorporated.
   •   Previous occurrences are updated with events that occurred between 2015 and 2021.
   •   A vulnerability assessment section is completed for the extreme temperature hazard. Available
       information and a preliminary assessment are used to complete this section. The vulnerability
       assessment directly follows the hazard profile.

4.3.6.1 Profile
Hazard Description
Extreme temperature includes both heat and cold events that can have significant direct impacts to human
health and commercial/agricultural businesses and primary and secondary effects on infrastructure (e.g., burst
pipes and power failure). Distinguishing characteristics of “extreme cold” or “extreme heat” vary by location,
based on the conditions to which the population is accustomed. Figure 4.3.6-1 shows the average low and
high temperatures each month at the Hammonton Station in Atlantic County (no stations are located within
Gloucester County).

                                                                              4.3.6 | Extreme Temperatures
                                                                                                      PAGE | 1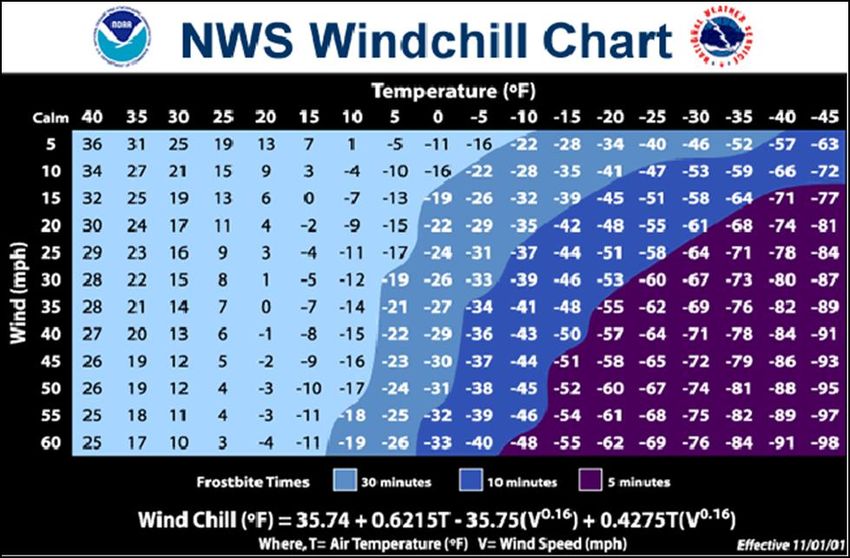
Hazard Mitigation Plan 2022 Update
                                                                                           GLOUCESTER COUNTY, NJ

                         Figure 4.3.6-1. Average Temperatures at Hammonton Station

Source: NWS 2021

Extreme Cold
Extreme cold events are when temperatures drop well below normal in an area. In regions relatively
unaccustomed to winter weather, near freezing temperatures are considered “extreme cold.” Extreme cold
temperatures are generally characterized in temperate zones by the ambient air temperature dropping to
approximately 0ºF or below (CDC 2007). Extremely cold temperatures often accompany a winter storm, which
can cause power failures and icy roads. Although staying indoors as much as possible can help reduce the risk
of car crashes and falls on the ice, individuals may also face indoor hazards. Many homes will be too cold—
either due to a power failure or because the heating system is not adequate for the weather. The use of space
heaters and fireplaces to keep warm increases the risk of household fires and carbon monoxide poisoning
(CDC 2007).

Extreme Heat
Extreme heat is defined as temperatures which hover 10 degrees or more above the average high temperature
for a region and that last for several weeks (CDC 2016). A heat wave is defined as a period of abnormally and
uncomfortably hot and unusually humid weather. Typically, a heat wave lasts two or more days (NWS 2009).
There is no universal definition of a heat wave because the term is relative to the usual weather in a particular
area. The term heat wave is applied both to routine weather variations and to extraordinary spells of heat
which may occur only once a century (Meehl 2004).

Urbanized areas and urbanization create an exacerbated type of risk during an extreme heat event, compared
to rural and suburban areas. As defined by the U.S. Census, urban areas are classified as all territory, population,
and housing units located within urbanized areas and urban clusters. The term urbanized area denotes an

                                                                                  4.3.6 | Extreme Temperatures
                                                                                                           PAGE | 2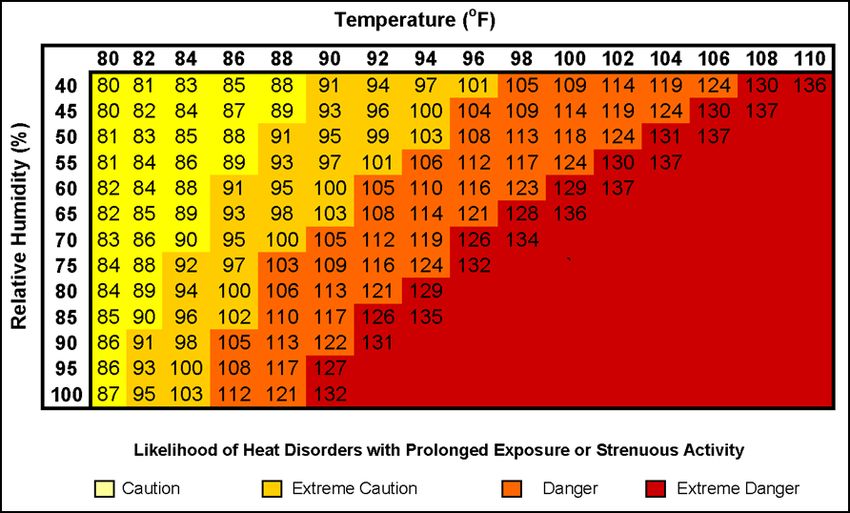
Hazard Mitigation Plan 2022 Update
                                                                                        GLOUCESTER COUNTY, NJ

urban area of 50,000 or more people. Urban areas under 50,000 people are called urban clusters. The U.S.
Census delineates urbanized area and urban cluster boundaries to encompass densely settled territory, which
generally consists of:

    •   A cluster of one or more block groups or census blocks each of which has a population density of at
        least 1,000 people per square mile at the time.
    •   Surrounding block groups and census blocks each of which has a population density of at least 500
        people per square mile at the time.
    •   Less densely settled blocks that form enclaves or indentations or are used to connect discontiguous
        areas with qualifying densities (U.S. Census Bureau 2010).

As these urban areas develop and change, so does the landscape. Buildings, roads, and other infrastructure
replace open land and vegetation. Surfaces that were once permeable and moist are now impermeable and
dry. These changes cause urban areas to become warmer than the surrounding areas. This forms an ‘island’ of
higher temperatures (EPA 2019).

The term ‘heat island’ describes built up areas that are hotter than nearby rural areas. The annual mean air
temperature of a city with more than one million people can be between 1.8 ºF and 5.4ºF warmer than its
surrounding areas. In the evening, the difference in air temperatures can be as high as 22ºF. Heat islands occur
on the surface and in the atmosphere. On a hot, sunny day, the sun can heat dry, exposed urban surfaces to
temperatures 50ºF to 90ºF hotter than the air. Heat islands can affect communities by increasing peak energy
demand during the summer, air conditioning costs, air pollution and greenhouse gas emissions, heat-related
illness and death, and water quality degradation (EPA 2019).

The figure below illustrates an urban heat island profile. The graphic demonstrates that heat islands are
typically most intense over dense urban areas. Further, vegetation and parks within a downtown area may help
reduce heat islands (U.S. EPA 2019).

                                                                               4.3.6 | Extreme Temperatures
                                                                                                       PAGE | 3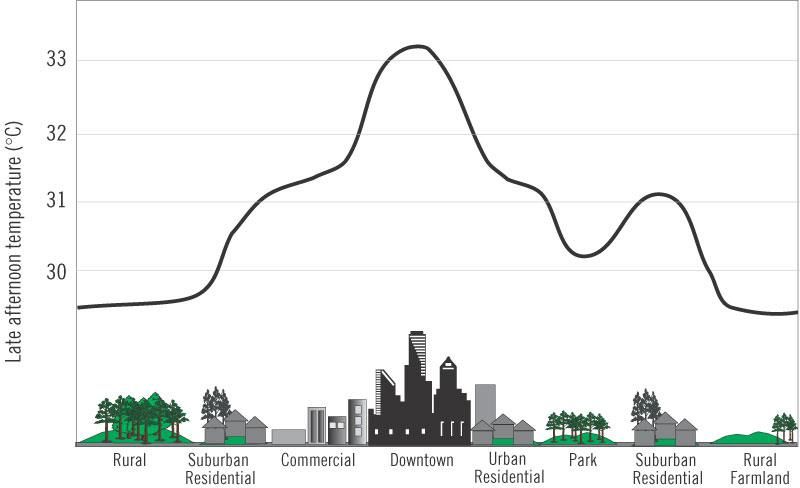
Hazard Mitigation Plan 2022 Update
                                                                                         GLOUCESTER COUNTY, NJ

                                   Figure 4.3.6-2. Urban Heat Island Profile

Source: EPA 2019
ºC:     degrees as Centigrade

Location
According to the ONJSC, New Jersey has five distinct climate regions. Elevations, latitude, distance from the
Atlantic Ocean, and landscape (e.g. urban, sandy soil) produce distinct variations in the daily weather between
each of the regions. The five regions include: Northern, Central, Pine Barrens, Southwest, and Coastal (ONJSC
2021). Figure 4.3.6-3 depicts these regions. A majority of Gloucester County is located within the Southwest
Climate Region with the southern section located in the Pine Barrens Region.

The Southwest Climate Region is located along the southwestern border stretching from Trenton all the way
to the Delaware Bay. The region is relatively suburban with pockets of urbanized areas, especially in the central
region along the Delaware River, across from Philadelphia. Due to the proximity to the Delaware Bay, this
region adds a maritime influence on the climate, having some of the highest average daily temperatures as
well as higher nighttime temperatures. In general, the region is drier than other parts of the state, and given
its more inland characteristics, is not prone to major coastal storms. That being said, the region does have
significant humidity during the summer, and making the high temperatures feel even hotter than recorded
(Rutgers University 2019).

                                                                                4.3.6 | Extreme Temperatures
                                                                                                        PAGE | 4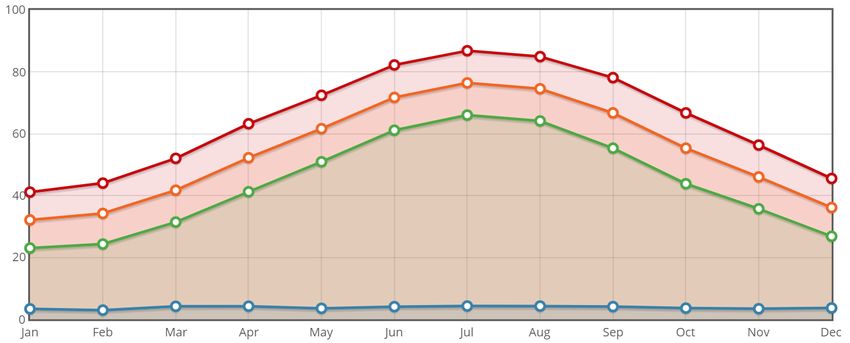
Hazard Mitigation Plan 2022 Update
                                                                                                                  GLOUCESTER COUNTY, NJ

As for the Pine Barrens Zone which covers the southeastern portion of the county, unlike its neighboring
Southwest Region, has relatively low temperatures due to solar radiation absorbed during the day and radiated
back into space during the night. Compared to its surrounding regions, Pine Barrens Zone is 15-20 degrees
cooler. In general, the region has porous and sandy soils which allow water to be absorbed quickly, causing
the zone to be relatively dry, making it vulnerable to forest fires.

                                          Figure 4.3.6-3. Climate Regions of New Jersey

Source: ONJSC Rutgers University, Date Unknown
Note:   The white oval indicates the location of Gloucester County. The County is located in the Southwest and Pine Barrens Zone.

Extent
Extreme Cold
The extent (severity or magnitude) of extreme cold temperatures are generally measured through the Wind
Chill Temperature (WCT) Index. Wind Chill Temperature is the temperature that people and animals feel when
outside and it is based on the rate of heat loss from exposed skin by the effects of wind and cold. As the wind
increases, the body is cooled at a faster rate causing the skin’s temperature to drop (NWS 2021).

                                                                                                      4.3.6 | Extreme Temperatures
                                                                                                                                    PAGE | 5
Hazard Mitigation Plan 2022 Update
GLOUCESTER COUNTY, NJ
On November 1, 2001, the NWS implemented a new WCT Index. It was designed to more accurately calculate
how cold air feels on human skin. The table below shows the new WCT Index. The WCT Index includes a
frostbite indicator, showing points where temperature, wind speed, and exposure time will produce frostbite
to humans. Figure 4.3.6-4 shows three shaded areas of frostbite danger. Each shaded area shows how long a
person can be exposed before frostbite develops (NWS 2021).
Figure 4.3.6-4 NWS Wind Chill Index
Source: NWS 2021
°F degrees Fahrenheit
mph miles per hour
Extreme Heat
NOAA’s heat alert procedures are based mainly on Heat Index values. The Heat Index is given in degrees
Fahrenheit. The Heat Index is a measure of how hot it really feels when relative humidity is factored in with the
actual air temperature. To find the Heat Index temperature, the temperature and relative humidity need to be
known. Once both values are known, the Heat Index will be the corresponding number with both values (Figure
4.3.6-5). The Heat Index indicates the temperature the body feels. Adverse effects of prolonged exposure to
heat are displayed in Figure 4.3.6-6. It is important to know that the Heat Index values are devised for shady,
light wind conditions. Exposure to full sunshine can increase heat index values by up to 15°F. Strong winds,
particularly with very hot dry air, can also be extremely hazardous (NWS 2021).
4.3.6 | Extreme Temperatures
PAGE | 6Hazard Mitigation Plan 2022 Update
GLOUCESTER COUNTY, NJ
Figure 4.3.6-5 NWS Heat Index
Source: NWS 2013
°F degrees Fahrenheit
% percent
Figure 4.3.6-6 Adverse Effects of Prolonged Exposure to Heat on Individuals
Category Heat Index Health Hazards
Extreme Danger 130 F – Higher Heat Stroke / Sunstroke is likely with continued exposure.
Sunstroke, muscle cramps, and/or heat exhaustion possible with
Danger 105 F – 129 F
prolonged exposure and/or physical activity.
Sunstroke, muscle cramps, and/or heat exhaustions possible with
Extreme Caution 90 F – 105 F
prolonged exposure and/or physical activity.
Caution 80 F – 90 F Fatigue possible with prolonged exposure and/or physical activity.
Source: NWS 2021
°F degrees Fahrenheit
Warning Time
Meteorologists can accurately forecast extreme temperature event development and the severity of the
associated conditions with several days lead time. These forecasts provide an opportunity for public health
and other officials to notify vulnerable populations. For heat events, the NWS issues excessive heat outlooks
when the potential exists for an excessive heat event in the next three to seven days. Watches are issued when
conditions are favorable for an excessive heat event in the next 24 to 72 hours. Excessive heat
warning/advisories are issued when an excessive heat event is expected in the next 36 hours (NWS 2021).
Winter temperatures may fall to extreme cold readings with no wind occurring. Currently, the only way to
headline very cold temperatures is with the use of the NWS-designated Wind Chill Advisory or Warning
4.3.6 | Extreme Temperatures
PAGE | 7Hazard Mitigation Plan 2022 Update
GLOUCESTER COUNTY, NJ
products. When actual temperatures reach Wind Chill Warning criteria with little to no wind, extreme cold
warnings may be issued (NWS 2021).
Previous Occurrences and Losses
Weather variability, coupled with concentrated population centers, can produce wide fluctuations in
temperatures. The State and County have experienced multiple episodes of extreme temperatures, both hot
and cold, that have resulted in cascading effects and even utility failure (Gloucester County 2016).
Many sources provided historical information regarding previous occurrences and losses associated with
extreme temperatures throughout New Jersey and Gloucester County; therefore, the loss and impact
information for many events could vary depending on the source. The accuracy of monetary figures discussed
is based only on the available information in cited sources.
New Jersey has been experiencing an increase in extreme temperatures across the State. Historically, there has
been an increase in temperature during the warmest months in New Jersey, with the majority of the extreme
heat months occurring after 1990. Conversely, the months which set records for extreme cold temperatures
tended to occur prior to 1930.
FEMA Major Disasters and Emergency Declarations
Between 1954 and 2020, neither Gloucester County or the State of New Jersey was not included in any major
disaster (DR) or emergency (EM) declarations due to extreme temperatures. However, during the same time
period, the Federal Emergency Management Agency (FEMA) included Gloucester County in six winter storm-
related DR or EM declarations classified as one or a combination of the following disaster types: severe winter
storm, snowstorm, snow, ice storm, winter storm, and q (FEMA 2021).
Table 4.3.6-1. Winter Weather Related Disaster (DR) and Emergency (EM) Declarations 1954-2021
Declaration Event Date Declaration Date Event Description
EM-3106 March 13-17, 1993 March 17, 1993 Snow: Severe Blizzard
DR-1088 January 7-12, 1996 January 13, 1996 Snow: Blizzard of 96 (Severe Snow Storm)
February 16-17,
EM-3181 March 20, 2003 Snow: Snow
2003
EM-1889 February 5-6, 2010 March 23, 2010 Severe Winter Storm and Snowstorm
December 19 - 20,
DR-1873 February 5, 2010 Snowstorm
2009
Source: FEMA 2021
U.S. Department of Agriculture Disaster Declarations
Agriculture-related heat/ cold disasters are quite common. Usually, they occur along with other weather events
such as drought, winter storms, frosts, and even flooding. Overall, it is difficult to separate the agricultural loss
caused by extreme temperatures from their partner weather events (drought, winter storm, etc.). However, on
4.3.6 | Extreme Temperatures
PAGE | 8Hazard Mitigation Plan 2022 Update
GLOUCESTER COUNTY, NJ
a cumulative scale these events can cause significant damage and as a result have been recorded as USDA
disasters. Table 4.3.6-2 lists the disaster declarations related to extreme temperatures within Gloucester County
between 2012 and 2021.
Table 4.3.6-2 USDA Disaster Declarations for Gloucester County 2012-2021
Declaration
Declaration Event Date Event Description
Date
August 28, Severe freeze and frost. No agricultural loss was
S4748 April 6- May 15, 2020
2020 reported.
Excessive heat and drought conditions. No agricultural
S4425 June 24 – July 21, 2018 April 31, 2018
loss was reported.
April 1 - September 9, October 5, Combined effects of freeze, excessive heat, and
S4071
2016 2016 drought. No agricultural loss was reported.
April 1 – September 29, November 4, Excessive Heat and Drought. No agricultural loss was
S3930
2015 2015 reported.
July 16 - September 29, November 4, Excessive Heat and Drought. No agricultural loss was
S3932
2015 2015 reported.
The combined effects of drought, high winds (Derecho),
June 28 – November 8, February 14, hail, excessive heat, excessive rain, flash flooding,
S3487
2012 2013 Hurricane Sandy, snowstorm, and Nor'easter. No
agricultural loss was reported.
Source: USDA 2021
Extreme Temperature Events
The National Oceanic and Atmospheric Administration (NOAA) National Centers for Environmental
Information (NCEI) Storm Events database records and defines extreme temperature events as follows:
• Cold/Wind Chill is reported in the NOAA-NCEI database when a period of low temperatures or wind
chill temperatures reach or exceed locally or regionally defined advisory conditions (typical value is -
18 °F or colder).
• Excessive Heat is reported in the NOAA-NCEI database whenever heat index values meet or exceed
locally or regionally established excessive heat warning thresholds.
• Extreme Cold/Wind Chill is reported in the NOAA-NCEI database when a period of extremely low
temperatures or wind chill temperatures reaches or exceeds locally or regionally defined warning
criteria (typical value around -35 °F or colder).
• Heat is reported in the NOAA-NCEI database whenever heat index values meet or exceed locally or
regionally established advisory thresholds.
For this 2022 Plan Update, known extreme temperature events that have impacted Gloucester County between
2015 and 2020 are identified in Table 4.3.6-3. With extreme temperature documentation for New Jersey and
Gloucester County being so extensive, not all sources have been identified or researched. Therefore, Table
4.3.6-3 may not include all events that have occurred in the County. Please see Section 9 for detailed
information regarding impacts and losses to each municipality.
4.3.6 | Extreme Temperatures
PAGE | 9Hazard Mitigation Plan 2022 Update
GLOUCESTER COUNTY, NJ
Table 4.3.6-3 Extreme Temperature Events in Gloucester County, 2015 to 2021
FEMA
Declaration Gloucester
Date(s) of Number County
Event Event Type (if applicable) Designated? Location Description
The arrival of an arctic air mass brought one of the coldest mornings of the month of
January to most of New Jersey. Morning low temperatures were mainly in the single
January 7, Cold/wind
N/A No Gloucester County numbers above zero. In addition, gusty northwest winds continued into the morning
2015 Chill
and lowest hourly wind chill factors reached around degrees below zero throughout
the state.
Northwest winds that persisted into the morning of the 13th combined with an arctic
February 13, Cold/wind air mass to produce wind chill factors of around 10 degrees below zero and low
N/A No Gloucester County
2015 Chill temperatures in the positive single numbers throughout most of New Jersey. Multiple
deaths were recorded across the state.
The combination of strong to high winds and an approaching arctic air mass-
produced wind-chill factors of 10 to 15 degrees below zero during the first half of the
February 15, Cold/wind day on the 15th in New Jersey. Many municipalities declared code blues. Plumbers
N/A No Gloucester County
2015 Chill were swamped with frozen pipe calls. Some say it was the busiest they have been in
over 20 years. Shelters were full. Even oil lines were freezing. Some homes ran out of
heating oil.
The arrival of another arctic air mass brought some of the lowest wind chills as well as
the lowest temperatures of the winter season to New Jersey on the 20th and 21st. As
February 20, Cold/wind far as wind chill factors went, the first half of the day on the 20th was colder with wind
N/A No Gloucester County
2015 Chill chill factors as low as around 20 degrees below zero during the morning. Actual low
temperatures were around zero. 2 degrees above zero was recorded in Sewell
(Gloucester County).
Unlike the two previous arctic outbreaks earlier this month, this one was not
accompanied by strong winds during the first half of the day. Air and wind chill
February 24, Cold/wind
N/A No Gloucester County temperatures were nearly the same. Morning low temperatures averaged 25 to 35
2015 Chill
degrees colder than normal. 2 degrees above zero was recorded in South Harrison
(Gloucester County).
An unseasonably hot and humid air mass caused high temperatures to reach the
June 12, lower to mid-90s in southwest New Jersey on the 12th. Combined with relatively high
Heat N/A No Gloucester County
2015 dew points, peak hourly heat index values reached the upper 90s. The heat forced
some schools, especially those without air conditioning, to dismiss children early.
N/A Unseasonably hot and humid weather occurred across southern New Jersey on the
23rd with high temperatures reaching into the lower to mid-90s and afternoon heat
June 23,
Heat No Gloucester County indices of around 100 degrees F. This air mass provided the necessary energy for a
2015
strong to severe squall line of thunderstorms that moved through the southern half of
the state during the very late afternoon and early evening.
4.3.6 | Extreme Temperatures
PAGE | 10Hazard Mitigation Plan 2022 Update
GLOUCESTER COUNTY, NJ
FEMA
Declaration Gloucester
Date(s) of Number County
Event Event Type (if applicable) Designated? Location Description
Unseasonably hot and humid weather affected most of New Jersey on the 19th and
20th. High temperatures in most areas reached into the lower to mid-90s both days.
The 19th was slightly hotter and more humid overall. The combination of heat and
humidity brought afternoon heat index values as high as 100 degrees F to 105
Excessive degrees F on the 19th. These were some of the highest heat index values of the entire
July 19, 2015 N/A No Gloucester County
Heat summer. A dissipating cold front on the 20th brought slightly drier air into the region
during the afternoon of the 20th and heat index values peaked around 100 degrees F
A re-enforcing cold frontal passage on the 21st brought even cooler and drier air into
the area and by the 22nd all high temperatures were less than 90 degrees in New
Jersey.
Bitter cold temperatures and strong northwest winds associated with an Arctic
outbreak combined to create dangerous wind chill temperatures across the entire
northeast quadrant of the county beginning Saturday morning, February 13th into
February 14, Cold/wind Sunday afternoon, February 14th. Below zero minimum temperatures were common
N/A No Gloucester County
2016 Chill along and north of the I-78 corridor. Wind chill values at this same time ranged from -
46 degrees at High Point to 10 degrees above zero near the waters of the back bays
near the coast. The lowest wind chill values were reported at the following locations
during the early morning hours of February 14th.
Temperatures in the middle to upper 90s and dew points in the upper 60s to lower
Excessive
July 1, 2018 N/A No Gloucester County 70s led to excessive heat across New Jersey. Heat indices reached 111 degrees at the
Heat
Somerset ASOS at 3 pm on July 3rd.
Source: NOAA-NCEI 2021 NWS 2021, FEMA 2021
°F degrees Fahrenheit
4.3.6 | Extreme Temperatures
PAGE | 11Hazard Mitigation Plan 2022 Update
GLOUCESTER COUNTY, NJ
Probability of Future Occurrences
It is anticipated that Gloucester County will continue to experience extreme temperatures annually that may
coincide with or induce secondary hazards such as snow, hail, ice or windstorms, thunderstorms, drought,
human health impacts, and utility failures. Table 4.3.6-4 shows the annual number of events, recurrence
interval, annual probability, and annual percent chance of occurrence for the hazards associated with extreme
temperatures and reported in the NOAA-NCEI Storm Events Database.
Table 4.3.6-4 Probability of Occurrences of Extreme Temperature Events
Number of Occurrences Between 1950 % Chance of Occurring in Any
Hazard Type
and 2020 Given Year
Cold/Wind Chill 25 36%
Excessive Heat 24 34%
Extreme Cold/Wind Chill 2 3%
Heat 61 87%
TOTAL 112 100%
Source: NOAA-NCEI 2021
Note: Probability was calculated using the available data provided in the NOAA-NCDC storm events database.
Based on these historical records and input from the Steering Committee, the probability of occurrence for
extreme temperatures in Gloucester County is considered “occasional” (10-100 percent chance of annual
occurrence) (Section 4.4 Hazard Ranking).
Climate Change Impacts
Providing projections of future climate change for a specific region is challenging. Shorter term projections
are more closely tied to existing trends making longer term projections even more challenging. The further
out a prediction reaches the more subject to changing dynamics it becomes.
Providing projections of future climate change for a specific region is challenging. Shorter term projections
are more closely tied to existing trends making longer term projections even more challenging. The further
out a prediction reaches the more subject to changing dynamics it becomes.
Climate change includes major changes in temperature, precipitation, or wind patterns, which occur over
several decades or longer. Due to the increase in greenhouse gas concentrations since the end of the 1890s,
New Jersey has experienced a 3.5° F (1.9° C) increase in the State’s average temperature (ONJSC 2021) which
is faster than the rest of the Northeast region (2° F [1.1° C]) (Melillo 2014) and the world (1.5° F [0.8° C]) (Meyer
2014). This warming trend is expected to continue. By 2050, temperatures in New Jersey are expected to
increase by 4.1 to 5.7° F (2.3° C to 3.2° C) (Horton 2015). Thus, New Jersey can expect to experience an average
annual temperature that is warmer than any to date (low emissions scenario) and future temperatures could
be as much as 10° F (5.6° C) warmer (high emissions scenario) (Runkle 2017). New Jersey can also expect that
4.3.6 | Extreme Temperatures
PAGE | 12Hazard Mitigation Plan 2022 Update
GLOUCESTER COUNTY, NJ
by the middle of the 21st century, 70 percent of summers will be hotter than the warmest summer experienced
to date (Runkle 2017). The increase in temperatures is expected to be felt more during the winter months
(December, January, and February), resulting in less intense cold waves, fewer sub-freezing days, and less snow
accumulation.
4.3.6.2 Vulnerability Assessment
To understand risk, a community must evaluate what assets are exposed and vulnerable. For the extreme
temperature hazard, the entire county has been identified as exposed; therefore, all assets are potentially
vulnerable. The following text estimated potential impacts of extreme temperatures on Gloucester County.
Impact on Life, Health and Safety
For the purposes of this HMP, the entire population of Gloucester County is exposed to extreme temperature
events (population of 291,165 people, according to the 2019 American Community Survey population
estimates). Extreme temperature events have potential health impacts including injury and death. According
to the Centers for Disease Control and Prevention, populations most at risk to extreme cold and heat events
include the following: 1) the elderly, who are less able to withstand temperatures extremes due to their age,
health conditions, and limited mobility to access shelters; 2) infants and children up to four years of age; 3)
individuals with chronic medical conditions (e.g., heart disease, high blood pressure), 4) low-income persons that
cannot afford proper heating and cooling; and 5) the general public who may overexert during work or exercise
during extreme heat events or experience hypothermia during extreme cold events (CDC 2017a).
In Gloucester County, each municipality has areas of high concentration of elderly population (over 100 persons
per square mile) with higher concentrations located in the more urban, densely populated areas of the County.
Such urbanized areas include Glassboro, Monroe, and communities located along the Delaware River and New
Jersey Turnpike. As a relatively suburban county, Gloucester County is fortunate to have areas of greenery which
decrease the overall county’s vulnerability to heat waves. However, as the county increases development,
preservation of such spaces can become more difficult thus increasing the population’s vulnerability, especially
elderly to increased extreme temperature events.
Residents with low incomes might not have access to housing or their housing can be less able to withstand
cold temperatures (e.g., homes with poor insulation and heating supply). In Gloucester County, while the
general composition of the population is middle to upper middle class, 6.2 percent are below the poverty line,
most of which live in the more urbanized areas of the county. Refer to Figure 4-11 in Section 3 (County Profile)
that displays the densities of low-income populations in Gloucester County (U.S. Census Bureau 2010).
The Centers for Disease Control’s (CDC) 2016 Social Vulnerability Index (SVI) ranks U.S. Census Tracts on
socioeconomic status, household composition and disability, minority status and language, and housing and
transportation. Census Tracts in Woodbury have been ranked in the highest vulnerability category with values
between 0.75 and 1.0; Census Tract 5010.02 in Woodbury has the highest social vulnerability with a ranking of
4.3.6 | Extreme Temperatures
PAGE | 13Hazard Mitigation Plan 2022 Update
GLOUCESTER COUNTY, NJ
0.93. Such Census Tracts in these communities might be more susceptible to impacts from extreme temperatures.
The figure below displays the CDC 2016 SVI.
Figure 4.3.6-7. CDC’s Social Vulnerability Index 2016
Source: CDC 2021
In addition, safety issues include not only health-related impacts, but domicile impacts as home fires occur
more often in winter than any other season (FEMA 2020).
Meteorologists can accurately forecast extreme heat and cold event development and the severity of the
associated conditions with several days of lead time. These forecasts provide an opportunity for public health
and other officials to notify vulnerable populations, implement short-term emergency response actions, and
focus on surveillance and relief efforts on those at greatest risk. Adhering to extreme temperature warnings
and conducting appropriate mitigation and preparation measures can significantly reduce the risk of
temperature-related deaths.
4.3.6 | Extreme Temperatures
PAGE | 14Hazard Mitigation Plan 2022 Update
GLOUCESTER COUNTY, NJ
Impact on General Building Stock
All the building stock in the county is exposed to the extreme temperature hazard. Refer to Section 3 (County
Profile), which summarizes the building inventory in Gloucester County. Extreme heat generally does not
impact buildings; however, elevated summer temperatures increase the energy demand for cooling. Losses
can be associated with the overheating of heating, ventilation, and air conditioning (HVAC) systems. Extreme
cold temperature events can damage buildings through freezing/bursting pipes and freeze/thaw cycles, as
well as increasing vulnerability to home fires. Additionally, manufactured homes (mobile homes) and
antiquated or poorly constructed facilities can have inadequate capabilities to withstand extreme
temperatures.
4.3.6.3 Impact on Critical Facilities
All critical facilities in the county are exposed to the extreme temperature hazard. Impacts to critical facilities
are the same as described for general building stock. Additionally, it is essential that critical facilities remain
operational during natural hazard events. Extreme heat events can sometimes cause short periods of utility
failures, commonly referred to as brown-outs, due to increased usage from air conditioners and other energy-
intensive appliances. Similarly, heavy snowfall and ice storms, associated with extreme cold temperature
events, can cause power interruption. Backup power is recommended for critical facilities and infrastructure.
Additionally, designating and developing emergency cooling or heating facilities can also enhance the
resilience and safety of communities.
Impact on Economy
Extreme temperature events also have impacts on the economy, including loss of business function and
damage to and loss of inventory. Business-owners can be faced with increased financial burdens due to
unexpected repairs caused to the building (e.g., pipes bursting), higher than normal utility bills, or business
interruption due to power failure (i.e., loss of electricity, telecommunications). In response to such
vulnerabilities to the existing utility infrastructure, in July 2014 the State has established the New Jersey Energy
Resilience Bank (“ERB” or the “Bank”), the first public infrastructure bank in the nation to focus on energy
resilience (State of New Jersey 2021). The ERB is a direct and innovative approach to address significant energy
infrastructure vulnerabilities arising in the aftermath of Superstorm Sandy. Utilizing $200 million through New
Jersey’s second Community Development Block Grant-Disaster Recovery (CDBG-DR) allocation, the ERB
supports the development of distributed energy resources at critical facilities throughout the state that will
enable them to remain operational during future outages.
Based on information from the 2017 Census of Agriculture, 580 farms were present in Gloucester County,
encompassing 191 acres of total farmland. The average farm size was 85 acres. The total market value of
agricultural products from Gloucester County farms was $176,644 (USDA 2017).
4.3.6 | Extreme Temperatures
PAGE | 15Hazard Mitigation Plan 2022 Update
GLOUCESTER COUNTY, NJ
Future Changes that May Impact Vulnerability
Understanding future changes that impact vulnerability in the county can assist in planning for future
development and ensuring that appropriate mitigation, planning, and preparedness measures are in place.
The county considered the following factors to examine potential conditions that may affect hazard
vulnerability:
• Potential or projected development.
• Projected changes in population.
• Other identified conditions as relevant and appropriate, including the impacts of climate change.
Projected Development and Change in Population
The ability of new development to withstand extreme temperature impacts lies in sound land use practices
and consistent enforcement of codes and regulations for new construction. New development will change the
landscape where buildings, roads, and other infrastructure potentially replace open land and vegetation.
Surfaces that were once permeable and moist are now impermeable and dry. These changes cause urban areas
to become warmer than the surrounding areas forming (heat islands as described above). Specific areas of
recent and new development are indicated in tabular form and/or on the hazard maps included in the
jurisdictional annexes in Volume II, Section 9 (Jurisdictional Annexes) of this plan.
According to population projections from the State of New Jersey Department of Labor and Workforce
Development, Gloucester County will experience an increase in population between 2010 and 2030 by 30.4
percent and is projected to continue to lead the state’s population growth in the next two decades. Population
change is not expected to have a measurable effect on the overall vulnerability of the county’s population over
time. However, drastic increases less densely populated areas of the County may require utility system
upgrades to keep up with utility demands (e.g., water, electric) during extreme temperature events to prevent
increased stresses on these systems. Additionally, by increasing development, green space preservation will
need to continue to be a priority to mitigate increased heat islands. Refer to Section 3 (County Profile) for a
detailed discussion on population changes.
Climate Change
As discussed above, most studies project that the State of New Jersey will see an increase in average annual
temperatures. As the climate warms, extreme cold events might decrease in frequency, while extreme heat
events might increase in frequency; the shift in temperatures could also result in hotter extreme heat events.
With increased temperatures, vulnerable populations could face increased vulnerability to extreme heat and
its associated illnesses, such as heatstroke and cardiovascular and kidney disease. Additionally, as temperatures
rise, more buildings, facilities, and infrastructure systems may exceed their ability to cope with the heat. Thus,
building efficiency and upgrading heating and cooling technology/HVAC will become an increasingly
important issue for businesses and homeowners over the coming years.
4.3.6 | Extreme Temperatures
PAGE | 16Hazard Mitigation Plan 2022 Update
GLOUCESTER COUNTY, NJ
Change of Vulnerability Since the 2016 HMP
Overall, the entire county remains vulnerable to extreme temperatures. As existing development and
infrastructure continue to age, they can be at increased risk to failed utility systems (e.g., HVAC) if they are not
properly maintained or upgraded. Similarly, an increase in the elderly population remaining in the county
increases the vulnerable population.
4.3.6 | Extreme Temperatures
PAGE | 17You can also read