Explainable Student Performance Prediction With Personalized Attention for Explaining Why A Student Fails
←
→
Page content transcription
If your browser does not render page correctly, please read the page content below
Explainable Student Performance Prediction With Personalized Attention for
                                                                  Explaining Why A Student Fails

                                                                                         Kun Niu, Xipeng Cao, Yicong Yu
                                                                     School of Computer Science (National Pilot Software Engineering School),
                                                                           Beijing University of Posts and Telecommunications, Beijing
                                                                                  {niukun, xpcao, yicongyu1012}@bupt.edu.cn
arXiv:2110.08268v1 [cs.CY] 15 Oct 2021

                                                                     Abstract
                                           As student failure rates continue to increase in higher ed-
                                           ucation, predicting student performance in the following
                                           semester has become a significant demand. Personalized stu-
                                           dent performance prediction helps educators gain a compre-
                                           hensive view of student status and effectively intervene in
                                           advance. However, existing works scarcely consider the ex-
                                           plainability of student performance prediction, which educa-
                                           tors are most concerned about.
                                           In this paper, we propose a novel Explainable Student per-
                                           formance prediction method with Personalized Attention
                                           (ESPA) by utilizing relationships in student profiles and prior
                                           knowledge of related courses. The designed Bidirectional
                                           Long Short-Term Memory (BiLSTM) architecture extracts
                                           the semantic information in the paths with specific patterns.
                                           As for leveraging similar paths’ internal relations, a local and
                                           global-level attention mechanism is proposed to distinguish        Figure 1: Illustration a sketch of the long short-term (all
                                           the influence of different students or courses for making pre-     semesters and each semester) student profiles reflects the re-
                                           dictions. Hence, valid reasoning on paths can be applied to        lationship between students, students-courses, and courses.
                                           predict the performance of students. The ESPA consistently         The dashed line indicates a prior knowledge between
                                           outperforms the other state-of-the-art models for student per-     courses, and the solid lines denote the relationships between
                                           formance prediction, and the results are intuitively explain-      students and courses.
                                           able. This work can help educators better understand the dif-
                                           ferent impacts of behavior on students’ study.

                                                                                                              Courses (MOOCs) interaction data during a short period Ab-
                                                                 Introduction                                 delrahman and Wang (2019); Yeung (2019); Ai et al. (2019);
                                         The higher education environment is more liberal than oth-           Vie and Kashima (2019); Liu et al. (2020), while real-world
                                         ers, leaving students with high rates of failure. An endur-          teaching scenarios tend to have higher teaching quality and
                                         ing issue in higher education is to accurately predict stu-          more extended periods. Nowadays, educational data has be-
                                         dents’ performance after tracking their learning and behav-          come more heterogeneous with multiple sources, and a large
                                         ior data Spector (2018). One significant application of stu-         amount of student interaction data has been retrieved. By ob-
                                         dent performance prediction is to allow educators to moni-           serving the data, we noticed that students’ semester perfor-
                                         tor students’ learning status. Consequently, educators could         mance changes dynamically and is prominently affected by
                                         identify at-risk students to provide timely interventions and        their behavior. It is essential to utilize students’ short-term
                                         guide them through their studies to graduate Xing et al.             behavioral preferences during the course and long-term be-
                                         (2015).                                                              havioral habits since students enroll. This forces researchers
                                                                                                              to build longer and deeper sequential models. In current
                                            With the rapid growth of educational data, processing
                                                                                                              works, educators only get black box-like performance pre-
                                         massive amounts of data requires more complex algorithmic
                                                                                                              dictions that are unconvinced. Therefore, it is significant to
                                         sets and data process methods Dutt, Ismail, and Herawan
                                                                                                              show the model’s prediction basis and explain which behav-
                                         (2017). Prior works generally focus on Massive Open Online
                                                                                                              iors principally affect the students’ performance.
                                         Copyright © 2020, Association for the Advancement of Artificial         Moreover, there are significant similarities between stu-
                                         Intelligence (www.aaai.org). All rights reserved.                    dents and courses, e.g., the phenomenon of birds of a feather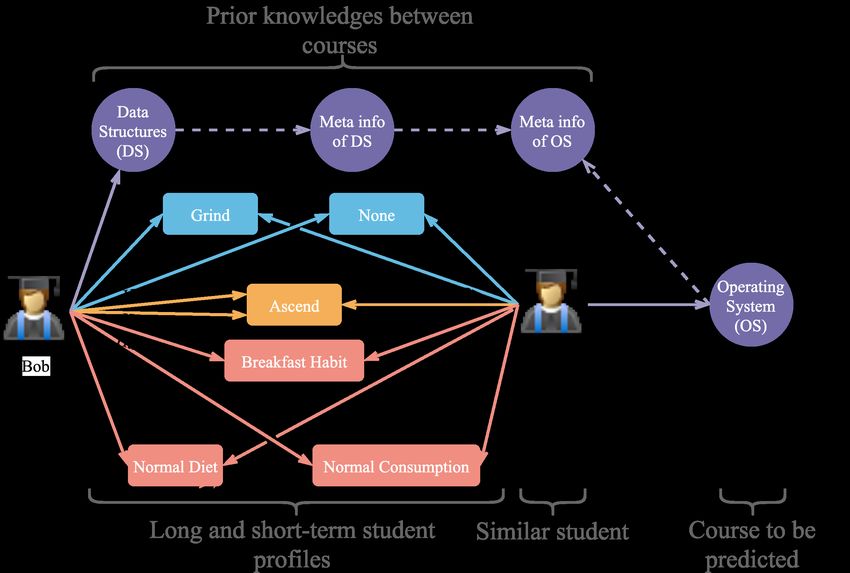
flock together is common in high education. Furthermore,                                Related Works
university courses are often related and have certain simi-
larities. It has proved that the student performance predic-
                                                                   Performance Prediction
tion task is quite similar to recommendation problems Byd-         Recommender-based methods Thai-Nghe et al. (2010)
zovská (2015); Su et al. (2018). We leverage the idea of col-     proposed using matrix factorization and collaborative filter-
laborative filtering Sweeney et al. (2016) in recommender          ing techniques in recommender systems for predicting stu-
systems to predict performance through students with simi-         dent performance. The work of Bydzovská (2015) applies
lar behavior.                                                      collaborative filtering to student performance prediction.
   To discover such similarities and solve the problem men-        Furthermore, Sweeney et al. (2016) used a recommender
tioned above of difficulty modeling long short-term data,          method to predict the next term student performance and
we explicitly construct the connections between students           find the collaborative filtering based method to achieve the
and courses using the long short-term student profile and          lowest prediction error. Similarly, He et al. (2017) proposed
the course knowledge graph. The student profile is calcu-          the neural architecture for binary classification or recom-
lated from the students’ long-term behavior habits (includ-        mendation tasks with implicit feedback. These works proved
ing the students’ learning and living status since enrollment)     the feasibility of the recommender-based method, and the
and short-term behavior preferences (including the students’       similarity between students can be utilized to predict student
learning and living status in a specific semester). The course     performance.
knowledge graph contains the prior knowledge between the
courses and the courses’ meta-information, e.g., Data Struc-
ture (DS) is a prerequisite course for Operating System            Deep learning methods Recent researches focused on
(OS).                                                              leverage deep learning methods to improve prediction per-
   For instance, figure 1 indicates that Bob and Tom have          formance, Kim, Vizitei, and Ganapathi (2018b,a) recasted
several same tags in the student profile. They have similar        the student performance prediction problem as a sequential
habits and similar academic records. Besides, Bob and Tom          event and proposed CritNet for extracting student learning
belong to different grades of the same major, and Tom is           status during a course. Su et al. (2018); Liu et al. (2019)
higher than Bob. Cause Tom passed the OS and Bob passed            proposed an Exercise-Enhanced Recurrent Neural Network
the DS, we can infer that Bob may also pass the OS. Con-           framework with an attention mechanism, which leverages
versely, if the model predicts that Bob will pass the OS, we       the sequence of exercises for inferring scores. This work in-
wish to know why the model makes decisions.                        spired us to leverage the representations of the student pro-
                                                                   file for predicting student performance. In recent years, there
   To fill the gap in the lack of explainability of current per-
                                                                   are several deep learning methods using data such as knowl-
formance prediction approaches, we propose a novel Ex-
                                                                   edge graphsHuang et al. (2018); Wang et al. (2019); Xian
plainable Student performance prediction method with Per-
                                                                   et al. (2019, 2020), commentsLuo et al. (2015); Dascalu et
sonalized Attention (ESPA). The heart of our work is a
                                                                   al. (2016) as side information for providing explainability.
path encoder and a personalized attention module. In the
                                                                   Inspired by these works, we utilize the long short-term stu-
path encoder, we use several Bidirectional Long Short-Term
                                                                   dent profile and the relationships between the courses, which
Memory (BiLSTM) networks to learn the representations of
                                                                   have been generally ignored in the educational field.
student-course paths in the student profile and course knowl-
edge graph. Since different students, courses, and behaviors
may have different informativeness for prediction. Where-          Path-based Methods
after, we notice that even the same behavior (such as late         In the literature on path-based methods, Zhou et al. (2018)
sleeping) may affect their studies for different students. A       first clustered a collection of learners and trains the LSTM
local- and global-level attention mechanism is designed to         model to predict their learning paths and performance. As
distinguish these differences. Extensive experimental results      for the knowledge graph, Catherine et al. (2017) proposed a
on a real-world dataset validate the effectiveness of our ap-      method using a knowledge graph to produce recommenda-
proach on student performance prediction.                          tions and predictions with the explanations. Moreover, Wang
   Our main contributions are listed below:                        et al. (2019) contributed a novel model named Knowledge-
• We propose a novel hierarchical attention mechanism for          aware Path Recurrent Network (KPRN) to utilize a knowl-
  student performance prediction, combined with knowl-             edge graph for the recommendation. Inspired by KPRN, we
  edge graphs to provide significant explainability.               generate representations for paths by accounting for both en-
                                                                   tities and relations and perform reasoning based on paths.
• We provide a solution to complete student performance            However, KPRN does not take into account the connection
  prediction in an end-to-end manner with a large amount           between users and the individualized preference of users.
  of heterogeneous student interaction data. Our model has         Furthermore, our approach mainly considers the similarity
  the potential to be extended to other tasks.                     between students and courses. ESPA can perform personal-
• Experimental results on a real-world dataset show that           ized performance prediction with the hierarchical attention
  ESPA outperforms most state-of-the-art approaches. It is         mechanism. At present, for short meta-paths with specific
  also highly explainable for explaining why the model pre-        patterns, the Recurrent Neural Network (RNN)-based ap-
  dicts one student may fail in the examination.                   proach is still efficient. Following the previous works, we
                                                                   still leverage the RNN-based method to extract the represen-
Figure 2: The framework of our approach for explainable student performance prediction. The Path Encoder part will be detailed
in the third subsection. The query of hierarchical attention mechanism is the embedding of student id. We leverage student id
to extract the most related paths of each scale. Finally, the attention scores to weight the performance representations of similar
students to predict the student whether fails.
tations of the paths in the student profile and the knowledge work of Chaudhari, Azaria, and Mitchell (2017), we
graph of courses. define student-tag relationships in student profile with
{(s, have, t)|s ∈ S, t ∈ T } and {(t, belong to, s)|t ∈
Method T , s ∈ S}. Furthermore, student-course relationships
In this section, we elaborate on our approach to student per- are defined as {(s, get grade, grade)|s ∈ S, score ∈
formance prediction. We translate student performance pre- {P (pass), F (f ail)}} and {(grade, in, c)|s ∈ S, c ∈ C}.
dictions into a binary classification problem (positive sam- We merge the course knowledge graph, the student
ple 1 represents failure, negative sample 0 means pass a profile, and student-course relationships as a final point.
course) since educators are more concerned with students Thus we get a comprehensive knowledge graph KG =
at risk of failing. Before introducing the model, we first de- {(e1 , r, e2 )|e1 , e2 ∈ E, r ∈ R} where E = C ∪ S ∪ T ∪
fine student-course paths and prior knowledge of courses {score} and R = RC ∪ RS . For consistency, the knowledge
formally. graph KG in the rest paper denotes the combined graph.
Student paths Performance inference from similar students and
A knowledge graph is a directed graph composed of entities prior courses
and relationships. In the course knowledge graph, we use For a given student s and course c pair, we can discover
0
0
C = {ci }C i=1 (C is the number of courses) to denote the multiple paths from student s to other student s0 by their
0
set of courses and its meta-information. And RC = {ri }R i=1 common tags in the KG. By concatenating these paths
to represent relationships between courses. The knowledge with the paths from student s0 to course c, we define
graph is generally represented as triples of nodes and edges such student-tag-student-course paths (e.g., the solid links
such as {(c1 , r, c2 )|c1 , c2 ∈ C, r ∈ RC }, where entities in figure 1) as Similar Student P aths (SSP ). We lever-
c1 , c2 indicates the start node and end node. And r repre- age such paths between two students to measure whether
sents the relationship between two courses (e.g., course DS they are similar. The multiple-step paths with the pattern
is a required course for the OS). like student-course-course, which contain the prior course
0 0
For student profile, S = {si }Si=1 and T = {ti }Ti=1 sepa- knowledge (e.g., the dashed links in figure 1), are defined as
rately denote the student set and the tag set in Course Knowledge P aths (CKP ).
the student profile. The tag set contains student dy- Formally, the SSP between a given student s and course
namic learning status and behavioral preferences in c can be represented as a path set Ps = {P1s , P2s , . . . , PM
s
}
s
the student profile. We also define a relationship set where PM = {p1 , p2 , . . . , pK } is a path set between two
RS = {have, belong to, get grade, in}. Following the similar students. And M, K denotes the number of sim-ilar students and paths between two students. Similarly,
the paths between courses defined as a path set Pc =
{P1c , P2c , . . . , PNc } where N denotes the number of courses
which related to course c. Thus, we define the path set be-
tween student and course as Ps,c = Ps ∪ Pc . The se-
quences in each path can be detailed as p = [(v1 , n1 , r1 ) → −
(v2 , n2 , r2 ) → − ... → − (vL , nL , < End >)], where vl and
nl separately denote the value and node type of the entity in
path p, rl is the relationship between nl and nl+1 .
In this end, we give a real example to explain how hu-
mans use SSP and CKP to predict students’ performance.
We formalize the paths in figure 1, where student Bob and
student Tom have several same tags in different semesters.
• p1 = [(Bob, Student, have) → − (1, Grind, belong to)
− (T om, Student, get score) →
→ − (P ass, Score, in) → −
Semantic Transformation
(OS, Course, < End >)] −−−−−−−−−−−−−→
Bob had a ”Grind” tag which also belonged to Tom, who
passed theOS, means that Bob and Tom are both excellent
• p2 = [(Bob, Student, get score) → − (P ass, Score, in
) →− (DS, Course, prerequisite) → − (OS, Course, <
Semantic Transformation
End >)] −−−−−−−−−−−−−→
Bob passed the DS, which is the OS’s prerequisite course,
so maybe Bob can still perform well in the OS.
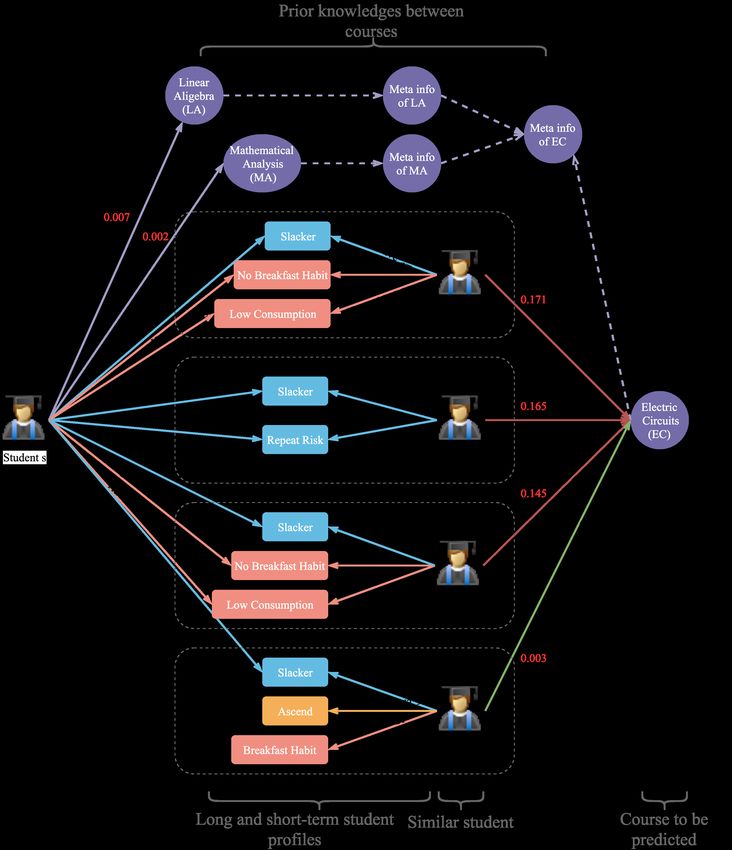
Figure 3: The student path encoder with personalized atten-
Based on the principle of collaborative filtering that simi-
tion.
lar students will get similar achievements. We have reasons
to infer that Bob will pass the OS because most of the similar
students have passed and is good at the prerequisite course
of the OS.
b∗ ∈ RDh are the weight parameters in LSTM. Particularly,
Modeling process of ESPA σ(·) is the sigmoid activation function and stands for the
Path Encoder In order to measure the similarity between element-wise product of two vectors.
two students, we propose the path encoder shown in figure The traditional LSTM model learns each step represented
3 to integrate information for all paths in SSP . We lever- by a single direction network and connot utilize the contex-
age typical Long Short-term Memory (LSTM) network to tual information from the future step during the training pro-
learn the semantic representations of each path pi from input cessTan, Xiang, and Zhou (2015). Since both head and tail
shown as figure 3. First, we contact the triplet’s embeddings information of the path are significant, we build a BiLSTM-
as input to each step of LSTM et for the path-step t. based network, taking the path sequence in both forward and
et = ev ⊕ en ⊕ er , (1) backward directions. Thus we get the full path semantic in-
3De De
where et ∈ R , ev , en , er ∈ R are the embeddings formation h0n ∈ R2Dh with the concatenation of bidirec-
of entity value, entity type, relationships, and De denotes tional hidden state in the last step.
the dimension of the embedding. In this way, the input of Aforementioned, each student’s academic performance is
each time step contains the information of the nodes and re- various, even in the same living habits. Such we introduce a
lationships. Consequently, ht−1 and et are used to learn the novel personalized attention mechanism to capture this dif-
hidden state of each path-step in path pi , which is defined as ference. Because the SSP contains the embedding of the
the following equations: student ID, we denote the student ID embedding as the query
ft = σ(Wf et + Uf ht−1 + bf ), of the dot-product attention mechanismVaswani et al. (2017)
it = σ(Wi et + Ui ht−1 + bi ), for more efficient parameter updates. We use a dense layer
to learn the local-level student preference query ql as:
ot = σ(Wo et + Uo ht−1 + bo ),
(2)
c˜t = tanh(Wc et + Uc ht−1 + bc ),
ct = ft ct−1 + it c˜t , ql = ReLU (Wl es + bl ), (3)
ht = ot σ(ct ),
where ct ∈ RDh and c˜t ∈ RDh denote the cell state and in- where Wl ∈ R2Dh ×De and bl ∈ R2Dh are parameters, 2Dh
formation transform module, and Dh is the number of hid- is the query size. In this module, each path’s attention weight
den units; ft , it , and ot separately represent the forget, in- is calculated based on the interactions between the local-
put, and output gate. W∗ ∈ RDh ×3De ,U∗ ∈ RDh ×Dh and level query and path representations. We denote the attentionweight of the path i as αi , which formulated as: inner product with two biases first, and then activated by the
sigmoid function, which is formulated as:
T
ql h0
a0i = √ i , M +N
dk X
(4) ŷs,c = σ( αi vi + bs + bc ), (9)
exp(a0i )
αi0 = PK , i
0
j=1 exp(aj )
where bs and bc are learning parameters for each student
where dk = De is used to prevent the dot product from being and course. And M + N is the number of paths set Ps,c for
too large. a given student s and course c.
The output of the path encoder ri is the summation of the
contextual representations of paths weighted by their atten- Model learning
tion score: The loss function of ESPA is the negative log-likelihood of
K
X the observed sequences between student to course. Formally,
ri = αj0 h0j , (5)
for predicting whether student s fail on course c, ŷs,c is the
j=1
predicted result from the model and ys,c is the ground truth.
As for CKP , we use the same encoder to capture the rep- Thus the loss for student performance prediction is defined
resentations of different paths between courses. as:
losspred = −[ys,c log(ŷs,c )+(1−ys,c ) log(1− ŷs,c )] (10)
Predict with Personalized Attention Cause the similar-
ity between students is different, and the impact of related Additional Inference Task
courses on the course to be predicted is also different. Thus,
we apply the personalized attention mechanism to each path To ensure that the cosine distances of similar students’ em-
encoder’s output. The global-level attention query qg for the beddings can be updated to closer, we design a subtask for
output from each path encoder still learned from a dense better parameter learning inspired by prior works Lian et
layer: al. (2016); Zhang et al. (2017); Yao et al. (2019). We uti-
qg = ReLU (Wg es + bg ), (6) lize a shallow neural network to predict each similar student
Student1..M in Ps for a given student s. Thus, we get bet-
where Wl ∈ R2Dh ×De and bl ∈ R2Dh are parameters, 2Dh ter student representations to assist the main task. The pre-
is the dimention of global-level attention query. This query diction process is as follows:
qg represents sutdent’s long-term learning status.
For global-level attention, the attention weight of each P (sj |s) = sof tmax(Ws es + bs ) (11)
representation ri is formulated as: 0 0
where Ws ∈ RS ×De and bs ∈ RS are the weight parame-
βi qg rT ters and bias of the layer respectively. And P (sj |s) denotes
ai = √ i , the posterior probability that sj is a similar student of stu-
dk
(7) dent s. To this end, the loss function of the subtask and the
exp(ai ) integrated loss function of our model is defined as:
αi = PM +N ,
j=1 exp(aj ) 0
M X
X S
0
where βi denotes that there are different weights for SSP lossinf e = − ys,c,j log(P (sj |s)) (12)
and CKP . i=1 j=1
As for the prediction, we use the embedding of grade tag
e0i (right part in the figure 2), corresponding to each ri , as 1 X
N
a value for the global-level attention mechanism. Note that L= (losspred + λlossinf e ) (13)
e0i may equal to ev cause the grade tag is also included in N n=1
SSP and CKP . Therefore the model learns better grade
representation. where S 0 and M are the total numbers of students and the
number of similar students of student s, separately. N is the
0
vi = tanh(Wv e0i + bv ), (8) number of samples. ys,c,j denotes whether sj is a similar
student of s. And λ controls the trade-off between the per-
where Wv ∈ R1×De is the projection weight for vi ∈ R. formance prediction loss and the subtask loss.
We notice that the average score for each course was
different due to human factors (such as teachers’ scoring Experiments
habits). At the same time, each student has a different aver-
age score because of different learning foundations. Follow- In this section, we conduct extensive experiments to demon-
ing the prior work of Koren (2008), we leverage two biases strate ESPA’s effectiveness from these two aspects: (1)
0
to represent these two cases separately. The probability ŷs,c the prediction performance of ESPA against the baselines;
of the student s may fail in the course c is calculated by the (2)the explainability of the model throughout the case study.description tags period to one path between them. In the end, the average number of
Based on the upper and lower Grind, Ordi- long paths between two similar students is five.
quartiles of a student’s overall nary, Slacker term
academic performance. Experimental Settings
An overall student failing based None, Few, long Evaluation Metrics We adopted these evaluation proto-
on the number of the courses Repeat Risk, term cols to evaluate the performance of predicting student per-
they failed. Drop out Risk formance, give by:
Changes in student rankings in Ascend, short • precision refers to the closeness of the measurements to
different semesters reflect stu- Descend term a specific value. It is used to measure the correct number
dents’ learning status trends. of predicted samples.
Different semesters’ dining Dietary, Reg- short
• recall also known as sensitivity, which is the fraction of
habits data reveals a healthy ular, Irregular term
the total amount of relevant retrieved instances.
diet benefits academic develop-
ment. • f1-score considers both the precision and the recall, which
Based on the number of break- Breakfast short is the harmonic mean of precision and recall.
fasts each month, breakfast af- Habit, No term • AUC tells how much the model is capable of distinguish-
fects student learning status typ- Breakfast ing between classes. The larger the value of AUC, the bet-
ically. Habit ter the effect of the model.
Sleep time approximately cal- Sleep Late, short
culated from campus gateway Sleep on term Baselines We compared ESPA with SVD++ Koren
data. Time (2008), NCF He et al. (2017), KPRN Wang et al. (2019),
Consumption situation based on Low, Nor- short XGboost, DeepFM Guo et al. (2017), xDeepFM Lian et al.
the upper and lower quartiles of mal, High term (2018), AutoInt Song et al. (2019). As introduced and dis-
students’ consumption. Consumption cussed prior, these models are related to our task, and some
are state-of-the-art methods. The aforementioned works
Table 1: The tags in the student profile (e.g., CritNet Kim, Vizitei, and Ganapathi (2018b,a), EKT
Liu et al. (2019)) only considered the students’ exercises.
However, we are only concerned about the influence of stu-
Experimental Dataset dent behavior and relationships between courses on perfor-
We applied for students’ learning and behavior data from mance. Due to different data formats, the related compar-
the Information Department of a college due to the lack of isons will not be conducted.
a multi-source public dataset to model the long short-term
student profile. Observed school card information starts in Parameter Settings During the training process, the or-
Spring 2015 and continues until Fall 2018. We filtered stu- thogonal matrics were used to initialize the LSTM and
dents from grades 2013 to 2016 from three majors, where Xavier normalization to initialize all linear layer’s weight
there are 2,409 students. During this period, these students parameters. We optimized all parameters with Adam
had taken 590 unique courses, 126,454 score records, and Kingma and Ba (2015) and used the grid search strategy
4,628,802 card records (e.g., canteen consumption, bathing, to find out the best sets of hyperparameters. The learning
shopping). rate was searched in {0.02, 0.01, 0.001, 0.0001}, and batch
Students were modeled by analyzing student card data size in {128, 256, 512 ,1024}. Other hyperparameters are as
with data mining methods. We analyzed the student’s learn- follows: the embedding size of students, courses, tags, and
ing status and behavioral habits in each semester and the its values was 16, considering the total number of entities.
whole semesters. The tags in the student profile are shown Moreover, the hidden size of BiLSTM was 12. We founded
in table 1. We also crawled the course information from a that setting the type weight β of SSP higher yielded bet-
MOOC website to build the coursess knowledge graph. In ter results. βs : βc = 0.7 : 0.3 is the best, which shows
the end, we integrated the student profile, necessary infor- that behavior has a greater impact on student performance.
mation (e.g., statistical information, academic information), Furthermore, we set the trade-off parameter λ as 1 in our
and course knowledge into the KG. experiments.
Path Selection Performance Comparison
The number of nodes in the KG is 9,755, which generated Student Performance Prediction To simulate the real sit-
569,738 relationships. Thus, it is infeasible to fully explor- uation, we filtered all data in Fall 2018, which belongs to
ing all connected paths over the KG. As pointed out by Sun grade 2016 students in a major, to construct the testing set
et al. (2011), paths with length greater than six will intro- and rest data for constructing the training set. Such a division
duce noisy entities. After analyzed the average length of the method can prevent the problem of information leakage dur-
student-course pairs, we used a specific pattern to sample the ing the training process. We fed the original statistical data
paths in the KG, each with a length up to five. For a student used to construct the KG to other competitors. For a fair
s, we filtered out 60 similar students with more than or equal comparison, we trained our model without any pre-trainedMethod Target Precision Recall F1- AUC
score
0 (pass) 0.94 0.98 0.96
SVD++ 0.76
1 (fail) 0.52 0.19 0.28
0 (pass) 0.96 0.80 0.87
NCF 0.81
1 (fail) 0.23 0.66 0.34
0 (pass) 0.97 0.84 0.90
KPRN 0.83
1 (fail) 0.26 0.67 0.39
0 (pass) 0.98 0.86 0.92
KPRN+ 0.85
1 (fail) 0.30 0.72 0.42
0 (pass) 0.98 0.84 0.90
XGboost 0.83
1 (fail) 0.37 0.83 0.51
0 (pass) 0.97 0.79 0.87
DeepFM 0.77
1 (fail) 0.23 0.75 0.36 Figure 4: The effectiveness of the personalized attention net-
0 (pass) 0.96 0.81 0.88 work.
xDeepFM 0.74
1 (fail) 0.23 0.66 0.35
0 (pass) 0.97 0.84 0.90
AutoInt 0.79
1 (fail) 0.25 0.70 0.37 Third, compared to KPRN, our approach is more suitable
0 (pass) 0.98 0.90 0.94 for users with many connections between them (e.g., col-
ESPA 0.93
1 (fail) 0.42 0.87 0.57 lege student profile). KPRN uses each path between items
0 (pass) 0.98 0.90 0.93 to learn users’ preferences and other representations. How-
w/o biases 0.91
1 (fail) 0.39 0.75 0.51 ever, we focus on the similarity between the two students
0 (pass) 0.97 0.89 0.93 or courses in higher education. By studying multiple paths
w/o subtask 0.90
1 (fail) 0.37 0.74 0.49 between students and combining the local- and global- level
attention mechanisms, we got state-of-the-art results.
Table 2: Comparison results on the test set using the preci- Finally, we evaluated the effectiveness of student and
sion, recall and f1-score. course biases and the subtask shown in table 2. We found
that these two biases can improve model performance but
are not decisive. Therefore, they do not significantly affect
embeddings. We also did grid searches for the baseline algo- the explainability of the results. Also, we found that the sub-
rithms to ensure that each baseline achieves state-of-the-art task can help the model learn the student representations in
performance. the direction we expect.
Furthermore, we replaced the pooling layer with a dot-
product attention network in KPRN and denoted it as Ablation Experiment In this section, we conducted sev-
KPRN+, which is not implied in the paper. It is worth noting eral experiments to explore the personalized attention mech-
that the label shows a significant imbalance, where the num- anism’s effectiveness in our approach. We replaced person-
ber of fail records is much less. We had balanced data for all alized attention with weighted sum pooling. According to
the methods, such as downsampling, weighted loss function. figure 4, we have several observations.
Table 2 reports our experimental results. It is worth focus- First, local-level personalized attention can effectively
ing on the effects of each method to predict failure grades. improve the performance of our approach. It is because paths
Moreover, our model achieved state-of-the-art performance are basic units to convey information about students’ be-
as for recall, f1-score, and AUC in all methods. According havior and performance. Moreover, selecting the remarkable
to the results, We have several observations. paths according to student preferences is useful for learning
First, the deep methods (e.g., NCF, KPRN, and ESPA) more informative paths representations when predicting per-
outperform traditional matrix factorization. That is because formance.
neural networks can learn more sophisticated features than Second, global-level personalized attention can also im-
SVD++, which helps learn more informative latent factors prove the performance of our model. Cause representations
of entities and relationships. of similar students and courses usually have different infor-
Second, it shows that the deep learning methods using mativeness for learning student representations. Recogniz-
attention mechanism (KPRN+, ESPA) outperform most of ing the critical students and course is significant for learning
the methods without attention mechanism (KPRN, DeepFM, high-quality student representations and predicting.
xDeepFM). This phenomenon is because different student
preferences and courses have different informativeness for Case Study
student performance. It is difficult for a neural network with- To improve the confidence of our model, we explored the
out an attention mechanism to capture this personalized dif- explainability of the predicted results. We randomly selected
ference. Furthermore, the result also shows that it is worth- a student-course pair Ps,c for evaluating. The local-level and
while to model the student profile and course knowledge the global-level attention score of the student s are shown in
graph explicitly. figure 5.Figure 5: Illustrate the attention distribution for paths within
a given student-course pair.
Our model correctly predicted that the student s would
fail in Electric Circuits (EC). It can be seen intuitively from
figure 5 that most of the students who are similar to student
s are failed in the EC. Throughout the global-level atten-
tion scores, we found that most students with high attention Figure 6: A case study of highest attention paths in knowl-
scores failed the exam. Which is the main reason that model edge graph.
predicted student s might fail in the EC. It is worth noting
why the attention scores of student b,e,i, who either failed
in the course, are lower. Because of the personalized atten- model results.
tion mechanism, the model learned that student b,e,i were
not similar to the student s. For example, there is only one Conclusions
path between student e and student s.
Then we explored the relationships between student s and In this paper, we mapped the student performance predic-
students with high attention scores. It can be concluded from tion problem in education to the recommendation system.
figure 6 that the student s’s life was irregular throughout the The ESPA model captures the semantic information of the
course, while students with similar habits either failed in the paths between students and courses in the knowledge graph.
course. Hence, the model predicted that the student’s failure Besides, our model achieves state-of-the-art results and has
was reasonable. From the student profile, we can intuitively explainability under our designed attention mechanism. We
understand why student h’s attention score is much lower did not emphasize the student profile’s construction method
than others. Although student h also had a Slacker tag, the because various tags can be added to student profiles in prac-
student h had some more active tags such as Ascend, Break- tical applications. Simultaneously, based on this method, we
fast habit. These tags’ information was not modeled in the can also add the relationships between teachers and courses.
paths between student s and student h explicitly, but such In the future, we will extend our work in these directions.
information was updated to the embedding of student h dur- First, we found that the real environment data is exception-
ing the entire model training process. We believe the model ally imbalanced, where the number of students passing the
could understand the representations of students, tags, and course is far more than that of the students who fail. How-
courses in the paths for decisions. ever, most of the studies have ignored this problem. Thus, we
expect to use methods similar to anomaly detection for pre-
When we apply the model to the real scenario, educators dicting failure results. We would also like to build up more
are more concerned about which behaviors affected student accurate and timely modeling of students for efficient path
performance rather than attention scores. Thus we will high- representation. Meanwhile, we willing attempt to perform a
light essential tags based on attention scores, such as No holistic analysis of the student-student-course using an im-
Breakfast habit, Low Consumption. At the same time, we proved RNN structure or a graph neural network.
will show them student profiles of similar students, such as
figure 6. Educators can utilize the above information to inter-
vene in students in advance and improve their living habits Acknowledgments
and grades. Simultaneously, educators can intuitively see the This work is supported by the National Key Research
basis of model inferring, thereby increasing confidence in and Development Program of China (2016YFE0204500),The work was supported by the National Natural Science prediction. In Sierra, C., ed., Proceedings of the Twenty-
Founda- tion of China (Grant No.61971066) and the Beijing Sixth International Joint Conference on Artificial Intelli-
Natural Science Foundation (No. L182038), the Fundamen- gence, IJCAI 2017, Melbourne, Australia, August 19-25,
tal Research Funds for the Central Universities and Beijing 2017, 1725–1731. ijcai.org.
University of Posts and Telecommunications 2017 Educa-
He, X.; Liao, L.; Zhang, H.; Nie, L.; Hu, X.; and Chua, T.
tion and Teaching Reform Project No.2017JY31.
2017. Neural collaborative filtering. In Barrett, R.; Cum-
mings, R.; Agichtein, E.; and Gabrilovich, E., eds., Pro-
References ceedings of the 26th International Conference on World
Abdelrahman, G., and Wang, Q. 2019. Knowledge trac- Wide Web, WWW 2017, Perth, Australia, April 3-7, 2017,
ing with sequential key-value memory networks. In Pi- 173–182. ACM.
wowarski, B.; Chevalier, M.; Gaussier, É.; Maarek, Y.; Huang, J.; Zhao, W. X.; Dou, H.; Wen, J.; and Chang,
Nie, J.; and Scholer, F., eds., Proceedings of the 42nd In- E. Y. 2018. Improving sequential recommendation
ternational ACM SIGIR Conference on Research and De- with knowledge-enhanced memory networks. In Collins-
velopment in Information Retrieval, SIGIR 2019, Paris, Thompson, K.; Mei, Q.; Davison, B. D.; Liu, Y.; and Yil-
France, July 21-25, 2019, 175–184. ACM. maz, E., eds., The 41st International ACM SIGIR Con-
Ai, F.; Chen, Y.; Guo, Y.; Zhao, Y.; Wang, Z.; Fu, G.; and ference on Research & Development in Information Re-
Wang, G. 2019. Concept-aware deep knowledge trac- trieval, SIGIR 2018, Ann Arbor, MI, USA, July 08-12,
ing and exercise recommendation in an online learning 2018, 505–514. ACM.
system. In Desmarais, M. C.; Lynch, C. F.; Merceron, Kim, B.; Vizitei, E.; and Ganapathi, V. 2018a. Gritnet
A.; and Nkambou, R., eds., Proceedings of the 12th Inter- 2: Real-time student performance prediction with domain
national Conference on Educational Data Mining, EDM adaptation. CoRR abs/1809.06686.
2019, Montréal, Canada, July 2-5, 2019. International
Educational Data Mining Society (IEDMS). Kim, B.; Vizitei, E.; and Ganapathi, V. 2018b. Gritnet: Stu-
dent performance prediction with deep learning. In Boyer,
Bydzovská, H. 2015. Are collaborative filtering methods K. E., and Yudelson, M., eds., Proceedings of the 11th
suitable for student performance prediction? In Pereira, International Conference on Educational Data Mining,
F. C.; Machado, P.; Costa, E.; and Cardoso, A., eds., EDM 2018, Buffalo, NY, USA, July 15-18, 2018. Inter-
Progress in Artificial Intelligence - 17th Portuguese Con- national Educational Data Mining Society (IEDMS).
ference on Artificial Intelligence, EPIA 2015, Coimbra,
Portugal, September 8-11, 2015. Proceedings, volume Kingma, D. P., and Ba, J. 2015. Adam: A method for
9273 of Lecture Notes in Computer Science, 425–430. stochastic optimization. In Bengio, Y., and LeCun, Y.,
Springer. eds., 3rd International Conference on Learning Represen-
tations, ICLR 2015, San Diego, CA, USA, May 7-9, 2015,
Catherine, R.; Mazaitis, K.; Eskénazi, M.; and Cohen, W. W. Conference Track Proceedings.
2017. Explainable entity-based recommendations with
knowledge graphs. In Tikk, D., and Pu, P., eds., Proceed- Koren, Y. 2008. Factorization meets the neighborhood: a
ings of the Poster Track of the 11th ACM Conference on multifaceted collaborative filtering model. In Li, Y.; Liu,
Recommender Systems (RecSys 2017), Como, Italy, Au- B.; and Sarawagi, S., eds., Proceedings of the 14th ACM
gust 28, 2017, volume 1905 of CEUR Workshop Proceed- SIGKDD International Conference on Knowledge Dis-
ings. CEUR-WS.org. covery and Data Mining, Las Vegas, Nevada, USA, August
24-27, 2008, 426–434. ACM.
Chaudhari, S.; Azaria, A.; and Mitchell, T. M. 2017. An
Lian, D.; Ye, Y.; Zhu, W.; Liu, Q.; Xie, X.; and Xiong,
entity graph based recommender system. AI Commun.
H. 2016. Mutual reinforcement of academic perfor-
30(2):141–149.
mance prediction and library book recommendation. In
Dascalu, M.; Popescu, E.; Becheru, A.; Crossley, S. A.; and Bonchi, F.; Domingo-Ferrer, J.; Baeza-Yates, R.; Zhou,
Trausan-Matu, S. 2016. Predicting academic perfor- Z.; and Wu, X., eds., IEEE 16th International Conference
mance based on students’ blog and microblog posts. In on Data Mining, ICDM 2016, December 12-15, 2016,
Verbert, K.; Sharples, M.; and Klobucar, T., eds., Adap- Barcelona, Spain, 1023–1028. IEEE Computer Society.
tive and Adaptable Learning - 11th European Confer-
Lian, J.; Zhou, X.; Zhang, F.; Chen, Z.; Xie, X.; and Sun,
ence on Technology Enhanced Learning, EC-TEL 2016,
G. 2018. xdeepfm: Combining explicit and implicit
Lyon, France, September 13-16, 2016, Proceedings, vol-
feature interactions for recommender systems. In Guo,
ume 9891 of Lecture Notes in Computer Science, 370–
Y., and Farooq, F., eds., Proceedings of the 24th ACM
376. Springer.
SIGKDD International Conference on Knowledge Dis-
Dutt, A.; Ismail, M. A.; and Herawan, T. 2017. A sys- covery & Data Mining, KDD 2018, London, UK, August
tematic review on educational data mining. IEEE Access 19-23, 2018, 1754–1763. ACM.
5:15991–16005.
Liu, Q.; Huang, Z.; Yin, Y.; Chen, E.; Xiong, H.; Su, Y.; and
Guo, H.; Tang, R.; Ye, Y.; Li, Z.; and He, X. 2017. Deepfm: Hu, G. 2019. EKT: exercise-aware knowledge tracing for
A factorization-machine based neural network for CTR student performance prediction. CoRR abs/1906.05658.Liu, Y.; Yang, Y.; Chen, X.; Shen, J.; Zhang, H.; and Yu, Y. of the 1st Workshop on Recommender Systems for Tech-
2020. Improving knowledge tracing via pre-training ques- nology Enhanced Learning, RecSysTEL 2010, Barcelona,
tion embeddings. In Bessiere, C., ed., Proceedings of the Spain, September 29-30, 2010, volume 1 of Procedia
Twenty-Ninth International Joint Conference on Artificial Computer Science, 2811–2819. Elsevier.
Intelligence, IJCAI 2020, 1577–1583. ijcai.org.
Vaswani, A.; Shazeer, N.; Parmar, N.; Uszkoreit, J.; Jones,
Luo, J.; Sorour, S. E.; Mine, T.; and Goda, K. 2015. Pre- L.; Gomez, A. N.; Kaiser, L.; and Polosukhin, I. 2017.
dicting student grade based on free-style comments using Attention is all you need. In Guyon, I.; von Luxburg, U.;
word2vec and ANN by considering prediction results ob- Bengio, S.; Wallach, H. M.; Fergus, R.; Vishwanathan, S.
tained in consecutive lessons. In Santos, O. C.; Boticario, V. N.; and Garnett, R., eds., Advances in Neural Informa-
J.; Romero, C.; Pechenizkiy, M.; Merceron, A.; Mitros, P.; tion Processing Systems 30: Annual Conference on Neu-
Luna, J. M.; Mihaescu, M. C.; Moreno, P.; Hershkovitz, ral Information Processing Systems 2017, 4-9 December
A.; Ventura, S.; and Desmarais, M. C., eds., Proceedings 2017, Long Beach, CA, USA, 5998–6008.
of the 8th International Conference on Educational Data
Mining, EDM 2015, Madrid, Spain, June 26-29, 2015, Vie, J., and Kashima, H. 2019. Knowledge tracing ma-
396–399. International Educational Data Mining Society chines: Factorization machines for knowledge tracing. In
(IEDMS). The Thirty-Third AAAI Conference on Artificial Intelli-
gence, AAAI 2019, The Thirty-First Innovative Applica-
Song, W.; Shi, C.; Xiao, Z.; Duan, Z.; Xu, Y.; Zhang, M.; tions of Artificial Intelligence Conference, IAAI 2019, The
and Tang, J. 2019. Autoint: Automatic feature interac- Ninth AAAI Symposium on Educational Advances in Ar-
tion learning via self-attentive neural networks. In Zhu, tificial Intelligence, EAAI 2019, Honolulu, Hawaii, USA,
W.; Tao, D.; Cheng, X.; Cui, P.; Rundensteiner, E. A.; January 27 - February 1, 2019, 750–757. AAAI Press.
Carmel, D.; He, Q.; and Yu, J. X., eds., Proceedings
of the 28th ACM International Conference on Informa- Wang, X.; Wang, D.; Xu, C.; He, X.; Cao, Y.; and Chua, T.
tion and Knowledge Management, CIKM 2019, Beijing, 2019. Explainable reasoning over knowledge graphs for
China, November 3-7, 2019, 1161–1170. ACM. recommendation. In The Thirty-Third AAAI Conference
on Artificial Intelligence, AAAI 2019, The Thirty-First
Spector, J. M. 2018. Smart learning futures: a report Innovative Applications of Artificial Intelligence Confer-
from the 3rd us-china smart education conference. Smart ence, IAAI 2019, The Ninth AAAI Symposium on Edu-
Learn. Environ. 5(1):5. cational Advances in Artificial Intelligence, EAAI 2019,
Honolulu, Hawaii, USA, January 27 - February 1, 2019,
Su, Y.; Liu, Q.; Liu, Q.; Huang, Z.; Yin, Y.; Chen, E.; Ding,
5329–5336. AAAI Press.
C. H. Q.; Wei, S.; and Hu, G. 2018. Exercise-enhanced
sequential modeling for student performance prediction. Xian, Y.; Fu, Z.; Muthukrishnan, S.; de Melo, G.; and Zhang,
In McIlraith, S. A., and Weinberger, K. Q., eds., Proceed- Y. 2019. Reinforcement knowledge graph reasoning for
ings of the Thirty-Second AAAI Conference on Artificial explainable recommendation. In Piwowarski, B.; Cheva-
Intelligence, (AAAI-18), the 30th innovative Applications lier, M.; Gaussier, É.; Maarek, Y.; Nie, J.; and Scholer, F.,
of Artificial Intelligence (IAAI-18), and the 8th AAAI Sym- eds., Proceedings of the 42nd International ACM SIGIR
posium on Educational Advances in Artificial Intelligence Conference on Research and Development in Information
(EAAI-18), New Orleans, Louisiana, USA, February 2-7, Retrieval, SIGIR 2019, Paris, France, July 21-25, 2019,
2018, 2435–2443. AAAI Press. 285–294. ACM.
Sun, Y.; Han, J.; Yan, X.; Yu, P. S.; and Wu, T. 2011. Xian, Y.; Fu, Z.; Zhao, H.; Ge, Y.; Chen, X.; Huang, Q.;
Pathsim: Meta path-based top-k similarity search in het- Geng, S.; Qin, Z.; de Melo, G.; Muthukrishnan, S.; and
erogeneous information networks. Proc. VLDB Endow. Zhang, Y. 2020. CAFE: coarse-to-fine neural symbolic
4(11):992–1003. reasoning for explainable recommendation. In d’Aquin,
Sweeney, M.; Lester, J.; Rangwala, H.; and Johri, A. M.; Dietze, S.; Hauff, C.; Curry, E.; and Cudré-Mauroux,
2016. Next-term student performance prediction: A rec- P., eds., CIKM ’20: The 29th ACM International Confer-
ommender systems approach. In Barnes, T.; Chi, M.; ence on Information and Knowledge Management, Vir-
and Feng, M., eds., Proceedings of the 9th International tual Event, Ireland, October 19-23, 2020, 1645–1654.
Conference on Educational Data Mining, EDM 2016, ACM.
Raleigh, North Carolina, USA, June 29 - July 2, 2016, 7. Xing, W.; Guo, R.; Petakovic, E.; and Goggins, S. P. 2015.
International Educational Data Mining Society (IEDMS). Participation-based student final performance prediction
Tan, M.; Xiang, B.; and Zhou, B. 2015. Lstm-based deep model through interpretable genetic programming: Inte-
learning models for non-factoid answer selection. CoRR grating learning analytics, educational data mining and
abs/1511.04108. theory. Comput. Hum. Behav. 47:168–181.
Thai-Nghe, N.; Drumond, L.; Krohn-Grimberghe, A.; and Yao, H.; Lian, D.; Cao, Y.; Wu, Y.; and Zhou, T. 2019.
Schmidt-Thieme, L. 2010. Recommender system for pre- Predicting academic performance for college students: A
dicting student performance. In Manouselis, N.; Drach- campus behavior perspective. ACM Trans. Intell. Syst.
sler, H.; Verbert, K.; and Santos, O. C., eds., Proceedings Technol. 10(3):24:1–24:21.Yeung, C. 2019. Deep-irt: Make deep learning based knowledge tracing explainable using item response the- ory. In Desmarais, M. C.; Lynch, C. F.; Merceron, A.; and Nkambou, R., eds., Proceedings of the 12th Inter- national Conference on Educational Data Mining, EDM 2019, Montréal, Canada, July 2-5, 2019. International Educational Data Mining Society (IEDMS). Zhang, X.; Sun, G.; Pan, Y.; Sun, H.; and Tan, J. 2017. Poor performance discovery of college stu- dents based on behavior pattern. In 2017 IEEE SmartWorld, Ubiquitous Intelligence & Computing, Advanced & Trusted Computed, Scalable Computing & Communications, Cloud & Big Data Computing, Internet of People and Smart City Innovation, Smart- World/SCALCOM/UIC/ATC/CBDCom/IOP/SCI 2017, San Francisco, CA, USA, August 4-8, 2017, 1–8. IEEE. Zhou, Y.; Huang, C.; Hu, Q.; Zhu, J.; and Tang, Y. 2018. Personalized learning full-path recommendation model based on LSTM neural networks. Inf. Sci. 444:135–152.
You can also read