Exit polls and voter turnout in the 2017 French elections - Alberto Grillo Eva Raiber - Aix ...
←
→
Page content transcription
If your browser does not render page correctly, please read the page content below

Working Papers / Documents de travail

Exit polls and voter turnout in the 2017 French elections

                                               Alberto Grillo
                                                  Eva Raiber

                                               WP 2022- Nr 07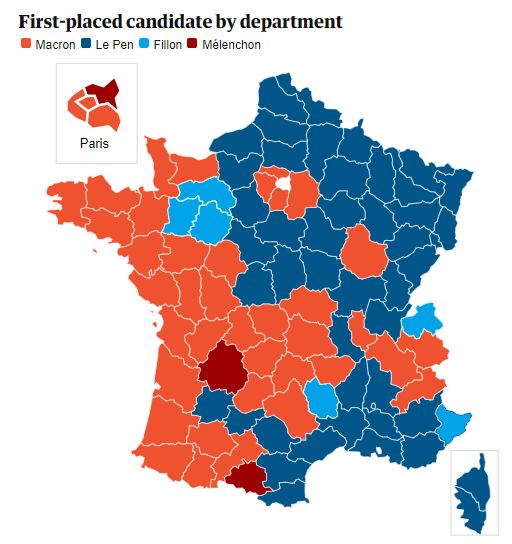
∗
     Exit polls and voter turnout in the 2017 French elections

                                     Alberto Grillo1 and Eva Raiber1

                        1
                            Aix-Marseille University, CNRS, AMSE, Marseille, France

                                                March 15, 2022

                                                      Abstract

           Belgian and Swiss media regularly interfere during French elections by releasing exit polls

      before polling stations close. These foreign media profit from a law forbidding the same behavior

      by their French counterparts to receive large inflows of web visits from France. We exploit the

      unusual timing and degree of confidence with which exit polls were released in the second round

      of the 2017 presidential elections to investigate their effect on voter turnout. Our analysis is based

      on comparing turnout rates at different times on the election day, in the first and second round,

      and with respect to previous elections. We find a significant decrease in turnout of around 3 to 4

      percentage points after the exit polls’ publication which is suggestive of a causal effect, although

      similar trends were observed in previous elections. The effect is stronger in departments close to

      the Belgian border shortly after the release of the exit polls. We do not find clear evidence that

      either candidate benefited from the decrease in turnout, yet we cannot exclude the presence of a

      small underdog effect which reduced the winning margin by around 1 percentage point.

Keywords: Exit polls, voter turnout, underdog effect, bandwagon effect

JEL codes: D72

  ∗ This work has been supported by the French National Research Agency Grants ANR-17-EURE-0020 and by the
Excellence Initiative of Aix-Marseille University A*MIDEX. We are grateful to Julie Lassébie who obtained the data. We
thank Julie Lassébie, Julieta Peveri, and Marc Sangnier for their helpful comments. Eva Raiber is a Research Affiliate
at the Centre for Economic Policy Research (CEPR, London).
1 Introduction
Elections take place under a given degree of uncertainty concerning the outcome. If the uncertainty is
drastically reduced, will citizens still make the effort to vote? We study this question in the context
of the 2017 French presidential elections, by exploiting the early release of exit polls by foreign media.
While in France it is forbidden to publish exit polls before polling stations close, foreign media
do not abide by this law. In particular, Belgian and Swiss francophone media regularly report exit
polls from French elections while voting is still taking place. For tight elections, this information often
comes late and is presented with abundant words of caution concerning its precision. However, the
circumstances of the 2017 second-round elections, with the exit polls pointing to a landslide victory
for Emmanuel Macron1 , allowed these media to disclose the results earlier and with an unusual degree
of confidence. For example, Belgian broadcaster RTBF reported already at 16:00 that, according to
the exit polls in their possession, Macron was clearly ahead and would beat Marine Le Pen with at
least 60% of the votes. The announcement was quickly picked up by many other foreign media, while
polling stations remained open until 19:00 or 20:00.
We use turnout data at 12:00, 17:00 and at end of the day to investigate the effect of this information
shock on voting behavior. Voter turnout at 12:00 is not affected by the exit polls’ release, while turnout
at 17:00 and at end of the day can be. We compare the turnout rates in the second round to those
in the first round of the elections, similarly to a difference-in-differences setting. This assumes that
citizens vote on average at the same time in the first and second round. In our baseline specifications,
we find a significant decrease in turnout with respect to the first round at both 17:00 and at the end of
the day, which ranges between 3.1 and 4.1 percentage points. The effect does not change by controlling
for rainfall and variation in temperature, which could potentially affect the distribution of voting times
between the two rounds.
To validate our results, we compare the trends in turnout to those in the two previous French
presidential elections. In 2012 and 2007, the second-round election was more competitive and foreign
media reported the exit polls with more conservative claims concerning their precision until a later
time in the day. In both years, we observe that the increase in turnout after 12:00 is lower in the second
round than in the first. Nonetheless, the triple-differences estimator is significant with respect to the
2012 elections at both 17:00 and at the end of the day, as well as with respect to the 2007 elections at
1 As also forecasted by most opinion polls, whose average result on the day before the election was 61.79% in fa-
vor of Macron. See for example https://en.wikipedia.org/wiki/Opinion polling for the 2017 French presidential
election
117:00. This suggests that the decrease in turnout in the second round of the 2017 elections is driven
at least in part by the exit polls’ publication.
These results give credit to theories of voting as an act which is, at least partially, strategic and
instrumental, in contrast to theories of voting as a non-strategic decision motivated by civic duty
or by a consumption benefit. A similar decrease in turnout has been found in the US in the 1980
elections, which were called in favor of Reagan while polling stations were still open in the Western
states (Delli Carpini, 1984), as well as in the 2000 elections, when Florida was called in favor of Bush
while polling stations were still open in the Panhandle counties (Lott, 2005). The results are also
in line with Morton et al. (2015), who show that in the French overseas territories, before the 2005
electoral reform, voting after exit polls from the mainland had been published decreased turnout by
11 percentage points.
We complement the analysis by checking whether the effect varies geographically or as a function
of the preferences expressed in the first round of the election. With respect to geography, the decrease
in turnout at 17:00 is stronger for departments that are closer to Belgium, as measured by the distance
from the department’s capital to Brussels or to the border. The effect at the end of the day goes in
the same direction but it is not statistically significant, a result which could be due to the exit polls
being transmitted earlier (i.e. between 16:00 and 17:00) in departments that are closer to Belgium.
We do not observe different effects in departments close to the border with Switzerland, compared to
all other departments.
Concerning differences in voters’ preferences, we observe a greater decrease in turnout following the
information shock in departments in which Macron was the most voted candidate in the first round,
compared to departments in which he was not. The effect corresponds to an additional reduction
of 1.1 percentage points and is weakly significant (p-value: 0.099). On the contrary, the decrease in
turnout is not different in departments in which Le Pen was the most voted candidate in the first
round, compared to departments in which she was not.
We then looked at departments in which the vote share for the other candidates in the first round
was relatively higher. Specifically, given the ideological positions of Macron and Le Pen, left-wing
voters could be more tempted by abstention after the exit polls’ release, in order to avoid voting for
a weakly preferred candidate. We observe indeed that departments with the 50% highest combined
share of votes for Benoı̂t Hamon and Jean-Luc Mélenchon - the two major left-wing candidates - have
a stronger decrease in turnout. As before, the effect corresponds to a 1.1 percentage points reduction.
2Yet, though close to the 10% level, the coefficient is insignificant at conventional levels (p-value: 0.113).
The analysis with respect to the results in the first round informs the debate about the diffusion
of opinion polls in the last days of the electoral campaign, as well as that on the early release of
exit polls. The standard rationale for banning their publication is that it could alter the election
results by affecting asymmetrically the voters of different candidates. Researchers typically distinguish
between an underdog or a bandwagon effect, depending on whether the publication of polls give
an advantage to the trailing (underdog effect) or to the leading candidate (bandwagon effect). The
empirical identification of a causal effect with real elections data is challenging, because voting is secret
and because these effects could be driven not only by changes in turnout rates but also by changes in
the vote choice.
The literature has traditionally found mixed evidence (see the discussions in Marsh, 1985; McAl-
lister & Studlar, 1991; and Irwin & Van Holsteyn, 2000), confirmed recently by findings of both
bandwagons (Hodgson & Maloney, 2013; Kiss & Simonovits, 2014; Morton et al., 2015) and underdog
effects (Chatterjee & Kamal, 2021).2 Based on our results and under the assumption that left-wing
voters in the 2017 French elections preferred on average Macron to Le Pen, we cannot exclude a mild
underdog effect, according to which Macron’s margin of victory could have been slightly higher in the
absence of the information shock.
2 Context
The 2017 French presidential elections took place on April 23 and May 7 2017. Because none of the
11 candidates won an absolute majority in the first round, a second round was held between the two
top candidates, Emmanuel Macron (who had obtained 24% of the votes) and Marine Le Pen (21.3%).
Three other candidates received more than 5% of the votes in the first round, namely François Fillon
(20%), Jean-Luc Mélenchon (19.6%), and Benoı̂t Hamon (6.4%). In both rounds, polling stations
closed at 20:00 in big cities and nearby municipalities, while at 19:00 elsewhere.
While French polling agencies collect regular exit polls data on election days, the law requires French
media to not publish them before 20:00. Foreign media do not abide by this rule, and francophone
media in Belgium and Switzerland report exit polls along the day, registering a large increase in their
2 These unconclusive results are echoed by the mixed findings in the experimental literature (Levine & Palfrey, 2007;
Großer & Schram, 2010; Morton & Ou, 2015) as well as by theoretical work highlighting potential drivers of both effects
(Herrera et al., 2016; Grillo, 2017). These contributions also clarify that the empirical observation of a null or weak total
effect might be due to different effects offsetting each other rather than to the absence of any effect.
3websites’ visits from France. Our empirical analysis relies on the timing and the degree of confidence
with which exit polls were unusually released in the second round of the 2017 elections. Foreign media
typically wait for a reasonable degree of confidence before publishing the first exit polls and present
them with abundant words of caution if the predicted advantage is not large. As an example, in the
first round of the 2017 election, Belgian broadcaster RTBF predicted early in the day that Macron
would win a relative majority but waited until around 19:00 to predict that Le Pen was going to be
the other candidate qualified to the second round. In the second round, instead, although mentioning
that voting was still ongoing, RTBF reported already at around 16:00 that Macron was predicted to
win with at least 60% of the votes, and updated his vote share to 62%-64% at around 16:20.
Other Belgian and Swiss media published similar results at the same time or slightly later, and
the news spread quickly to media in other foreign countries as well as on social networks like Twitter.
This information shock, which showed an even bigger margin of victory than the one forecasted by
most opinion polls in the previous days, could change citizens’ motivation to vote later in the day, in
an election that appeared to be already decided.3
3 Data and empirical strategy
Our dataset contains turnout rates, election results for each candidate, and the number of registered
voter at the department level in 2017, 2012 and 2007, obtained from the French interior ministry. Voter
turnout is measured at 12:00, 17:00 and when polling stations closed. We merged these data with
weather information for both rounds of the 2017 elections, by collecting daily rainfall and maximum
temperature in each department’s capital.4
Our baseline specification compares turnout rates before (at 12:00) and after (at 17:00 and at the
closing time) the information shock with respect to the first round in the 2017 elections. As in a
difference-in-differences setting, we use turnout rates at 12:00 as the pre-period and turnout rates at
17:00 and at the closing time as post-periods, with the first round as the “control group”. This assumes
3 Figure 2 in the online appendix gives a sketch of the information release at different times. The exit polls data
mentioned by the foreign media are not public information and cannot be independently verified, since they came
from French poll agencies, which were subject to the legal ban. The concerned foreign media, however, did pub-
licly defend their sources as reliable, and the data turned out to be correct ex-post in both rounds of the 2017
elections. In our reading of online information, RTBF took a major role in diffusing the exit polls early and in
defending this choice, with both the editor-in-chief and the director of information arguing publicly for the gen-
eral interest of this information, see for example https://www.rtbf.be/info/monde/detail presidentielle-francaise
-pourquoi-la-rtbf-diffuse-t-elle-les-estimations-de-resultats?id=9587877 and http://www.slate.fr/story/
144044/presidentielle-francaise-jackpot-belge.
4 Table 5 in the online appendix presents a few summary statistics of our data.
4that, if the exit polls had not been released, voter turnout would have followed the same trend as in
the first round. Our baseline estimation is therefore:
turnoutt,r,d = β1 timet + β2 roundr + β3 timet × roundr + t,r,d (1)
where turnoutt,r,d measures turnout at time t in round r in department d, timet is the indicator for
the post-periods, and roundr is the indicator for the second round. Standard errors are clustered at
the department level and departments are weighted by the number of registered voters. The coefficient
of interest is β3 .
It is however possible that different trends in voting times would have emerged between the two
rounds even absent the information shock from foreign media. Figure 1 plots the aggregate turnout
rates in the 2007, 2012, and 2017 elections. Unlike in 2017, both in 2007 and in 2012 voter turnout
was higher in the second round than in the first. In all three elections, the increase in turnout from
12:00 to 17:00 and to the end of the day appears smaller in the second round than in the first round.
In both 2012 and 2007, however, given the much tighter competition between the two second-round
candidates, foreign media published exit polls with smaller margins of victory and used a more agnostic
language concerning their precision until a later time.5
(a) 2007 Presidential Election (b) 2012 Presidential Election (c) 2017 Presidential Election
Figure 1: Voter turnout at different times of the day in the first and the second round of the French
presidential elections.
5 For example, in 2012 Belgian broadcaster RTBF reported at around 17:20 a predicted vote share of 52%-53% for
Hollande against Sarkozy, mentioning the possibility of change. Also, note that polling stations elsewhere than in big
cities closed at 18:30 in 2012 and at 18:00 in 2007, while at 19:00 in 2017.
5To isolate the effect of the early release of exit polls, we compare the results in 2017 to those in
2012 and 2007 in a triple-differences setting. This analysis assumes that, absent the information shock
in 2017, the difference in turnout trends would have been the same as in the two previous elections.
Our second estimation is thus:
turnouty,t,r,d = β1 timet + β2 roundr + β3 yeary + β4 timest × roundr + β5timet × yeary +
(2)
β6 roundr × yeary + β7 timet × roundr × yeary + y,t,r,d
where turnouty,t,r,d measures turnout in year y at time t in round r in department d, and yeary is the
indicator for the year 2017. The coefficients of interest are β4 for the presence of a similar trend in
previous elections and β7 for the triple-differences estimation.
4 Results
Table 1 shows the results of our baseline analysis. We observe a significant decrease in voter turnout
with respect to the first round, following the exit polls’ publication. The estimates of the effect are
between a 3.4 and 4.1 percentage points reduction in turnout at 17:00 and between a 3.1 and 3.7
percentage points reduction in turnout at the end of the day, depending on the specification. We find
that the result does not hinge on weighing departments by the number of registered voters (column 2).
The results are also robust to controlling for rain and maximal temperature at the department level
(column 3), and hold if we only include departments in which it did not rain (column 4).6
In table 2, we compare turnout trends with those in the previous elections. The significant negative
coefficients for the interaction between time and round of the election confirm the graphical evidence
in Figure 1 of a similar trend in the two previous elections. The coefficients of the triple interaction
are however also significant, both at 17:00 and at the end of the day for the 2012 election as well as
at 17:00 for the 2007 election. This suggests that despite the similar trend in voting times in previous
elections, the information shock contributed to the decrease in turnout from the first to the second
round of the 2017 elections. Specifically, with respect to the 2012 elections, the results show that the
exit polls’ release is associated to an additional decrease in turnout of 2.8 percentage points at 17:00
and of 1.7 percentage points at end of the day.
6 We report the coefficients of all the weather controls in Table 6 in the online appendix as well as the comparison
between departments where it never rained and those where it rained (which is insignificant). We note that on the day
of the first round elections it rained (lightly) only in one department’s capital; hence all raining variation comes from
the second-round elections.
65 Heterogeneous Effects
In this section, we investigate possible heterogeneous effects along two dimensions, namely geography
and the preferences expressed in the first round of the elections. We first examine whether the decrease
in turnout is stronger in departments that are closer to the borders with Belgium and Switzerland, the
two countries with francophone media which regularly publish exit polls during the election day. The
rationale is that voters in departments closer to either country might more likely be aware of the exit
polls’ release. Moreover, some foreign media like RTBF have a radio station whose signal is received in
the French departments that are close to the border. Some voters in these departments could therefore
be reached in addition to those who actively look for the information online.
Table 3 shows the results of this analysis. For either border, we distinguish between a first set
of very close departments and a second larger set of close ones. These include the 4 and 7 closest
departments to either Belgium or Switzerland, respectively.7 Columns 1 and 2 in Table 3 show a
significantly greater decrease in participation for the departments close and very close to Belgium,
while columns 3 and 4 show that departments close and very close to Switzerland do not significantly
differ from all the others. For the Belgian border, the coefficients of interest are negative for turnout
measured both at 17:00 and at the end of the day, although only the one at 17:00 is statistically
significant. Their magnitude varies between -1.3 and -2.1 percentage points. One possible line of
interpretation for the effect being significant only at 17:00 is that the information shock spread earlier
to departments who are closer to Belgium, and then more homogeneously to the whole country by the
end of the day.
As a second exercise, we investigate the presence of heterogeneous effects with respect to the
preferences expressed in the first round of the elections. This analysis points to the main concern
of the early release of exit polls, namely that its effect on turnout could be biased in favor of one
candidate and therefore alter the representation of the electorate’s preferences. Table 4 reports the
results. Column 1 shows that, by the end of the day, the decrease in turnout with respect to the first
round was greater in departments in which Macron had won a relative majority in the first round, as
compared to all other departments. With a p-value of 0.099, this effect is significant at the 10% level.
Its magnitude corresponds to an additional decrease of 1.1 percentage points in turnout. Column 2
shows instead the absence of heterogeneous effects when we compare departments in which Le Pen
7 Figure 3 in the online appendix shows these departments on a map.
7had won a relative majority in the first round with all the others.8
We then look at whether the decrease in turnout was stronger in departments in which many voters
did not support any of the two second-round candidates. Specifically, given the ideological positions
of Macron and Le Pen, voters with left-wing preferences could be more likely to opt for abstention
after the information shock, instead of voting for a candidate that was only weakly preferred. In
column 3 of Table 4, we find that we cannot exclude such an effect for the turnout measure at 17:00.
Departments which in the first round had the top 50% joint vote share for Benoı̂t Hamon and Jean-Luc
Mélenchon show a larger decrease in turnout after the information shock, compared to departments
with the bottom 50% vote share for the two left-wing candidates. As before, the effect corresponds
to an additional reduction in turnout of 1.1 percentage points. Though insignificant on conventional
levels, with a p-value of 0.113, this effect is close to the 10% level. Finally, column 4 in Table 4 shows
the absence of heterogeneous effects between departments with the top and bottom 50% vote share in
favor of François Fillon, whose ideological position on the right was in between Macron and Le Pen.
Overall, with respect to the worry that exit polls might alter the representation of preferences
through voter turnout, our results point, if anything, to a small underdog effect. In our data, this effect
is driven by a greater - but with a weak statistical significance - decrease in turnout in departments in
which Macron had won a relative majority in the first round as well as in departments in which left-
wing candidates had obtained a higher vote share. We do not find, instead, any evidence suggesting
that supporters of the expected loser might abstain at a larger rate.
6 Conclusion
On French election days, francophone foreign media in neighboring countries regularly release exit polls
in order to attract online readers from France, where the publication of such information is forbidden
until voting is over. Whether this early release of information has an impact on the electoral outcome
is of key importance to safeguard a fair electoral process. We exploited the circumstances of the 2017
second-round presidential elections to investigate this issue. A predicted landslide victory of Emmanuel
Macron against Marine Le Pen allowed the concerned media to release the exit polls earlier than usual
and to present the election as de facto decided even if voting was still taking place. By comparing
turnout rates at different times in the day with respect to the first round and to previous elections, we
8 In the first round, Macron won a relative majority in 41 departments, while Le Pen won a relative majority in 46
departments. Figure 4 in the online appendix shows the geographical distribution of such departments.
8estimate a reduction of 3.1-4.1 percentage points in turnout from the exit polls’ release.
Consistently with Belgian media being a major source of the information shock, the reduction
in turnout affects the departments close to the Belgian border earlier, before spreading more homo-
geneously across the country. The decrease in participation also seems to have involved Macron’s
supporters and left-wing voters in the first round more than Le Pen’s supporters and right-wing vot-
ers. While the magnitude and statistical significance of the effect suggests that the heterogeneity has
not been severe, the possibility of altering the true representation of preferences calls for attention on
such electoral interference as well as for further investigation of its empirical relevance.
References
Chatterjee, S., & Kamal, J. (2021). Voting for the underdog or jumping on the bandwagon? evidence
from india’s exit poll ban. Public Choice, 188 (3), 431–453.
Delli Carpini, M. (1984). Scooping the voters? the consequences of the networks’ early call of the
1980 presidential race. The Journal of Politics, 46 (3), 866–885.
Grillo, A. (2017). Risk aversion and bandwagon effect in the pivotal voter model. Public Choice,
172 (3), 465–482.
Großer, J., & Schram, A. (2010). Public opinion polls, voter turnout, and welfare: an experimental
study. American Journal of Political Science, 54 (3), 700–717.
Herrera, H., Morelli, M., & Nunnari, S. (2016). Turnout across democracies. American Journal of
Political Science, 60 (3), 607–624.
Hodgson, R., & Maloney, J. (2013). Bandwagon effects in british elections, 1885–1910. Public Choice,
157 (1), 73–90.
Irwin, G., & Van Holsteyn, J. J. (2000). Bandwagons, underdogs, the titanic, and the red cross: the
influence of public opinion polls on voters. In Communication presented at the 18th congress of the
international political science association, québec, 1-5 august 2000.
Kiss, Á., & Simonovits, G. (2014). Identifying the bandwagon effect in two-round elections. Public
Choice, 160 (3), 327–344.
9Levine, D. K., & Palfrey, T. R. (2007). The paradox of voter participation? a laboratory study.
American political science Review , 101 (1), 143–158.
Lott, J. R. (2005). The impact of early media election calls on republican voting rates in florida’s
western panhandle counties in 2000. Public Choice, 123 (3), 349–361.
Marsh, C. (1985). Back on the bandwagon: the effect of opinion polls on public opinion. British
Journal of Political Science, 15 (1), 51–74.
McAllister, I., & Studlar, D. T. (1991). Bandwagon, underdog, or projection? opinion polls and
electoral choice in britain, 1979-1987. The Journal of Politics, 53 (3), 720–741.
Morton, R. B., Muller, D., Page, L., & Torgler, B. (2015). Exit polls, turnout, and bandwagon voting:
evidence from a natural experiment. European Economic Review , 77 , 65–81.
Morton, R. B., & Ou, K. (2015). What motivates bandwagon voting behavior: altruism or a desire to
win? European Journal of Political Economy, 40 , 224–241.
10Dependent variable: Voter turnout in the 2017 French Presidential Elections
(1) (2) (3) (4)
No rain
17h 40.89∗∗∗ 40.13∗∗∗ 40.93∗∗∗ 40.67∗∗∗
(0.000) (0.000) (0.000) (0.000)
Closure 51.47∗∗∗ 50.51∗∗∗ 51.52∗∗∗ 50.91∗∗∗
(0.000) (0.000) (0.000) (0.000)
2nd Round -0.316 -0.320 0.603 -0.142
(0.360) (0.186) (0.214) (0.793)
17h X 2nd Round -3.821∗∗∗ -3.368∗∗∗ -3.747∗∗∗ -4.137∗∗∗
(0.000) (0.000) (0.000) (0.000)
Closure X 2nd Round -3.440∗∗∗ -3.071∗∗∗ -3.618∗∗∗ -3.741∗∗∗
(0.000) (0.000) (0.000) (0.000)
Constant (Turnout at 12h, 1st round) 28.55∗∗∗ 29.56∗∗∗ 28.51∗∗∗ 29.93∗∗∗
(0.000) (0.000) (0.000) (0.000)
Weighted Yes No Yes Yes
Weather trends No No Yes No
Observations 576 576 576 258
Departments 96 96 96 43
Note: Includes voter turnout for the 2017 French presidential elections for all French mainland departments. P-values
are in parentheses, based on standard errors clustered at the department level. Baseline is the turnout at 12:00 in the
first round. Closure is at either 19:00 or 20:00. Column 1, 3 and 4 are weighted by registered voter population, column
2 is unweighted. Weather trends include the maximum temperature and the amount of rainfall at the department
capital in that day interacted with the time. Column 4 only includes departments where it did not rain in the first or
second round. Turnout data from the French Ministry of Interior.
Table 1: Voter turnout at different times of the day for the first and the second round of the 2017
French presidential elections.
11Dependent variable: Voter turnout
Comparing 2012 Comparing 2007
to 2017 to 2017
(1) (2)
17h 42.30∗∗∗ 42.70∗∗∗
(0.000) (0.000)
Closure 53.07∗∗∗ 54.29∗∗∗
(0.000) (0.000)
2nd Round 2.362∗∗∗ 3.066∗∗∗
(0.000) (0.000)
17h X 2nd Round -0.986∗∗∗ -1.735∗∗∗
(0.006) (0.000)
Closure X 2nd Round -1.781∗∗∗ -3.091∗∗∗
(0.000) (0.000)
2017 0.250 -2.490∗∗∗
(0.561) (0.000)
17h X 2017 -1.413∗∗∗ -1.815∗∗∗
(0.003) (0.001)
Closure X 2017 -1.604∗∗∗ -2.822∗∗∗
(0.000) (0.000)
2nd Round X 2017 -2.678∗∗∗ -3.382∗∗∗
(0.000) (0.000)
17h X 2nd Round X 2017 -2.835∗∗∗ -2.086∗∗∗
(0.000) (0.000)
Closure X 2nd Round X 2017 -1.659∗∗∗ -0.349
(0.000) (0.488)
Constant (Turnout at 12h, 1st round) 28.30∗∗∗ 31.04∗∗∗
(0.000) (0.000)
Weighted Yes Yes
Weather trends No No
Observations 1152 1152
Departments 96 96
Note: Includes voter turnout for the French presidential elections for all French mainland departments in 2017 and 2012
(column 1) and in 2017 and 2007 (column 2). P-values are in parentheses, based on standard errors clustered at the
department level. Baseline is the turnout at 12:00 in the first round in 2012 (column 1) and 2007 (column 2). Closure is
at either 19:00 or 20:00. Weighted by registered voter population. Turnout data from the French Ministry of Interior.
Table 2: Comparing voter turnout at different times of the day for the first and the second round of
the 2017 French presidential elections with previous elections.
12Dependent variable: Voter turnout in the 2017 French Presidential Elections
(1) (2) (3) (4)
17h 40.81∗∗∗ 40.83∗∗∗ 41.03∗∗∗ 41.05∗∗∗
(0.000) (0.000) (0.000) (0.000)
Closure 51.65∗∗∗ 51.68∗∗∗ 51.60∗∗∗ 51.66∗∗∗
(0.000) (0.000) (0.000) (0.000)
2nd Round 0.519 0.503 0.647 0.689
(0.281) (0.297) (0.191) (0.167)
∗∗∗ ∗∗∗ ∗∗∗
17h X 2nd Round -3.660 -3.655 -3.842 -3.863∗∗∗
(0.000) (0.000) (0.000) (0.000)
Closure X 2nd Round -3.677∗∗∗ -3.696∗∗∗ -3.690∗∗∗ -3.750∗∗∗
(0.000) (0.000) (0.000) (0.000)
Very close BE -1.265
(0.397)
17h X Very close BE 1.509
(0.225)
Closure X Very close BE -1.566
(0.431)
2nd Round X Very close BE 2.539∗
(0.077)
17h X 2nd Round X Very close BE -1.693∗
(0.059)
Closure X 2nd Round X Very close BE -1.337
(0.222)
Close BE -0.932
(0.453)
17h X Close BE 0.944
(0.387)
Closure X Close BE -1.516
(0.356)
2nd Round X Close BE 2.691∗∗
(0.028)
17h X 2nd Round X Close BE -2.066∗∗∗
(0.009)
Closure X 2nd Round X Close BE -1.471
(0.119)
Very close CH 1.710
(0.136)
17h X Very close CH -2.816∗∗∗
(0.002)
Closure X Very close CH -2.236∗∗
(0.011)
2nd Round X Very close CH 0.743
(0.589)
17h X 2nd Round X Very close CH 2.126
(0.142)
Closure X 2nd Round X Very close CH 1.144
(0.411)
Close CH 1.781∗∗
(0.036)
17h X Close CH -2.215∗∗
(0.011)
Closure X Close CH -2.502∗∗∗
(0.003)
2nd Round X Close CH 0.00778
(0.995)
17h X 2nd Round X Close CH 1.439
(0.188)
Closure X 2nd Round X Close CH 1.659
(0.139)
∗∗∗ ∗∗∗ ∗∗∗
Constant 28.61 28.60 28.45 28.41∗∗∗
(0.000) (0.000) (0.000) (0.000)
Weighted Yes Yes Yes Yes
Weather trends Yes Yes Yes Yes
Observations 576 576 576 576
Departments 96 96 96 96
Note: Includes voter turnout for the 2017 French presidential elections for all French mainland departments. P-values are in
parentheses, based on standard errors clustered at the department level. Department very close to Belgium (“Very close to
BE”) include the departments Nord, Aisne, Ardennes, and Pas de Calais. Departments close to Belgium (“Close BE”) include
those before and Meuse, Meurthe et Moselle, and Somme. Departments very close to Switzerland (“Very close CH”) include
Haute Savoie, Ain, Jura, and Doubs. Departments close to Switzerland (“Close BE”) include those before and Belfort, Haut
Rhin, and Savoie. Baseline is the turnout at 12:00 in the first round. Closure is at either 19:00 or 20:00. Weighted by
registered voter population. Turnout data from the French Ministry of Interior.
Table 3: Voter turnout at different times of the day for the first and the second round of the 2017
French Presidential Elections: Heterogeneous effects with respect to geography.
13Dependent variable: Turnout in the 2017 French Presidential Elections
(1) (2) (3) (4)
17h 40.00∗∗∗ 41.48∗∗∗ 40.15∗∗∗ 41.10∗∗∗
(0.000) (0.000) (0.000) (0.000)
Closure 49.50∗∗∗ 53.12∗∗∗ 50.72∗∗∗ 51.09∗∗∗
(0.000) (0.000) (0.000) (0.000)
2nd Round 0.389 0.725∗∗ 0.604 1.128∗∗
(0.601) (0.047) (0.362) (0.046)
17h X 2nd Round -3.629∗∗∗ -3.793∗∗∗ -3.048∗∗∗ -4.082∗∗∗
(0.000) (0.000) (0.000) (0.000)
Closure X 2nd Round -3.189∗∗∗ -4.112∗∗∗ -3.161∗∗∗ -3.949∗∗∗
(0.000) (0.000) (0.000) (0.000)
Macron first -1.955∗∗
(0.010)
17h X Macron first 1.927∗∗
(0.023)
Closure X Macron first 4.180∗∗∗
(0.000)
2nd Round X Macron first 0.555
(0.455)
17h X 2nd Round X Macron first -0.371
(0.599)
Closure X 2nd Round X Macron first -1.134∗
(0.099)
Le Pen first 1.783∗∗
(0.018)
17h X Le Pen first -1.234
(0.151)
Closure X Le Pen first -3.617∗∗∗
(0.000)
2nd Round X Le Pen first -0.101
(0.907)
17h X 2nd Round X Le Pen first -0.0303
(0.967)
Closure X 2nd Round X Le Pen first 0.849
(0.254)
Left Top 50% -1.014
(0.200)
17h X Left Top 50% 1.355
(0.110)
Closure X Left Top 50% 1.384
(0.206)
2nd Round X Left Top 50% -0.0664
(0.929)
17h X 2nd Round X Left Top 50% -1.121
(0.113)
Closure X 2nd Round X Left Top 50% -0.702
(0.293)
Fillon Top 50% 0.298
(0.717)
17h X Fillon Top 50% -0.332
(0.707)
Closure X Fillon Top 50% 0.848
(0.447)
2nd Round X Fillon Top 50% -0.919
(0.198)
17h X 2nd Round X Fillon Top 50% 0.616
(0.391)
Closure X 2nd Round X Fillon Top 50% 0.366
(0.591)
∗∗∗ ∗∗∗ ∗∗∗
Constant 29.45 27.72 29.09 28.36∗∗∗
(0.000) (0.000) (0.000) (0.000)
Weighted Yes Yes Yes Yes
Weather trends Yes Yes Yes Yes
Observations 576 576 576 576
Departments 96 96 96 96
Note: Includes voter turnout for the 2017 French presidential elections for all French mainland departments. P-values are in
parentheses, based on standard errors clustered at the department level. “Macron first” includes the 41 departments where
Macron won a relative majority in the first round. “Le Pen first” includes the 46 departments where Le Pen won a relative
majority in the first round. “Left top 50%” includes departments where the combined vote share of the left candidates Hamon
and Mélenchon is above the median. “Fillon top 50%” includes departments where the vote share of the right candidate Fillon
is above the median. Baseline is the turnout at 12:00 in the first round. Closure is at either 19:00 or 20:00. Weighted by
registered voter population. Turnout data from the French Ministry of Interior.
Table 4: Voter turnout at different times of the day for the first and the second round of the 2017
French presidential elections: Heterogeneous effects with respect to voting behavior in the first round.
14A Online Appendix (not intended for publication)
Variable Mean Std. Dev. Min. Max.
Final voter turnout round 1 80.072 2.648 67.239 84.290
Final voter turnout round 2 76.681 2.759 63.45 80.930
Indicator of rain in round 1 0.01 0.102 0 1
Maximum temperature in round 1 17.896 4.236 1 27
Indicator of rain in round 2 0.552 0.5 0 1
Maximum temperature in round 2 16.625 3.616 10 26
First round vote shares:
Emmanuel Macron 23.029 3.486 16.46 34.83
Marine Le Pen 22.589 5.935 4.99 35.67
Jean-Luc Mélenchon 19.18 3.12 13.78 34.02
François Fillon 19.647 3.402 12.75 29.14
Benoı̂t Hamon 6.068 1.387 3.44 10.91
Second round vote shares:
Emmanuel Macron 63.884 8.484 47.09 89.680
Marine Le Pen 36.131 8.496 10.32 52.91
N 96
Note: Turnout and voting data from the French Ministry of Interior. Weather measured at the
department capital.
Table 5: Summary Statistics
15Dependent variable Voter turnout
(1) (2)
17h 40.93∗∗∗ 40.42∗∗∗
(0.000) (0.000)
Closure 51.52∗∗∗ 51.23∗∗∗
(0.000) (0.000)
2nd Round 0.603 -0.232
(0.214) (0.666)
17h X 2nd Round -3.747∗∗∗ -3.908∗∗∗
(0.000) (0.000)
Closure X 2nd Round -3.618∗∗∗ -3.547∗∗∗
(0.000) (0.000)
Rain -1.183
(0.236)
17h X Rain -0.537
(0.425)
Closure X Rain -0.149
(0.845)
Max. temperture (std) 1.189∗∗ 0.920
(0.016) (0.110)
17h X Max. temperture (std) -1.162∗∗∗ -1.394∗∗∗
(0.001) (0.000)
Closure X Max. temperture (std) -1.308∗∗∗ -1.435∗∗∗
(0.003) (0.001)
Never rained 1.324
(0.215)
17h X Never rained 1.235
(0.209)
Closure X Never rained 0.694
(0.537)
2nd Round X Never rained 0.242
(0.743)
17h X 2nd Round X Never rained -0.459
(0.534)
Closure X 2nd Round X Never rained -0.430
(0.546)
Constant 28.51∗∗∗ 27.95∗∗∗
(0.000) (0.000)
Weighted Yes Yes
Observations 576 576
Departments 96 96
Note: Includes voter turnout for the 2017 French presidential elections for all French mainland departments. P-values are in
parentheses, based on standard errors clustered at the department level. Column 1 shows the baseline regression with the
weather trends. Column 2 test for a difference in the trends between departments where iy never rained and departments
where it rained in either of the two rounds. Baseline is the turnout at 12:00 in the first round. Closure is at either 19:00 or
20:00. Weighted by registered voter population. Turnout data from the French Ministry of Interior.
Table 6: Voter turnout at different times of the day for the first and the second round of the 2017
French Presidential Elections: Full specification with weather trends.
16Figure 2: Sketch of the information available on the RTBF network and on twitter on the second
round election day, 7 May 2017
17Figure 3: Map of departments close and very close to either Belgium or Switzerland (see Table 4)
Figure 4: Map of departments by the winning candidate in the first round (see Table 4)
Source: The Guardian. Correction: in the original map, the department of Alpes-Maritimes was
wrongly assigned to Le Pen
18You can also read