Evidence of Decreasing Internet Entropy: The Lack of Redundancy in DNS Resolution by Major Websites and Services.
←
→
Page content transcription
If your browser does not render page correctly, please read the page content below
Journal of Quantitative Description: Digital Media 1(2021) 1

 Evidence of Decreasing Internet Entropy: The Lack of Redundancy in
 DNS Resolution by Major Websites and Services.
 SAMANTHA BATES
 Harvard Law School, United States of America
 JOHN BOWERS
 Yale Law School, United States of America
 SHANE GREENSTEIN
 Harvard Business School, United States of America
 JORDI WEINSTOCK
 Harvard Law School, United States of America
 YUNHAN XU
 Harvard College, United States of America
 JONATHAN ZITTRAIN 1
 Harvard Law School & Harvard School of Engineering and Applied
 Sciences, United States of America

 The Internet, and the Web built on top of it, were intended to support an
 “entropic” physical and logical network map (Zittrain, 2013). That is, they
 have been designed to allow servers to be spread anywhere in the world in
 an ad hoc and evolving fashion, rather than a centralized one. Arbitrary
 distance among, and number of, servers causes no particular architectural
 problems, and indeed ensures that problems experienced by one data source
 remain unlinked to others. For example, a Web server can be, from a
 broadband network standpoint, as easily hosted in someone’s living room
 as in the basement server room of a major enterprise. And a Web page can
 be assembled from any number of upstream sources, through the use of

1
 The authors would like to thank Hans Christian Gregersen and Matt Phillips for their work in preparing
early versions of our dataset. The authors would also like to thank David Dinin and Andy Ellis for lending
us their expertise in DNS and other technical matters.
Journal of Quantitative Description: Digital Media 1(2021) 2

 various URLs, each pointing to a different location. To a user, the page
 looks unified. Over time, however, there are signs that the hosting and
 finding of Internet services has become more centralized. We sought to
 explore and document one possible dimension of this centralization, and to
 discuss its implications.

 We analyze the extent to which the Internet’s global domain name
 resolution (DNS) system has preserved its distributed resilience given the
 rise of cloud-based hosting and infrastructure. We offer evidence of the
 dramatic concentration of the DNS hosting market in the hands of a small
 number of dominant cloud service providers over a period spanning from
 2011-2018. In addition, we examine changes in domains’ tendency to
 “diversify” their pool of nameservers – how frequently domains employ
 DNS management services from multiple providers rather than just one
 provider – a comparatively costless and therefore puzzlingly rare decision
 that could offer redundancy and resilience in the event of an attack or
 service outage affecting one provider. Throughout the paper, we use the
 catastrophic October 2016 attack on Dyn, a major DNS hosting provider, as
 a case study illustrating the cybersecurity consequences of our analysis.

 Keywords: domain name system, resilience, cybersecurity, entropy

 On October 21, 2016, it appeared to many worldwide Internet users that the network
had broken. Users in North America or Europe trying to access major websites such as
Netflix, CNBC, and Twitter found only blank screens or error messages. It soon became
clear that the cause was a distributed denial of service (DDoS) attack against Dyn, a major
domain name system (DNS) service provider. 2 Dyn reported that its servers were

2
 Note that Dyn was acquired by Oracle in 2016, and currently operates as a business unit within Oracle.
However, we refer to it as “Dyn” throughout this paper for clarity’s sake.
Journal of Quantitative Description: Digital Media 1(2021) 3

overwhelmed by a flood of requests from a botnet of “Internet of Things” (IoT) devices
infected by Mirai malware (Hilton, 2016).

 As a DNS provider, Dyn enables Internet traffic by translating the site’s domain
name (URL) into the IP address where the server behind that domain is to be found.
Website operators often contract with Dyn and other companies like it to manage that
“lookup” process rather than handling it themselves. During the attack, Dyn servers were
unable to process users’ lookup requests (both legitimate and illegitimate), and as a result,
users lost access to web domains reliant on Dyn such as Netflix, CNBC, and Twitter
(Newman, 2016). While it is impossible to calculate the economic cost of such an attack,
Dyn itself has claimed that “[t]he cost of a DDoS attack can quickly reach up to million
dollars an hour in lost revenue and productivity for the average size company” (Dyn, 2017).

 The Dyn attack illustrates how fragile the Internet can be when malicious actors
know how to exploit its vulnerabilities. The Internet comprises many servers, traditionally
found in a wide variety of physical and logical locations. An ethos of decentralization is
woven into its central protocols – they anticipate and embrace the messiness of an
organically-growing network unconstrained by any sort of central plan. This tendency
towards decentralization, which we refer to as the internet’s “entropy,” is the secret to its
resilience and ability to deal with failure. When the internet’s functionality is distributed
across a vast sea of physically and logically distinct hosts, single points of failure are
minimized.

 However, the internet’s decentralized ideal has more and more fallen out of
alignment with its reality. The past decade has seen a surge in cloud hosting: the servers
that store and distribute the content hosted by a website are more and more likely to reside
in a massive server farm owned by one of a handful of dominant cloud providers rather
than in an on-site server room. And while it offers massive economies of scale as well as
advantages in reliability, performance, and expertise, this more centralized hosting model
has undermined the internet’s “entropic” resilience. With centralization comes single
Journal of Quantitative Description: Digital Media 1(2021) 4

points of failure – if a major provider goes offline, so too might the broad swath of websites
and services that rely upon it (Albert et al., 2000).

 DNS services, which are often part-and-parcel of website hosting arrangements,
have followed this trajectory of centralization – and now confront the vulnerabilities
associated with it. While the Dyn attack represents one dramatic example of how a loss of
entropy across internet infrastructure exposes Internet-wide vulnerabilities exploitable by
bad actors, we doubt it will be the last such incident.

 This paper examines the increasing concentration of the DNS hosting industry. We
argue that a long-term shift towards centralization of DNS hosting – to the benefit of a
small handful of cloud services providers like Dyn, Amazon Web Services, and Cloudflare
– has, along with website administrators’ failure to designate failover “secondary” DNS
providers, created dangerous single points of failure in the DNS. We use the Dyn attack as
a running case study to illustrate that these single points of failure present a significant
cybersecurity risk, and suggest some paths forward.

 Part I offers an overview of the DNS for those less familiar with its technical
specifications, using the Dyn attack to illustrate how the DNS can fail. Part II describes the
article’s empirical methodology. Part III presents results and analysis relating to the
increased concentration of the DNS hosting market, observing that market share has
become concentrated in the hands of a small number of dominant firms. Part IV offers an
empirical examination of website administrators’ widespread failure to designate
secondary DNS hosts, a measure which could function as a fallback in the event that the
primary host fails. Parts III and IV both illustrate cybersecurity risks related to their
observations using the Dyn attack. Part V concludes.
Journal of Quantitative Description: Digital Media 1(2021) 5

 I. What is the Domain Name System?

 DNS servers perform a variety of functions that make them an integral part of the
Internet’s infrastructure. This paper will focus primarily on DNS’s role as a “website
directory” or authoritative resolver which translates a website’s human-friendly domain
name (like www.example.com) into a machine-friendly IP address (like 192.0.2.1)
pointing to the location of the website’s host server on the Internet. The information needed
to complete these translations is stored in definitive form by a domain’s “authoritative
nameservers” in files called “resource records” (RRs). 3

 DNS is structured as a hierarchically distributed database. At the very top of the
hierarchy are 13 “root” servers. 4 Administered by a range of organizations including
governments and branches of the US military, these root servers are responsible for storing
RRs corresponding to Top-Level Domain (TLD) nameservers. A vast range of TLDs
(including “.com,” “.net,” “.org,” and country-level identifiers such as “.uk” or “.fr”) can
be found at the rightmost end of the domains we access every day. TLD nameservers are
managed by a wide range of public and private organizations under authority delegated by
the Internet Corporation for Assigned Names and Numbers. Each TLD nameserver – or
network thereof – is responsible for keeping RRs corresponding to the authoritative
nameservers 5 of domains that fall within that TLD. 6 For example, the “.com” nameservers
keep RRs for the authoritative nameservers for the domain namespace encompassing
domain names such as “www.google.com” and “www.amazon.com.”

3
 There are many different types of resource records, but for the sake of simplicity we do not distinguish
between them.
4
 More precisely, 13 networks of root servers with internal redundancy.
5
 In practice, there can be additional non-authoritative nameservers between the TLD nameserver and the
domain’s authoritative nameserver. In such cases, the hierarchy is simply extended accordingly. For
example, when requesting the IP address of https://www.oii.ox.ac.uk/, the resolver may be directed to the
nameservers for ‘uk’, ‘ac’ and ‘ox’ before it reaches the domain’s authoritative nameserver.
6
 These sets of RRs corresponding to a particular domain are often referred to as “NS records.”
Journal of Quantitative Description: Digital Media 1(2021) 6

 Authoritative nameservers for a given domain namespace can be administered by
that domain’s owners, or management can be outsourced to one or more external providers
such as Dyn, AWS, or Cloudflare. They form the last stage in the DNS hierarchy, storing
RRs that provide translations between domain names and IP addresses.

 Figure 1

 A. Tracing a DNS Request

 Understanding how the DDoS attack on Dyn interfered with this process means
tracing through the steps of a DNS lookup. When an application (such as a web browser)
wants to access a page or resource located at a known domain name, it can leverage the
DNS system to find a corresponding IP address. In principle, the application submits a
request to a DNS “resolver” asking for the IP address corresponding to a given domain
name, specified in URL format (ex. “www.google.com”). The resolver traces through this
URL’s period-separated components from right to left in order to zero in on the desired
authoritative nameserver.

 The resolver first queries a root nameserver, which replies with RRs corresponding
to the TLD nameserver specified by the domain name (“.com”). The resolver then queries
that specified TLD nameserver with the second component of the domain name (“google”).
The TLD nameserver retrieves the RRs corresponding to that domain’s authoritative
Journal of Quantitative Description: Digital Media 1(2021) 7

nameservers (“ns1.google.com”) and returns them to the resolver. Finally, the resolver
queries one of the authoritative nameservers and receives a usable IP address for the
domain. The IP address is passed back to the original application, which can use it to
connect to the desired host. This entire process generally takes just milliseconds to finish.

 Figure 2

 If every DNS request passed through all of these intermediary stages, the DNS
infrastructure would face a constant and potentially overwhelming deluge of traffic.
Luckily, RRs are cached at numerous points in the lookup process. Applications and
Internet-connected devices maintain small caches of RRs for recently visited sites, as do
Internet Service Providers (ISPs) and other intermediate nameservers. Of course, the
content of these records can become inaccurate over time as IPs change. As such, RRs
eventually expire. Most RRs must be replaced after twenty-four hours, though many larger
sites implement much shorter expiration periods. 7 The duration for which nameservers are
allowed to cache a RR without updating it is that RR’s ‘time to live’ (TTL). An RR with a

7
 For example, the “dig” command, a tool for querying DNS servers reveals that the RRs for
www.spotify.com had a TTL of 150 seconds as of October 12th, 2020.
Journal of Quantitative Description: Digital Media 1(2021) 8

short TTL will have to be updated more often, but it is also more likely to remain accurate
(Liu & Albitz, 2006, Chapter 2).

 If the authoritative nameserver corresponding to a particular domain name goes
down (as many of those administered by Dyn did in the October DDoS attack), DNS
resolvers become unable to update RRs that have expired or changed. In the event of a
DNS failure IP addresses may still resolve to the correct host, but it is very unlikely that
any user will know the exact current IP addresses of the websites they want to access. As
such, a DNS malfunction effectively prevents users from accessing the content they have
requested even if that content is hosted on an otherwise healthy server.

 Figure 3

 B. DNS: Designed for Resilience?

 As is evident from the hierarchical architecture outlined above, the global Domain
Name System (DNS) infrastructure is distributed by design (Mockapetris & Dunlap, 1988).
Rather than being handled by a single master server mapping domain names to IP
addresses, DNS lookups rely on interactions among millions of different servers
worldwide. This distributed model theoretically brings a degree of segmentation and
redundancy to the DNS system, minimizing “single points of failure” at which technical
Journal of Quantitative Description: Digital Media 1(2021) 9

breakdowns result in access problems for significant swaths of the Internet (Kurose &
Ross, 2013, Chapter 2.5).

 However, the rise of cloud-based hosting and domain management services
threatens to overturn this distributed model of resilience. Companies such as Amazon Web
Services (Amazon, 2021), Akamai (Akamai, 2021), and Dyn offer scalable and often easily
configurable external DNS hosting options alongside other cloud services, making it easier
than ever to offload DNS management. External DNS hosting can offer significant
advantages in terms of load balancing, reliability, and geographic reach. As of 2017, Dyn’s
DNS service boasted points of presence on five continents, a team of dedicated security
experts, a sophisticated performance analytics engine, and a multitude of load balancing
and traffic steering features (Dyn, 2017). 8 Moreover, large and centralized DNS providers
have the means and incentives to invest in cybersecurity readiness to an extent that would
be infeasible for most of their individual clients.

 Alongside these advantages, however, the consolidation of DNS services for a vast
range of web domains into the hands of a relatively small number of providers could
potentially pose a threat to the stability of the Internet. With consolidation comes single
points of failure that create opportunities for simultaneous downtime. As in the case of the
Dyn attack, the reachability of many domains can easily hinge on the resilience and
stability of a single monolithic provider. Moreover, if the DNS market moves towards an
oligopolistic or monopolistic structure, the lack of competition among DNS providers may
decrease the diversity of providers available to consumers. Such a market shift could
escalate consolidation further while stifling consumer-friendly business practices and
making DNS servers even more attractive targets to malicious actors.

8
 In addition to translating domain names into IP addresses, DNS servers can also be used to direct and
balance Internet traffic so that no individual server is burdened by too many requests. These types of
functions are called load balancing and traffic steering. For the purposes of this paper we investigate the
impact of concentration only on DNS’s role as a “website directory.”
Journal of Quantitative Description: Digital Media 1(2021) 10

 The fact that externally hosted DNS providers offer high quality service while
concentrating the DNS hosting industry presents an important tradeoff between two
different patterns of downtime. On one hand, having a relatively small number of large
externally hosted DNS providers with significant market share generates single points of
failure which expose large segments of the Internet to simultaneous downtime. On the
other, externally hosted DNS providers are – as mentioned above – generally very
successful in maintaining almost perfect uptime while provisioning a range of sophisticated
additional services that can substantially improve DNS performance. A tradeoff thus
emerges between occasional periods of widespread downtime and potentially more
frequent but highly distributed patterns of DNS downtime for individual sites or smaller
externally hosted DNS providers.

 C. The Stakes of DNS Resilience

 The Dyn attack provides a vivid illustration of how DNS infrastructure
vulnerabilities – and DNS space concentration – can wreak havoc on the stability of the
Internet. Prompting a widespread Internet outage that left many high-profile websites
inaccessible for a period of hours (Perlroth, 2016), the attack’s devastating success
highlights many of the ways in which a concentrated DNS space with relatively little use
of secondary DNS providers can leave even well-resourced and well-managed websites
vulnerable to service disruptions.

 Why, though, does DNS downtime matter? Is it really a big deal if a swath of the
Internet becomes inaccessible for a few hours every now and then? In short, yes. Even brief
periods of downtime can have a dramatic impact on the economic well-being of affected
companies. A 2014 survey of 270 North American companies with a significant web
presence found that about 50% of DDoS attacks cost their targets more than $20,000 an
hour, with 49% of attacks lasting between six and twenty-four hours (Matthews, 2014).
Some larger companies can suffer more than $100,000 an hour in IT, security, and sales
related damages. About 87% of companies that had been targeted by a DDoS attack
Journal of Quantitative Description: Digital Media 1(2021) 11

reported “at least one non-financial consequence such as loss of customer trust, loss of
intellectual property, and virus/malware infection” (Matthews, 2014).

 DNS downtime has a range of other less explicitly economic impacts on a
company’s web presence. Search engines use web crawlers, automated scripts that can be
used to copy visited websites or search for specific information, to index pages and
determine search result presentation precedence. 9 If a site is unreachable during a crawl
due to DNS downtime, the crawler will mark it as having been “uncrawlable” at the time
of attempted access – a designation with potentially devastating consequences for a site’s
visibility (“How DDoS Attacks Can Impact Your SEO,” 2013). Furthermore, since DNS
is involved in handling services such as a domain’s email functionality, DNS downtime
can cripple communications within and between companies.

 The DNS infrastructure will face more pressure from malicious actors in the
coming years, not less. An annual report published by the cybersecurity company
Nexusguard found that in Q1 2017 the number of DNS attacks they observed “registered a
380% year-on-year growth, suggesting that DDoS attacks occurred more frequently than
the same period a year ago” (Nexusguard, 2017). The report partially attributes the
proliferation of massive DDoS-capable botnets to the rise of the so-called “Internet of
Things,” which continues to bring an enormous number of often poorly secured web-
connected devices online. The “Mirai” botnet which brought Dyn to its knees is only one
example of such a weapon. As more and more devices are added to the global network, the
number and power of botnets will almost certainly increase (Nozomi Networks, 2020).
DNS resilience is not simply about protecting against today’s DDoS attacks – it is also
about anticipating and preparing for tomorrow’s.

 Of course, it doesn’t always take hundreds of thousands of unsecured webcams and
Internet-connected toasters or other IoT devices to bring down a cloud services behemoth.

9
 Web crawlers are automated scripts or programs that search the web for specific information (usually for
indexing purposes) in a systematic way.
Journal of Quantitative Description: Digital Media 1(2021) 12

In the course of routine maintenance in early 2017, a tech at Amazon accidentally caused
a number of Amazon web servers to go offline (Seppala, 2017). The server failure
impacted services like Slack, Quora, and Medium that rely on Amazon cloud storage
(Fingas, 2017). The AWS status page failed to properly reflect the outage due to hard
dependencies on the service that it was designed to monitor (@awscloud, 2017). With
consolidation comes the risk that simple mistakes on the part of engineers and
administrators will cascade into widespread outages.

 II. Methodology

 To analyze trends in the concentration of the DNS hosting industry over time, as
well as the rate at which websites designate secondary DNS providers, we sampled the top
1000 U.S. domains in the “.com,” “.net,” or “.org” Top-Level Domains (TLDs) according
to Alexa Top Sites (Alexa, n.d.) listings on a monthly basis between November 2011 and
July 2018. We recognize that our results could change if we included domains from other
regions, such as “.cn” and “.ru,” in our dataset. 10 However, we chose to focus on traditional
domains, “.com,” “.net,” and “.org” because they are among the longest standing TLDs
and comparatively represent a broad “general purpose” sample of high-traffic Internet sites.
Due to our sampling method, the set of domains examined each month varied depending

10
 Sites using “Country Code TLDs” like “.cn” and “.ru” are typically hosted outside of the United States,
and tend to cater to a non-U.S. audience. For example, Alibaba Cloud and Tencent Cloud are significant
players in the Chinese hosting ecosystem, but barely show up in our analysis. As such, the results here tend
to focus in on the dynamics of the U.S. DNS hosting industry in particular. That said, the TLDs examined
here account for a large proportion of the domains registered globally (173.9 million of the 370.7 million
identified in a 2020 Verisign analysis) and most of the largest and most visited sites on the Internet.
Journal of Quantitative Description: Digital Media 1(2021) 13

on the composition of the Alexa rankings. 11 This sampling methodology is also
approximate because our dataset is missing about 4.5% of rankings per month. 12

 The motivation for this approach is drawn from the use of market indexes in
economics – indexes such as the S&P500 are composed to reflect the performance and
behavior of a broader market (Blitzer, 2013). It is important to note that DNS providers’
market share in this sample does not reflect that of the broader Internet – our focus is on
high-traffic domains which are far less likely to use low-end-market oriented providers
such as GoDaddy DNS (Datanyze).

11
 Alexa Top Sites data has some deficiencies, but was the best available dataset for our study. One
 drawback of the dataset is that Alexa’s ranking algorithm is not transparent. See (Alexa, 2020)
 However, it should be noted that other ranking companies also prefer to keep their ranking
 algorithms secret and it is often not possible to obtain verified data from any of these companies.
 Moreover, the top ranked sites identified by Alexa, Quantcast, Comscore, and other ranking
 companies are comparable, confirming that our dataset of top ranked sites is generally reflective of
 the consensus among analysts. While there may be differences among rankings depending on the
 company, these differences tend to occur most frequently at the extreme end of samples (sites
 outside of the top 1000).

 We do not have access to Alexa Top Sites data from after July 2018. We explored using a list from
the Tranco team, which began publishing top sites rankings in December of 2018 (Tranco, 2020).
Integrating the Tranco data yielded results broadly consistent with those presented here, despite some
significant differences in the specific compositions of the Alexa and Tranco lists. However, we did note
that domains using Cloudflare as their DNS provider tended to rank far less well on the Tranco list
compared to the Alexa Top Sites list, and that the list reflected significant turnover in domain rankings
from March 2020 to the present, potentially driven by changes in user behavior arising from the COVID-19
pandemic.

 A paper published by the team behind the Tranco list offers some important insights into the
volatility and manipulability of top sites lists in general, and the implications of those vulnerabilities for
academic research (Le Pochat et al., 2019). We deeply appreciate the work of the Tranco team, which is
taking on one of the most serious methodological issues confronting quantitative internet research today.
12
 These missing data are seemingly distributed in completely random fashion and are therefore highly
unlikely to bias the results of our analysis. However, this random variation do introduce a small amount of
additional “jitter” into the trendlines presented here. We experimented with imputing missing values based
on the previous and following months, which had a very slight smoothing effect, but ultimately elected to
use the data as collected.
Journal of Quantitative Description: Digital Media 1(2021) 14

 Figure 4: Original top-1000 domains in the top 1000 sites (Alexa ranking) over time

 It is also challenging to determine the importance and representativeness of a
domain because it is not as easy to quantitatively model as that of a publicly traded entity.
While the contributions of companies included in a conventional stock market index might
be weighted using relatively straightforward and publicly available metrics such as market
capitalization, weighting domains is not nearly so simple. Even seemingly basic metrics
such as page views per month are very difficult to estimate accurately without insider
analytics (Fishkin, 2015). However, despite these challenges, we believe that our data are
representative of most high-traffic Internet sites within the TLDs examined. Given that
“eyeball share” on the Internet is highly concentrated within a relatively small set of sites,
sampling 1000 of the most popular sites on the Internet every month captures a sample
which represents a large proportion of all Internet behavior in the U.S.

 We collected historical nameserver information for each of the domains identified
in our dataset using an API offered by CompleteDNS. These data record changes in each
Journal of Quantitative Description: Digital Media 1(2021) 15

domain’s nameserver registration on a monthly basis, allowing us to identify migrations to
and away from external DNS providers or self-hosted DNS solutions. We cross-checked
our historical nameserver information against a number of comparable providers and found
no evident discrepancies or errors. We were not concerned with how much of a domain’s
DNS traffic was routed through a given nameserver. Rather, we looked at the number of
distinct authoritative nameservers registered by a domain and which providers managed
those nameservers. By combining our monthly sample of domains with these historical
nameserver data, we were able to generate a month-by-month timeline of nameserver
configurations for our sample.

 III. Concentration of the DNS Hosting Market

 The extent to which an industry’s providers is concentrated has major implications
for that industry’s vulnerability to catastrophic wide-ranging failure. If a large proportion
of share in the market served by the industry is divided among a small number of providers,
outages affecting any one of those providers may have dramatic repercussions for the
industry’s customers as a whole. In other words, high-share providers have the potential to
become single points of failure for large segments of the Internet. In examining the
concentration of the DNS hosting market, we aimed to shed light on the extent to which it
falls prey to these vulnerabilities.

 This section presents our analysis demonstrating that the DNS hosting market has
become significantly more concentrated since November of 2011. It concludes by
examining the security implications of that concentration, using the Dyn attack as a case
study.

 A. DNS Hosting as a Market

 Our sampling methodology defines a set of high-traffic domains under the “.com,”
“.net,” and “.org” TLDs. Within this set we can observe, using the methodology outlined
Journal of Quantitative Description: Digital Media 1(2021) 16

above, continuities and changes in the DNS nameservers delegated by each domain in the
sample, domains’ DNS usage, and how domains adjust their DNS architectures over time.
Each domain in our sample uses one or more DNS providers. Some domains host and
manage their own DNS nameservers, in which case they are their own DNS provider.
Others rely entirely on external providers such as Dyn, Amazon Web Services (AWS), and
Akamai. At any given time, a domain may have multiple nameservers (generally between
two and eight) managed by a combination of providers or by a single provider.

 We define the DNS hosting market as the set of providers – including external DNS
providers like Dyn, Akamai, and AWS, and others, as well as “self-hosting” domains which
run their own servers – handling DNS for our sample of domains. A provider’s share of
the market is defined as the number of domains in the sample for which that provider
handles at least one nameserver. The total size of the market is defined as the number of
domains or “fractional domains” 13 administered by each provider summed across all
providers present in the sample.

 B. Concentration of the DNS Market as a Whole

 To quantitatively model the concentration of the DNS hosting market over time we
adopted a metric from the antitrust economics literature: the Herfindahl-Hirschman Index
(HHI). 14 A standard measure of market concentration used by the Department of Justice,
Federal Trade Commission, and Census bureau, the HHI is defined as the sum of squared

13
 In cases where a domain’s DNS services is diversified among multiple providers, share is divided evenly
among all providers used. For example, a domain managed by two providers would contribute 0.5 share to
each. In economics, share in these cases is generally divided according to proportions of sales – a
comparable division metric unfortunately does not exist in this case.
14
 The Herfindahl-Hirschman Index has faced criticism for its inability to capture subtler forms of market
consolidation, and its failure to account for market-specific nuances of competition policy (like the unique
competitive dynamics of the utilities industry). In some sense, its greatest strength – its simplicity and
interpretability – is also its critical weakness (Matsumoto et al., 2011). That said, we are using the HHI here
primarily as a heuristic to uncover the sign and magnitude of the trend towards consolidation in the DNS
market, so the metric’s deficiencies, while worth keeping in mind, are not prohibitive. We supplement it
with CR1, CR4, and CR8 metrics to reinforce our analysis.
Journal of Quantitative Description: Digital Media 1(2021) 17

market shares across all firms in a market (Rhoades, 1993). It ranges from 0 (for a perfectly
distributed market) to 10,000 (a perfectly concentrated market). More formally:

 = � 2
 =1

 Where N is the number of firms (DNS providers in our case) and is the market
share for the i-th firm.

 The HHI is generally used to measure market share in terms of revenues collected
by suppliers; however, that is not the case here. Because we are limited by the information
that is publicly available (we do not have access to the pricing of services or the revenues
collected by the suppliers in this market), the HHI in this paper measures market share
based on supplier choice without accounting for revenue. Applying the HHI to our dataset
revealed a considerable degree of consolidation within the DNS hosting market between
November 2011 and July 2018.

 Figure 5: HHI of DNS providers in our dataset by year
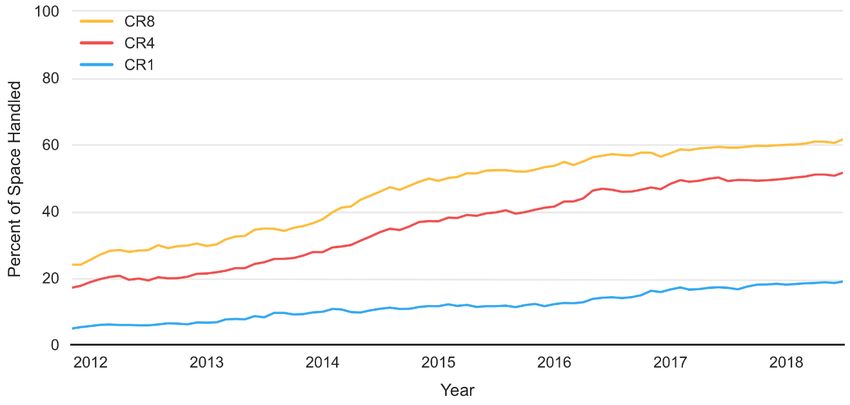
Journal of Quantitative Description: Digital Media 1(2021) 18

 As is apparent from figure 5 (pictured above), the HHI increased by a factor of
about 7.5 over the observed timespan. 15 This indicates that a number of DNS service
providers managed to significantly increase their proportional share of the DNS hosting
market in that timeframe, beginning to consolidate control of DNS services. The linearity
of the trend is striking – gains in concentration have been relatively consistent in the long
run despite yearly fluctuations.

 To better understand the nature of this share capture, we looked at the percentage
of share belonging to the top provider, top 4 providers, and top 8 providers in the DNS
space over time (note that top providers occasionally changed on a month-by-month basis).
As is reflected in figure 6 below, a small number of providers have come to largely
dominate the DNS hosting market. The percentage of share held by the top 8 providers
more than doubled between November 2011 and July 2018, increasing from about 24% to
about 61.6%. The percentage of share held by the top 4 providers grew by an even greater
proportion, increasing from about 17% to about 51.8%. The top provider in the sample
controlled 4.9% of share in November 2011 and 18.9% of share in July 2018.

15
 In recognition of the fact that a disproportionate volume of internet activity is dominated by a few major
websites – Google, Facebook, Youtube, etc. – we recalculated the HHI using a weighting scheme so as to
represent the outsized influence of these top websites. All domains’ share in the sample were weighted by a
factor of w(R) = e-2.6545 - ln(R) (where R is the domain’s Alexa rank), a function derived from the regression
of a domains’ share of global traffic on its Alexa rank presented by Shiller et al. (DOI:10.3386/w23058).
This weighting scheme had pronounced effects on the HHI: it grew from 794 in November 2011 to 1107 in
July 2018, experiencing frequent fluctuations due to small changes in the ordering of the top few sites.
Dropping the top 5 domains from the dataset after weighting caused the HHI to grow from 262 in
November 2011 to 600 in July 2018, and dropping the top 25 domains caused the HHI to grow from 138 in
November 2011 to 642 in July 2018, much more in line with the unweighted trend illustrated above.
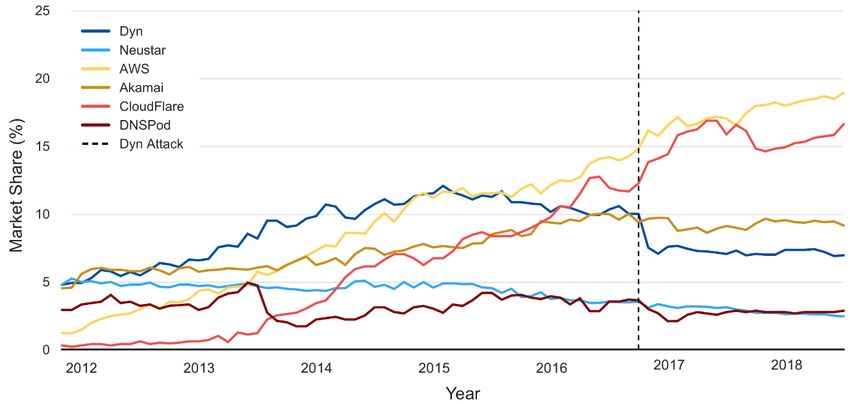
Journal of Quantitative Description: Digital Media 1(2021) 19

 Figure 6: Percentage of the DNS market controlled by the top DNS providers

 An analysis of share over time for several of these top providers offers further
insight into changes in the DNS hosting market. The figure below shows change in market
share over time for all providers that were in the top 3 (ranked by market share) at any
point in the sample timeline. Note that a number of rapidly expanding providers including
Dyn, Akamai, AWS, and Cloudflare have captured a large proportion of the DNS hosting
market while other players such as Neustar and DNSPod have retained significant share
over time.
Journal of Quantitative Description: Digital Media 1(2021) 20

 Figure 7: Market share of the top DNS providers

 It is also worth noting that domains often use these providers for more than just
DNS, as many also offer services including Content Delivery Network (CDN) assistance
and site hosting.

 Domains that entered our sample after November 2011 tended to use external DNS
hosting at a much higher rate than those present in the original sample. The DNS hosting
market for entrants showed a July 2018 HHI value of over 1100, as opposed to about 600
for the DNS hosting market for domains present in the original sample. This signals that
newer domains which have broken into the high-traffic sphere may be relying more and
more on a specific set of external DNS hosts.
Journal of Quantitative Description: Digital Media 1(2021) 21

 Figure 9: The HHI of original and entrant domains over time

 C. Concentration of Self-Hosted vs. Externally Hosted DNS

 While the HHI gives us a means of conceptualizing the DNS hosting market in
terms of existing market analysis frameworks, DNS is distinct from most conventional
markets in that many domains choose to host and administer their own DNS nameservers
rather than use external hosting providers such as Dyn or Cloudflare. Companies that host
their own DNS nameservers may maintain a server on their property or host their
nameservers with a service like Rackspace under their own names and remain responsible
for managing it. By differentiating external hosting providers from self-hosting providers
– domains managing their own DNS nameservers – we can both identify trends in the
frequency of self-hosting and analyze the external hosting market independently.

 Our analysis of self-hosting and external hosting reveals that concentration of the
DNS hosting market is driven by two primary forces – the concentration of the external
hosting space into the hands of a small number of providers and a widespread migration
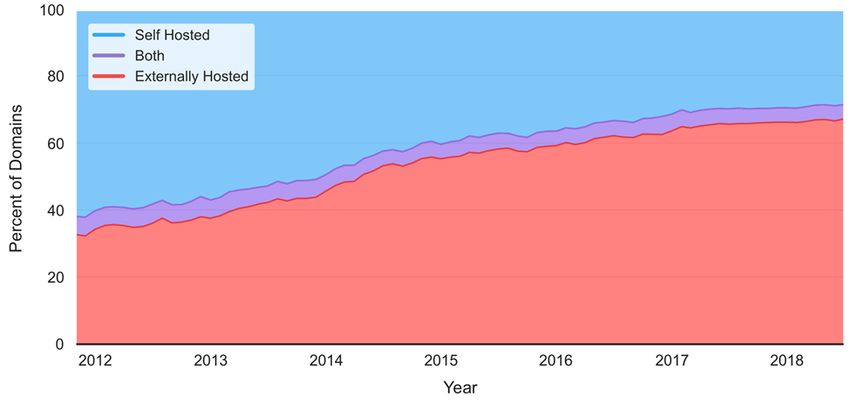
Journal of Quantitative Description: Digital Media 1(2021) 22

away from self-hosted DNS towards externally hosted DNS. The rise of external hosting
promotes concentration by enabling the consolidation of market share that would otherwise
be distributed among a large number of self-hosts into the hands of a single entity.

 Figure 10: Percentage of self-hosted vs. externally hosted domains over time

 As is evident from figure 10 (above), external DNS hosting rapidly overtook self-
hosted DNS in the period between November 2011 and July 2018. 16 The percentage of
domains managed entirely by external DNS hosting providers grew from 32.9% to 67.5%
over that period. By looking at the concentration of the two market segments
independently, we can better pinpoint the sources of increased space-wide concentration.
The HHI of the external hosting market segment more than doubled between November
2011 and July 2018 as a small number of providers took an increasing proportion of share.
The external hosting market segment is massively more concentrated than the self-hosting

16
 Rerunning this analysis under the weighting scheme described in footnote 35 gave significantly different
results: after weighting, the percentage of domains using externally hosted DNS services grew from 19.8%
in November 2011 to 30.8% in July 2018. The lesser magnitude of this change is explained by leading –
and heavily weighted – domains’ proclivity towards self-hosting: Google’s self-hosted domains account for
about 25% of total weighted share in the sample throughout the timeline, but less than 1% of the
unweighted sample.
Journal of Quantitative Description: Digital Media 1(2021) 23

market segment, with HHI averaging about 1181 over the timespan as opposed to about 47
for the self-hosting space. As of July 2018, it stood at about 1622, an increase from 730 in
November 2011.

 Figure 11: The HHI of the external DNS hosting market.

 In sum, the increased concentration of the DNS hosting market can be said to be
driven by two simultaneously occurring phenomena: the consolidation of the external
hosting market segment and the migration of domains out of the self-hosting market
segment into the external hosting market segment. In other words, more and more domains
are choosing to delegate DNS management to an increasingly dominant handful of cloud
hosting services. This shift is concurrent with – and driven by – a broader movement
towards cloud-based site hosting and management platforms, which is particularly
observable among newer websites.

 D. The Dyn Attack: Dangers of DNS Concentration
Journal of Quantitative Description: Digital Media 1(2021) 24

 The Dyn attack offers a dramatic example of the security consequences of the
concentration of the DNS hosting market. At the time of the attack, Dyn held about 10%
share in the overall DNS hosting market. Having expanded from holding 4.8% share in
November 2011, Dyn was among the biggest DNS providers in the sample – a major
winner of the process of consolidation described above. Its clients included Twitter,
Amazon, Zillow, SoundCloud, and eBay among many others.

 When Dyn’s systems went offline during the Mirai botnet’s DDoS attack, they took
most of that 10% with them – as well as numerous other services with dependencies on
Dyn-managed websites and infrastructure.

 Figure 12: Dyn’s share of the DNS hosting market over time

 The dramatic consequences of the Dyn attack illustrate the extent to which DNS
space consolidation has exposed large swaths of the Internet to shared single points of
failure. Had fewer domains relied solely on Dyn’s DNS services, the DDoS attack would
have been far less catastrophic. If large external DNS hosting providers continue to absorb
market share from smaller competitors and from the self-hosted segment of the DNS space,
Journal of Quantitative Description: Digital Media 1(2021) 25

this non-distributed exposure will only become more pronounced. While large, specialized
DNS hosts may fail less often than self-hosting arrangements, they make much juicier
targets for bad actors – and when they fail, the consequences are system-wide and
catastrophic.

 IV. Secondary DNS: An Overlooked Safeguard

 While the concentration of the DNS space as outlined above has the potential to
expose dangerous single points of failure in the DNS system, a powerful safeguard against
such vulnerabilities is built into the specification of DNS itself. By allowing domains to
register multiple nameservers, DNS gives potentially vulnerable domains the opportunity
to diversify among multiple providers. For example, if you registered the domain
www.example.com, you could then choose to register more than one authoritative
nameserver for that domain, with each authoritative nameserver managed by a different
provider. One of your nameservers could be managed by Dyn, example.Dyn.1, and a
second could be managed by Akamai, example.Akamai.1. In the event of another DDoS
attack on Dyn, users would still be able to access www.example.com as long as your DNS
nameserver managed by Akamai remained up and running – the query would “fail over”
to the secondary provider. We refer to the adoption of one or more alternative DNS
providers as “DNS diversification.”

 The importance of DNS redundancy and diversification is not a new realization.
RFC 2182, last updated in 1997, outlines best practices for “selection and operation of
secondary DNS servers.” It explains that “a major reason for having multiple servers for
each zone is to allow information from the zone to be available widely and reliably to
clients throughout the Internet, that is, throughout the world, even when one server is
unavailable or unreachable” (Elz, R. et al., 1997). Similarly, our findings suggest that by
registering DNS servers managed by multiple DNS providers, a domain will remain
accessible in the event that one provider fails due to an attack or technical malfunction
because it is unlikely that both providers will go down at the same time. By choosing to
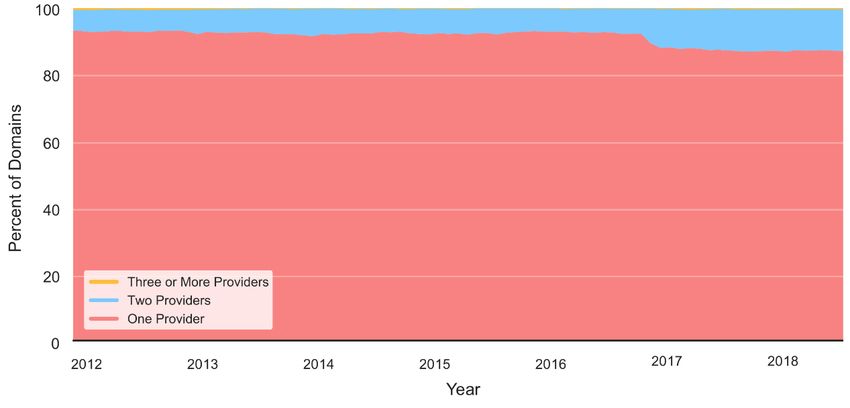
Journal of Quantitative Description: Digital Media 1(2021) 26

work with multiple providers, any domain can therefore secure significant redundancy and
robustness even in an increasingly concentrated DNS space.

 Our results suggest, however, that a large majority of domains in our sample are
not taking advantage of this capability. This section presents analysis demonstrating
strikingly low rates of secondary DNS usage across the sample, despite a strong uptick
following the Dyn attack, and relates that phenomenon to cybersecurity principles
illustrated by the Dyn attack.

 A. Use of DNS Diversification

 From November 2011 to October 2016, the proportion of domains in our sample
using nameservers from just one provider fluctuated in the range between 91% and 93%.
At no point in our timeframe did 1% or more of domains use 3 or more providers.

 Figure 13: The percentage of domains that registered one, two, or three or more DNS providers
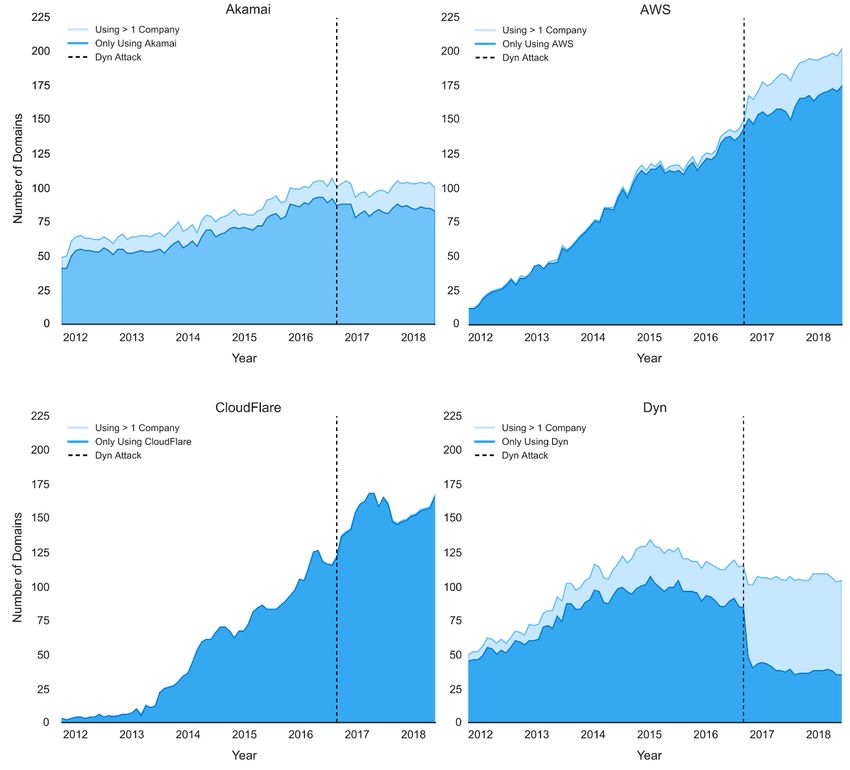
Journal of Quantitative Description: Digital Media 1(2021) 27

 As the figure above illustrates, the Dyn attacks of October 2016 have seemingly
spurred and sustained interest in DNS diversification. 17 From October 1st, 2016 to
November 1st, 2016, the percentage of domains using a single DNS provider fell from
92.2% to 89.4%. The percentage continued to decline between November 2016 and July
2018, reaching 87.1% in July 2018.

 Interestingly, diversification was more common amongst the top ranked 100
domains per month in the sample. The percentage of domains using a single provider
decreased from 95% in November of 2011 to 87% in October 2016. After the Dyn attack,
it dropped to a low of 79% in July 2018. 18

 There is a very significant degree of variation in patterns of diversification and
growth among external DNS providers. As is evident from figure 16 (below) showing the
4 largest externally hosted DNS providers in the sample as of July 2018, customers of some
externally hosted DNS providers tended to diversify much more than those of others. A
fluctuating percentage of 81% and 89% of Akamai users remained undiversified
throughout the sampled timescale as Akamai’s DNS service has roughly doubled in size.
There was a steady increase in diversification rates among Dyn customers from November

17
 When domains diversify, they may do so in a number of ways. For instance, a domain may choose to
delegate DNS services between two or more externally hosted DNS providers. A firm working with Dyn
might, for example, choose to add additional nameservers from Akamai or AWS to diversify their DNS.
Alternately, a firm that manages its own DNS might choose to diversify with secondary services from a
major externally hosted DNS provider or vice versa. As of July 2018, about 65.6% of diversified domains
opted to use multiple externally hosted DNS providers, while about 34.4% of diversified domains chose to
employ a self-hosted domain nameserver and an externally hosted one.
18
 This tendency to stick with one DNS provider was even more pronounced amongst entrant domains.
Entrant domains in the sample tended to diversify at considerably lower rates than original domains, with
around 5% diversifying for most of the timescale prior to the Dyn attack. They also reacted less intensely to
the Dyn attacks than did the original domains: their diversification rate increased by about half as much.
This may signal that entrants are more wedded to single-provider cloud hosting. In contrast to the original
domains that were created before there were many cloud-based DNS providers and had to build their own
DNS infrastructure, entrant domain owners have more external DNS providers to choose from. Moreover,
external providers handle more than just DNS management, so choosing to host everything with one
provider may be the easiest solution for entrants.
Journal of Quantitative Description: Digital Media 1(2021) 28

2011 until the Dyn attack, at which point the percentage of undiversified domains using
Dyn’s services plummeted to 48%.

Figure 16: The number of undiversified and diversified domains using DNS services provided by one of the four largest
 external DNS providers: Akamai, AWS, Cloudflare, and Dyn

 Cloudflare maintained consistently near-zero diversification rates for the entire
timescale, over the course of which it has exploded in size from having virtually no market
share to becoming the second most dominant provider in the sample. This near-complete
Journal of Quantitative Description: Digital Media 1(2021) 29

lack of diversification is a product of Cloudflare’s security model, which requires that DNS
traffic is routed through the Cloudflare network to protect against DDoS attacks and other
network insecurities (Cloudflare, 2021). This approach may make it difficult for domains
to register a secondary nameserver managed by a different DNS provider. Until the Dyn
attack (after which many domains added AWS as a secondary DNS provider) AWS also
registered an extremely low diversification rate – no more than 4% of domains using AWS
diversified at any point before the Dyn attack. Between the attack and July 2018, the
proportion of diversified domains using AWS increased to about 13%.

 B. Why Not Diversify?

 Given the advantages of diversification, why would so many domain operators
neglect to use multiple DNS providers? Configuring DNS across multiple DNS providers
can be a non-trivial technical undertaking. When a DNS server responds to a request by a
DNS resolver, it authenticates its response with a set of “NS records,” which must
accurately reflect all of a domain’s nameservers (even across multiple providers) (Elz, R.
et al., 1997). Using multiple DNS providers therefore requires that the domain’s
administrators be able to edit or otherwise synchronize NS records among DNS servers
that are managed by different providers.

 Many large external DNS companies provide support and documentation for
implementing DNS diversification, with some offering explicitly “secondary” DNS
configurations as a service (Dyn, 2020). However, configuring multiple DNS providers
can still require significant development efforts and the generation of (potentially insecure
or buggy) bespoke code. For a company that does not have the same knowledge or technical
resources, diversifying DNS providers may prove to be more trouble than it is worth
(Hildrew & Sivapalan, 2016).

 The discrepancies in diversification indicated in the previous subsection likely
point to differences in user experiences between external DNS providers which affect the
Journal of Quantitative Description: Digital Media 1(2021) 30

ease with which domains can diversify among multiple DNS providers. It is worth noting
that Dyn – which had the most diversified client domains of any large external DNS host
following the October 2016 attack – provides specific guidelines for making its DNS
services work smoothly with those of other providers (Dyn, 2020). Neustar (Neustar, 2017)
and DNS Made Easy (DNS Made Easy, 2020), the runners up to Dyn in this regard, also
provide such instructions. AWS, which falls behind every other provider except for
CloudFlare in terms of the diversification of its clients, offers no such readily accessible
support.

 Moreover, it should be noted that large externally managed DNS providers –
including Dyn – generally have near-perfect uptime records, with most attaining uptime of
99.9% or higher 19 on a monthly basis (Burt, 2015). The cost, difficulty, and potential
technical issues associated with diversification among multiple providers may simply not
be worthwhile for a majority of firms. As the saying goes, “Nobody ever got fired for
buying IBM” (Maycotte, 2014).

 However, as the number of insecure web-connected devices continues to grow at a
breakneck pace, it is likely that the scale and frequency of botnet-driven DDoS attacks
capable of compromising even the largest providers will continue to increase (Kapur,
2017). If sophisticated externally managed DNS providers cannot scale their
countermeasures accordingly, uptime figures for even the largest services may begin to
decline.

 C. The Dyn Attack: A Wakeup Call (For Some)

 The Dyn attack highlighted the value of diversification among multiple DNS
providers. At the time of the attack, 84 domains in our sample were using Dyn as their only
DNS provider. Even more domains – including Netflix – were using Dyn as the sole DNS
for alternate domains delivering content to their sites. The relationship between DNS

19
 99.9% uptime – “three nines” – is a common responsiveness goal for web domains.
Journal of Quantitative Description: Digital Media 1(2021) 31

vulnerability and CDNs should be explored further, but currently falls beyond the scope of
this paper (Fastly, 2016).

 Following the Dyn attack, a number of cybersecurity industry professionals and
firms specializing in IT infrastructure offered vocal support for multi-provider DNS
diversification (Kephart, 2016; Radware, 2016; York, 2016). Per the analysis above, a
significant number of domains did diversify, bringing the percentage of domains in the
sample using only one provider from 92.2% in October 2016 to 87.1% in July 2018.
However, despite this coverage and evident shift in the DNS space, it seems that the lessons
of the Dyn attack were learned primarily by those who suffered from them directly. Of the
55 domains that remained in the sample between October 2016 and July 2018 and
diversified during that timeframe, the majority (52.7%) were using Dyn alone prior to the
attack. 20

 It is unfortunate that the instructive value of the Dyn attacks seem to have been
limited in large part to those who suffered from it. But even for those who aren’t counted
among the once bitten twice shy, the attack should serve as a reminder that DNS
diversification can serve as a powerful corrective to the systemic cybersecurity risks
imposed by DNS hosting market concentration.

 V. Conclusion

 A stable DNS infrastructure is critical to the operation of the Internet. Growing
cybersecurity challenges from botnets, ransomware, and other service disruption systems
will stress-test even the biggest providers, and future downtime from such attacks is all but
inevitable. With downtime comes SEO penalties and the loss of revenue and user trust. In
addition to this threat of bad actors, even the largest cloud services providers have shown
themselves to be vulnerable to large service outages (Kapur, 2017).

20
 Of these Dyn users, more than two-thirds went to either AWS or NSOne, a relatively recent entrant into
the DNS space which expanded its share somewhat in the wake of the Dyn attack.
Journal of Quantitative Description: Digital Media 1(2021) 32

 The concentration of the DNS space makes confronting these challenges all the
more urgent. As a larger and larger proportion of the Internet’s biggest sites fall under the
management of a small number of externally hosted DNS providers, single points of failure
will continue to emerge and grow in magnitude. While every company with an Internet
presence will ultimately have to weigh its costs and benefits, diversification promises a
powerful means by which many of the dangers of this new DNS environment can be
mitigated. All would be prudent to consider altering their DNS architecture accordingly.

 Ultimately, the biggest determinant of domain owners’ willingness to diversify may
be the extent to which providers choose to support and encourage such diversification. If
single service lock-in is the model of cloud DNS platforms, widespread diversification is
unlikely. However, providers could encourage diversification of DNS management
services by requiring domain owners to select a secondary DNS provider or even specify
which secondary providers they should choose. If more domains adopt and support
affordable and easily configurable “Secondary DNS” models such as that offered by Dyn ,
a diversified and resilient DNS space could easily come into reach.

 And yet, important questions remain. The data presented here suggest that
administrators of prominent domains have adapted their DNS management strategies in a
wide variety of ways. A growing majority have delegated DNS management to external
providers, while a shrinking minority have elected to self-host. Some diversified their DNS
infrastructure by way of secondary DNS providers in the wake of the Dyn attack, while
others continued to work with a single provider -- even a number of those that had seen
their sites go unreachable. These differences in decision making present an open question
for future research, one which goes beyond the scope of our dataset. Further analyses might
investigate DNS management practices in terms of covariates not considered here,
including industry affiliation, firms’ technical sophistication, other characteristics of a
domain’s hosting configuration, and economic factors.
You can also read