Evaluation of qPCR reference genes for taimen (Hucho taimen) under heat stress
←
→
Page content transcription
If your browser does not render page correctly, please read the page content below
www.nature.com/scientificreports
OPEN Evaluation of qPCR reference
genes for taimen (Hucho taimen)
under heat stress
Xiaoxing Yang1,2,5,6, Guangxiang Tong1,2,3,6, Le Dong1,2,5, Ting Yan1,2, Huan Xu1,2,
Guopan Tang4, Yongquan Zhang1,3, Kai Ma1,3, Jiasheng Yin1,2,3 & Youyi Kuang1,2*
As a powerful and attractive method for detecting gene expression, qRT-PCR has been broadly used
in aquaculture research. Understanding the biology of taimen (Hucho taimen) has drawn increasing
interest because of its ecological and economic value. Stable reference genes are required for the
reliable quantification of gene expression, but such genes have not yet been optimized for taimen. In
this study, the stability levels of 10 commonly used candidate reference genes were evaluated using
geNorm, NormFinder, BestKeeper, and RefFinder. The expression levels of the 10 genes were detected
using 240 samples from 48 experimental groups consisting of 40 individuals treated under four heat-
stress conditions (18, 20, 22, and 24 °C) for 24 h and 26 °C for 4, 24, 48, and 72 h. Six tissues (blood,
heart, brain, gill, skin, and liver) were collected from each individual. Ribosomal protein S29 (RPS29)
and ribosomal protein L19 (RPL19) were the most stable genes among all of the samples, whereas 28S
ribosomal RNA (28S rRNA), attachment region binding protein (ARBP), and 18S ribosomal RNA (18S
rRNA) were the least stable. These results were verified by an expression analysis of taimen heat-
stress genes (heat shock protein 60, hsp60, and heat shock protein 70, hsp70). In conclusion, RPS29
and RPL19 are the optimal reference genes for qRT-PCR analyses of taimen, irrespective of the tissue
and experimental conditions. These results allow the reliable study of gene expression in taimen.
Taimen (Hucho taimen), belonging to Salmonidae, is a cold freshwater carnivorous fish1. In recent decades, the
wild taimen population has decreased drastically due to over-exploitation and environmental pollution2. Taimen
has been classified as a vulnerable species in the "China Red Book of Endangered Animals" and "China’s Red
List of Species."3 Taimen is also an economically important fish that has been extensively cultured in China since
2003 because of its fast growth, nutritional value, and good meat taste and quality4. Water temperature has been
found to be an important factor that influences taimen growth and survival, and the optimal water temperature
for taimen growth is 15–18 °C. When the water temperature exceeds 18 °C, taimen refuse to feed, and the growth
rate decreases as the temperature increases. The fish may even die from high temperature stress5. Therefore, it is
important to study the high-temperature tolerance mechanisms of taimen to optimize the production of this spe-
cies, including breeding programs. Currently, many microsatellite6,7 markers, transcriptomes obtained by mRNA
sequencing8, high resolution linage maps9, and genome sequences of huchen, a closely related fish (Hucho hucho,
GCA_003317085.1 in GenBank) have been developed. These are useful tools to characterize candidate genes
related to high-temperature tolerance. Although there are many methods to study the molecular mechanism of
high-temperature tolerance in a species, quantitative real-time PCR (qRT-PCR) is an essential tool to investigate
the role of a gene in high-temperature t olerance10.
qRT-PCR is a nucleic acid quantification technology developed in accordance with traditional PCR
technology11. It is characterized by high sensitivity, good repeatability, and specificity; in addition, it has high-
throughput capabilities and has been broadly applied to gene expression analyses and clinical diagnoses12. The
accuracy and reliability of qRT-PCR are often dependent on many f actors13, including RNA quality, reverse
transcription efficiency, and appropriate reference gene selection. In a gene expression analysis, the selection of
an appropriate reference gene is a crucial prerequisite for accurately quantifying expression levels using qRT-
PCR14. There are many reference genes used in gene expression analysis. Genes involved in the cytoskeleton and
1
Heilongjiang River Fisheries Research Institute, Chinese Academy of Fishery Sciences, Harbin 150070,
China. 2Key Laboratory of Freshwater Aquatic Biotechnology and Breeding, Ministry of Agriculture and Rural
Affairs, Harbin 150070, China. 3Key Open Laboratory of Cold Water Fish Germplasm Resources and Breeding
of Heilongjiang Province, Harbin 150070, China. 4Henan University of Animal Husbandry and Economy,
Zhengzhou 450016, China. 5College of Fisheries and Life Science, Shanghai Ocean University, Shanghai 201303,
China. 6These authors contributed equally: Xiaoxing Yang and Guangxiang Tong. *email: kuangyouyi@hrfri.ac.cn
Scientific Reports | (2022) 12:313 | https://doi.org/10.1038/s41598-021-03872-x 1
Vol.:(0123456789)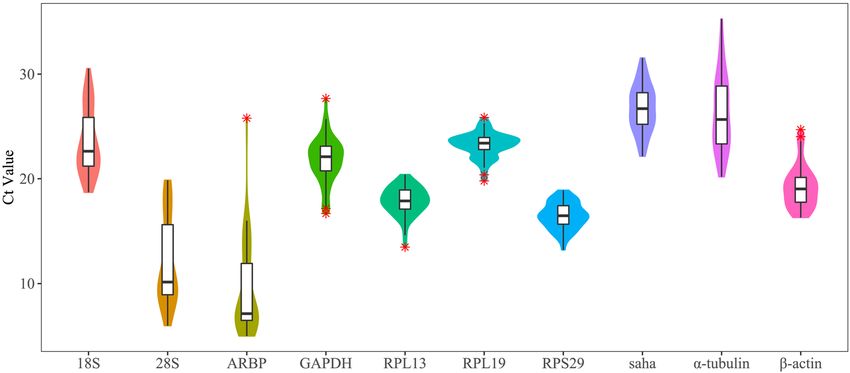
www.nature.com/scientificreports/
fundamental biological processes are frequently used as reference genes, such as 18S rRNA, 28S rRNA, actins,
glyceraldehyde-3-phosphate dehydrogenase (GAPDH)15,16, α-tubulin17, and ARBP18. Filby et al.19 recommend
the use of 18S rRNA, ribosomal protein l8 (rpl8), hypoxanthine phosphoribosyltransferase 1 (hprtI), and tata
box binding protein (tbp) as the reference genes in qRT-PCR studies of the effects of estrogen in fish. M a20 et.al
thought beta-actin (β-actin) and elongation factor EF1 alpha (ef1-α) were the best reference genes for qRT-PCR
analysis in the liver and head kidney of rainbow trout (Oncorhynchus mykiss) under heat stress. Liao et al.21.
believed that RPL19, ef1-α, 18S rRNA, and RPL13 were suitable reference genes for the study of tiger puffer
(Takifugu rubripes) in different tissues. Pei et al.22 reported that GAPDH could be used as a suitable reference for
nuclear reprogramming in zebrafish (Danio rerio).
Generally, the optimal reference genes should be stably expressed in all of the organs under the various test
conditions. However, a growing number of research reports have suggested that the stability levels of traditional
housekeeping genes, which have served as reference genes, are inconsistent under different experimental con-
ditions. For example, Olsvik et al.23 evaluated six reference genes, including 18S, S20 ribosomal protein (S20),
β-actin, GAPDH, and two paralog genes encoding elongation factor 1A (EF1AA and EF1AB), in eight tissues
(gill, liver, head kidney, spleen, thymus, brain, muscle, and posterior intestine) of Atlantic salmon (Salmo salar)
cultured in normal or smoltification conditions, and they found that EF1AB was the best reference gene, whereas
Jorgensen et al.24 reported that the combination of 18S rRNA, EF1A, and RNA polymerase I (RPL1) was the best
normalization method for qRT-PCR in immune-related organs despite viral infection. Ma et al.20 and Shekh
et al.25 also demonstrated that the optimum reference genes for rainbow trout varied in different tissues and
experimental conditions. Therefore, it is essential to characterize and evaluate whether selected candidate refer-
ence genes are stably expressed under different test conditions and yield reliable r esults26.
Here, initially, the practical problem of using qRT-PCR technology for taimen research was addressed. We
used four methods, geNorm27, NormFinder28, B estKeeper29, and R efFinder30, to evaluate the stability of 10
candidate reference genes in different taimen tissues under different temperature conditions. To validate the
selected reference genes, the heat shock protein g enes31 hsp60 and hsp70 were selected as targets to assess the
performance of the selected reference genes in different conditions.
Methods and materials
Ethics statement. All of the experiments involving the handling and treatment of fish in this study were
approved by the Animal Care and Use Committee of the Heilongjiang River Fisheries Research Institute of
Chinese Academy of Fishery Sciences (HRFRI). The methods were carried out in accordance with approved
guidelines. Before samples were collected, all of the fishes were euthanized in fresh 250 mg/L MS222 solution
(Sigma, Darmstadt, Germany). In addition, we followed the ARRIVE guidelines (https://arriveguidelines.org).
Fish source and heat‑stress experimental settings. The fishes used in this study were cultured at the
Bohai Cold Fish Experimental Station of the Heilongjiang River Fisheries Research Institute of Chinese Acad-
emy of Fishery Sciences(HRFRI). Sixty healthy individuals with body weights of 15 ± 5.0 g were used to carry out
high-temperature stress experiments. The fishes were first cultured for 3 weeks at 18 °C in a recirculating culture
system containing three 0.3 m3 tanks to acclimate to the environment. They were fed a commercial diet twice
a day throughout the study. For temperature-stress experiments, 60 individuals were randomly divided into 8
groups. Heat stress began in all eight groups simultaneously. Fishes of each group were also cultured in a 0.3 m 3
tank with recirculation, water filtration, an oxygen supplier, and temperature control. During the experiment,
the dissolved oxygen was maintained at higher than 8 mg/L, and the ammonia concentration was maintained
below 0.01 mg/L by exchanging water with the same temperature. Five temperatures in a 2 °C gradient, 18, 20,
22, 24, and 26 °C, were used, and the water temperature was controlled at ± 0.5 °C with an automatic water tem-
perature controller (Sensen Group Co., Ltd., China). Fishes were randomly sampled after 24 h in water at the
target temperatures of 18, 20, 22, and 24 °C. Our pilot study found that the fishes started to die when the water
temperature rose to 26 °C. Thus, we took samples at 4, 24, 48, and 72 h as the water temperature rose from 24 to
26 °C. In summary, a total of eight heat-stress experiments (named temperature–time) were carried out (Fig. 1):
18 °C-24 h, 20 °C-24 h, 22 °C-24 h, 24 °C-24 h, 26 °C-4 h, 26 °C-24 h, 26 °C-48 h, and 26 °C-72 h. In each experi-
ment, five fishes were randomly chosen for tissue dissection.
Sample collection and RNA extraction. For each individual, six tissues, namely, the liver, blood, heart,
brain, gill, and skin were collected for total RNA extraction. After euthanizing the fish with 250 mg/L fresh
MS222 (Sigma, Darmstadt, Germany) solution, the peripheral blood was first collected from the caudal vein
using a syringe and was mixed with 1:1 anticoagulant (30 mM disodium citrate, 0.34 M NaCl, and 10 mm EDTA-
Na2; pH 7.5). The other five tissues were then dissected. The tissues were stored in liquid nitrogen until total RNA
was extracted using TRIzol reagent (Thermo Fisher, CA, USA) following the recommended protocol17. After
treatment with DNaseI (Fermentas, MD, USA) to eliminate genomic DNA, the RNA quality was assessed using
a 1.0% agarose gel and a Nano Drop 8000 Spectrophotometer (Thermo Fisher, CA, USA), and the RNA quantity
was measured using a Qubit3 kit (Thermo Fisher, CA, USA). The RNA with an OD260/OD280 value that ranged
from 1.8 to 2.0, and a concentration ≥ 200 ng/μL was considered for qRT-PCR analysis.
Reference gene selection and primer design. Using the transcriptome published by T
ong8, the tran-
script sequences of 10 genes, 28S rRNA, GAPDH, ARBPR, 18S rRNA, β-actin, RPS29, RPL13, RPL19, Saha, and
α-tubulin, were determined for qRT-PCR primer design. The primers were first designed using Primer3 https://
primer3plus.com/ (Table 1) and then aligned to the taimen transcriptome using a BLAST search to confirm the
Scientific Reports | (2022) 12:313 | https://doi.org/10.1038/s41598-021-03872-x 2
Vol:.(1234567890)www.nature.com/scientificreports/
Figure 1. Heat stress experimental procedure. The X-axis represents the duration of the temperature stress, the
Y-axis represents the temperature, and the dashed lines indicate the sampling time points.
Gene Lift primer Right primer
Accession number (Full Name) (5′-3′) (5′-3′)
18S rRNA
HAGJ01000001 CGTTCTTAGTTGGTGGAGCG AACGCCACTTGTCCCTCTAA
(18S ribosomal RNA)
Saha
HAGJ01162991 TGGAGGGATGGCTGAACATT AGAGCACTGGAGGAAACACA
(S-adenosyl-L-homocysteine hydrolase)
GAPDH
HAGJ01029436 (Glyceraldehyde-3-phosphate dehydro- GTCTTCTGGGTAGCGGTGTA ACCATCGTCAGCAATGCATC
genase)
RPL13
HAGJ01015081 GGCCATCTTGAGTTCCTCCT GCACCATTGGCATCTCTGTT
(ribosomal protein L13)
ARBP
HAGJ01017568 GGGCTTTGTCTTCACCAAGG CTTCTCAGGACCAAGCCCAG
(attachment region binding protein)
28S RNA
HAGJ01147709 GTCCTTCTGATCGAGGCTCA GGAGTTTACCACCCGCTTTG
(28S ribosomal RNA)
β-actin
HAGJ01168534 TCTACGAAGGCTACGCTCTG CAGCTTCTCCTTGATGTCGC
(actin, beta)
RPL19
HAGJ01117629 ACACGGGCATAGGTAAGAGG TCGATTTTCTTGGCCTCCCT
(ribosomal protein L19)
RPS29
HAGJ01023957 TGGGACATCAGAGCCTCTAC CTGGCGGCACATGTTGAG
(ribosomal protein S29)
α-tubulin
HAGJ01091547 CGAGCCATACATCACACACG TGCAATTGGGTGTTGATCCA
(alpha-Tubulin)
Hsp60
HAGJ01009947 GACATCATCAGACGAGCCCT ACGTACTCTCCTTCCATGGC
(heat shock protein 60)
Hsp70
HAGJ01160617 CCGCCTGGTTAGTCACTTTG AGTGTTCTCTTGGCCCTCTC
(heat shock protein 60)
Table 1. Primer sequences and qPCR efficiencies of the 10 candidate taimen reference genes.
s pecificity32. Primers that matched non-target genes with less than three mismatched bases were eliminated. The
primers were synthesized by GENEWIZ Co. (Suzhou, China).
Quantitative real‑time PCR. The cDNA was synthesised using a RevertAid First-Strand cDNA Synthesis Kit
(Fermentas, MD, USA) with oligo(dT)18 as the primer and stored at − 20 °C. Before the expression levels of the 10
candidate genes were detected using qRT-PCR, the specificity of the primers was confirmed using conventional
PCR. The PCR was carried out in a 10 μL volume, which included 1 μL cDNA from the heart (50 ng/μL), 5 μL
2 × DreamTaq Green PCR master Mix (Thermo Fisher, CA, USA), 0.5 μL of each primer (10 µM), and 3 μL H 2O.
The amplification was carried out using an ABI9700 thermocycler (Thermo Fisher, CA, USA), and the PCR pro-
gram was set as follows: 95 °C for 3 min, followed by 30 cycles of 95 °C for 30 s, 60 °C for 30 s, and 72 °C for 30 s,
and a final temperature of 72 °C for 5 min. The PCR products were detected using 2% agarose gel electrophoresis.
The qRT-PCR was carried out in a 10-μL volume that included 1 μL cDNA (50 ng/μL), 5 μL 2 × Luna universal
SYBR qPCR Master Mix (New England Biolabs, MA, USA), 0.5 μL of each primer (10 µM), and 3 μL H 2O. The
Scientific Reports | (2022) 12:313 | https://doi.org/10.1038/s41598-021-03872-x 3
Vol.:(0123456789)www.nature.com/scientificreports/
Figure 2. The specificities of the primer pairs for qRT-PCR amplification. The PCR product for each gene was
confirmed using 2% agarose gel electrophoresis. Lane 1: β-actin; Lane 2: RPL19; Lane 3: RPL13; Lane 4: RPS29;
Lane 5: ARBP; Lane 6: α-tubulin; Lane 7: 28S rRNA; Lane 8: GAPDH; Lane 9: 18S rRNA; Lane 10: Saha.
amplification program was as follows: 95 °C for 15 s, followed by 40 cycles of 95 °C for 15 s and 60 °C for 30 s.
A melting curve was performed from 60 to 95 °C. The qRT-PCR was performed with a MicroAmp™ Optical
384-well Reaction Plate (Thermo Fisher, CA, USA) in QuantStudio Flex 6 (Thermo Fisher, CA, USA). Three
technological replicates were used for each sample. To calculate the qRT-PCR efficiency of each gene, 10-, 100-,
and 1,000-fold diluted cDNA samples were used to create a standard curve, and a linear regression model was
built with the log10 (concentration) as the independent variable. The corresponding qRT-PCR efficiencies (E)
were calculated using the following equation: E = [10(− 1/slope) − 1] × 10033,34.
Stability analysis of candidate reference genes. The relative expression levels of the candidate reference genes
were calculated using Ct values and amplicon mean amplification efficiencies24. To assess the stability levels of
the 10 reference genes, four programs, namely, g eNorm27, NormFinder28, BestKeeper29, and R efFinder30, were
used. The Ct values of the 10 candidate genes were analyzed from 48 experiments having 2 experimental factors.
The first factor was the six tissues (blood, heart, brain, gill, skin, and liver), and the second factor was the eight
sets of different heat-stress conditions: 18 °C-24 h, 20 °C-24 h, 22 °C-24 h, 24 °C-24 h, 26 °C-4 h, 26 °C-24 h,
26 °C-48 h, and 26 °C-72 h.
Expression of hsp60 and hsp70. Heat shock proteins (HSPs) can decrease the oxidative stress induced by ther-
mal stress36 and can be biomarkers of thermal stress37. Because peripheral blood mononuclear cells could be
collected without harming the fish and expressed H SPs38, and HSPs play an important role in neurodevelopment
39–41
and neuroinflammation , which could protect the brain from heat stress, we analyzed the expressed levels of
hsp60 and hsp70 in blood and brain tissues to validate the selected reference genes and verify whether hsp60 and
hsp70 were related to heat stress in taimen and could be used as marker genes to study the physiological func-
tions of taimen under heat stress.
We used samples from heat stress conditions of 18 °C-24 h, 20 °C-24 h, 22 °C-24 h, 24 °C-24 h, and 26 °C-24 h
to perform the qRT-PCR of hsp60 and hsp70, the samples from 18 °C-24 h were used as control. The qRT-PCR
volume and program for hsp60 and hsp70 were the same as in the above description. The primers are listed in
Table 1. The expression levels were calculated using 2 -ΔΔct. To validate the selected reference genes, five different
normalization methods were applied to blood and brain samples: normalization based on (i) the most stable
gene; (ii) the second most stable gene; (iii) the first and second most stable genes; (iv) the most unstable gene;
and (v) the second most unstable gene.
Results and analysis
Specificity of the candidate genes. The specificity levels of the primers were confirmed using conven-
tional PCR and 2% agarose gel electrophoresis. The results showed that a single band for each gene was detected,
and no dimers or non-specific amplified bands occurred (Fig. 2), which indicated that the designed primers were
appropriate for qRT-PCR.
Quantitative real‑time PCR analysis of reference genes. The qRT-PCR analysis using the fluores-
cent SYBR dye showed that the melting curves of all of the amplicons presented single distinct signal peaks,
which indicated that the primers for the 10 reference genes were appropriate for quantifying their expression
levels. The expression abundance of each gene was represented by the Ct value, with a high Ct value indicating a
low gene expression abundance35. The Ct values of the 10 candidate genes varied among tissues and heat-stress
conditions, ranging from 4.99 to 30.53 (Fig. 3, Supplementary Figure S2 and S3). Transcripts of ARBP were
the most abundant, followed by those of 28S rRNA and RPS29, whereas those of Saha were the least abundant
(Fig. 3, Supplementary Figure S2 and S3). In the skin, blood, and brain, RPL13 presented the minimum coef-
ficient of variation (CV) with mean CT values of 18.37, 19, and 16.84, respectively, and CV values of 0.77%,
0.75%, and 1.02%, respectively (Supplemental Table S1). In the heart, liver, and gill, RPL19 presented the mini-
mum CV with mean CT values of 22.78, 22.31, and 23.10, respectively, and CV values of 0.83%, 1.90%, and
0.66%, respectively (Supplemental Table S1). RPS29 also presented the minimum CV (1.90%) in the liver with
a mean CT value of 16.11 (Supplemental Table S1). Considering the different heat-stress conditions, RPS29 was
the gene with the minimum deviation of CT value under five experimental conditions, including 18 °C-24 h,
24 °C-24 h, 26 °C-4 h, 26 °C-24 h, and 26 °C-48 h, with mean CT values of 15.79, 17.08, 15.78, 15.65, and 18.02,
respectively, and CV values of 1.08%, 0.81%, 0.51%, 1.61%, and 0.27%, respectively (Supplementary Table S2). To
investigate whether the gene expression abundance was significantly different in tissues and under different heat
Scientific Reports | (2022) 12:313 | https://doi.org/10.1038/s41598-021-03872-x 4
Vol:.(1234567890)www.nature.com/scientificreports/
Figure 3. The distributions of the Ct values of 10 candidate reference genes in different experiments. The
distributions are displayed using violin and box plots; * indicate the outliers.
stress conditions, we performed a two-way analysis of variance (ANOVA) for each gene and found that the CT
values of each gene were significantly different in tissues and under different heat stress conditions. The statisti-
cal effect sizes of tissues ranged from 0.22 to 0.63, and those of heat stress condition ranged from 0.22 to 0.75
(Supplementary Table S3). A small effect size of a factor means the influence of this factor on CT values is neg-
ligible. According to the effect sizes of tissues and heat stress conditions, the expression abundance of α-tubulin
was least affected by tissues, followed by 28S and RPL19, whereas the expression abundance of RPL19 was least
affected by heat stress conditions, followed by GAPDH, RPL13 and RPS29. In total, RPL19, RPS29, and RPL13
presented as more stable than the other genes despite the varying tissues and heat-stress conditions.
Stability evaluation using geNorm. The stability levels of the reference genes were assessed by comput-
ing the expression stability (M) values among samples using geNorm. A high M value represents less s tability27.
The M values calculated using geNorm software indicated that the most stable genes varied among the different
experiments (Fig. 4). In the liver, RPS29 and RPL13 were the most stably expressed genes, whereas in the brain,
RPS29 and β-actin were the most stably expressed genes. In the skin and heart, RPL19 and GAPDH were the
most stably expressed genes. RPL13 and RPL19 were the most stably expressed genes in the gill, whereas RSP29
and RPL19 were the most stably expressed genes in the blood.
Stability evaluation using NormFinder. The gene expression stability levels, as evaluated by Nor-
mFinder software, are listed in Table 2. The stability levels of genes differed among the 48 experiments. The
most stable reference genes were β-actin and RPS29 in the liver and brain, whereas the most unstable reference
genes were 28S rRNA and ARBPR. In the skin and heart, RPS29 and Saha were the most stably expressed genes,
whereas 28S RNA, 18S rRNA, and α-tubulin were the least stably expressed genes. In the gill and blood, Saha and
GAPDH were the most stable reference genes, whereas 28s RNA, α-tubulin, and ARBP were the most unstable
reference genes.
Stability evaluation using BestKeeper. The stable expression of the candidate reference genes was also
analyzed using BestKeeper. In this program, the average Ct value of each reaction was used to analyze the stabil-
ity of each candidate reference gene. The standard deviation (SD) and coefficient of variation (CV) were calcu-
lated by BestKeeper based on the Ct v alues14. The most stable reference genes were represented by the lowest
CV and SD (CV ± SD) values. The gene ranking suggested by BestKeeper is shown in Table 3. In brief, RPS29,
RPL13, and RPL19 were determined to be the most reliable reference genes in all of the tissues under different
heat-stress conditions, whereas ARBP, 28S rRNA, α-tubulin, and 18S rRNA showed the highest CV ± SD values,
which suggested that their expression levels were very unstable.
Stability evaluation using RefFinder. Although geNorm, NormFinder, and BestKeeper generated dif-
ferent stability rankings because of their different algorithms, the top five genes were consistent. Furthermore,
RefFinder was used to assess the stability of the 10 reference genes, and its results were combined with those of
the other three methods to produce the final ranking (Table 4). In the liver and skin under different heat-stress
conditions, the most stable reference gene was RPS29, followed by RPL13. In the gill and blood, the most stable
reference genes were RPL19 and Saha, whereas in the heart, the two most stable genes were RPS29 and RPL19.
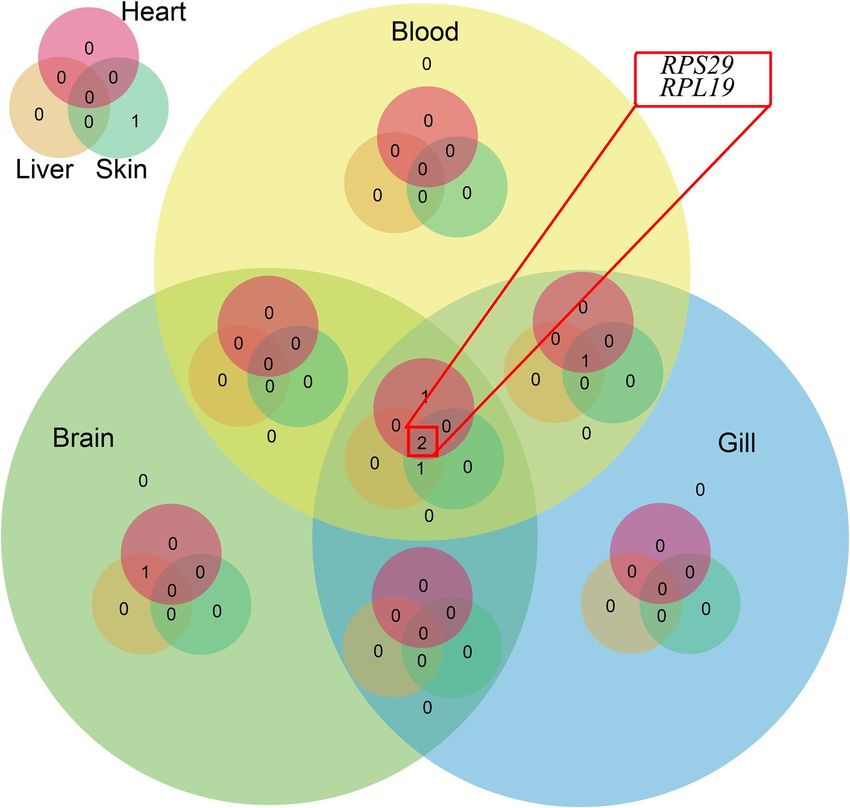
In the brain, β-actin and RPS29 were the most stably expressed genes. A Venn diagram was constructed using
the five most stably expressed genes from the six tested tissues, and it indicated that RPS29 and RPL19 were the
most suitable reference genes for the six tissues, as well as the different heat-stress conditions, followed by Saha
and RPL13 (Fig. 5).
Scientific Reports | (2022) 12:313 | https://doi.org/10.1038/s41598-021-03872-x 5
Vol.:(0123456789)www.nature.com/scientificreports/
Figure 4. Expression stability values (M) of 10 candidate reference genes under heat-stress conditions as
assessed by geNorm. Smaller M values represent more stable gene expression in different tissues.
Validation of the selected reference genes. The qRT-PCR analysis of hsp60 and hsp70 showed that
the expressed levels of hsp60 and hsp70 significantly increased in the blood of taimen under all of the heat-
stress conditions if RPL19, RPS29, and their combination were used as reference genes. However, if 28S rRNA
and ARBP were used as reference genes, hsp60 and hsp70 were significantly differentially expressed only in
the blood of taimen under heat-stress conditions of 24 °C-24 h and 26 °C-24 h (Fig. 6). In the brain tissues, if
RPL19, RPS29, and their combination was used as reference genes, the expression of hsp60 and hsp70 in taimen
under heat stress showed significant differences compared to that under normal conditions (18 °C-24 h). The
Scientific Reports | (2022) 12:313 | https://doi.org/10.1038/s41598-021-03872-x 6
Vol:.(1234567890)www.nature.com/scientificreports/
Liver Brain Skin Gill Heart Blood
Rank Gene Stable value Gene Stable value Gene Stable value Gene Stable value Gene Stable value Gene Stable value
1 β-actin 0.710 β-actin 0.379 Saha 0.115 Saha 0.309 Saha 0.208 Saha 0.234
2 RPS29 0.719 RPS29 0.641 RPS29 0.492 GAPDH 0.559 RPS29 0.319 GAPDH 0.252
3 GAPDH 0.909 Saha 0.993 β-actin 0.780 RPS29 0.651 β-actin 0.707 β-actin 0.680
4 RPL13 1.013 α-tubulin 1.537 RPL13 0.828 18S 0.740 GAPDH 0.786 RPS29 0.861
5 18S 1.061 RPL13 1.596 GAPDH 0.909 β-actin 0.940 ARBP 0.840 18S 0.982
6 α-tubulin 1.204 GAPDH 1.643 18S 0.963 RPL19 0.943 RPL19 0.894 RPL19 1.096
7 RPL19 1.233 18S 1.703 RPL19 1.052 RPL13 0.961 α-tubulin 1.061 ARBP 1.171
8 Saha 1.396 RPL19 1.831 ARBP 1.198 ARBP 1.332 RPL13 1.129 RPL13 1.258
9 ARBP 1.842 28S 2.694 α-tubulin 1.481 28S 1.745 18S 1.198 28S 1.542
10 28S 2.279 ARBP 4.506 28S 2.248 α-tubulin 2.944 28S 1.499 α-tubulin 2.913
Table 2. Expression stability values of 10 candidate taimen reference genes under heat-stress conditions as
assessed by NormFinder.
Liver Brain Skin Gill Heart Blood
Rank Gene CV Gene CV Gene CV Gene CV Gene CV Gene CV
1 RPL19 1.54 RPL13 0.72 RPL13 0.58 RPL19 0.49 RPL19 0.59 RPL19 0.59
2 RPL13 1.61 RPL19 0.83 RPL19 0.67 RPL13 0.66 GAPDH 0.68 RPL13 0.60
3 β-actin 1.64 RPS29 1.09 RPS29 0.71 RPS29 0.68 RPS29 0.88 RPS29 0.68
4 RPS29 1.65 β-actin 1.39 GAPDH 0.84 GAPDH 0.84 β-actin 0.89 GAPDH 0.85
5 GAPDH 1.66 GAPDH 1.74 β-actin 0.98 Saha 1.06 RPL13 1.00 Saha 1.24
6 Saha 2.27 Saha 1.77 Saha 1.09 β-actin 1.23 Saha 1.23 β-actin 1.96
7 α-tubulin 2.38 α-tubulin 2.37 ARBP 1.46 18S 1.99 ARBP 1.98 18S 2.10
8 18S 3.24 18S 3.45 18S 2.27 ARBP 2.41 α-tubulin 2.06 ARBP 2.17
9 ARBP 4.19 28S 4.62 α-tubulin 2.54 28S 2.77 28S 2.31 28S 2.85
10 28S 4.69 ARBP 5.55 28S 3.33 α-tubulin 3.84 18S 2.38 α-tubulin 3.15
Table 3. Expression stability values of 10 candidate reference genes calculated by the Best Keeper. The stability
of the reference genes is represented by the coefficient of variation (CV), and the most stable gene has the
lowest CV value.
Liver Brain Skin Gill Heart Blood
Stability ranking Gene Gene Gene Gene Gene Gene
1 RPS29 β-actin RPS29 RPL19 RPS29 Saha
2 RPL13 RPS29 RPL13 Saha RPL19 RPL19
3 β-actin RPL19 Saha RPS29 GAPDH RPS29
4 RPL19 RPL13 GAPDH RPL13 Saha GAPDH
5 GAPDH Saha RPL19 GAPDH β-actin RPL13
6 18S GAPDH β-actin β-actin ARBP β-actin
7 Saha 18S 18S 18S RPL13 18S
8 α-tubulin α-tubulin ARBP ARBP α-tubulin ARBP
9 ARBP 28S α-tubulin 28S 18S 28S
10 28S ARBP 28S α-tubulin 28S α-tubulin
Table 4. Expression stability values of 10 candidate taimen reference genes under heat-stress conditions as
assessed by RefFinder. Genes marked with bold were the optimal combination of reference genes in the six
tissues.
expression of hsp60 and hsp70 only presented significant differences in taimen under heat-stress conditions of
22 °C-24 h and 24 °C-24 h if 28S was used as reference, and only presented significant differences in taimen
under heat-stress conditions of 26 °C-24 h if ARBP was used as reference (Fig. 6).
The trends in the significance of the hsp60 and hsp70 expression profiles at different temperatures (p < 0.05)
were consistent when RPS29 + RPL19, RPS29, or RPL19 were used as reference gene(s). In comparison, when 28S
Scientific Reports | (2022) 12:313 | https://doi.org/10.1038/s41598-021-03872-x 7
Vol.:(0123456789)www.nature.com/scientificreports/
Figure 5. A Venn diagram of the top five candidate taimen reference genes. RPS29 and RPL19 (marked with
the red rectangle) were stable in all of the tissues, which indicated that they are suitable reference genes for the
six tissues, as well as different heat-stress conditions.
rRNA or ARBP was used as the reference gene, the significant differences in the target genes’ expression levels
were completely opposite among different groups (p < 0.05).
To test whether the reference genes influenced the relative quantification of hsp60 and hsp70 in the blood and
brain tissues, we performed a two-way ANOVA and found that the reference genes did not influence the relative
quantification of hsp60 and hsp70 in blood(P > 0.05), the variance mainly attributed to samples under differ-
ent heat stress conditions, the statistical effect sizes of reference genes were 0.06 and 0.03 for hsp60 and hsp70,
respectively, and the effect sizes of heat stress conditions were 0.46 and 0.88 for hsp60 and hsp70, respectively.
Whereas reference genes significantly affected the relative quantification of hsp60 and hsp70 in brain(P < 0.01),
there were significant differences of relative quantification between RPL19, RPS29, RPL19 combined with RPS29
against ARBP, 28S (P < 0.01), the effect sizes of reference genes were same for hsp60 and hsp70, with the value of
0.48, and the effect sizes of heat stress conditions were 0.26 and 0.48 for hsp60 and hsp70, respectively.
Discussion
Taimen is a high-quality cold freshwater fish. Owing to its water temperature restrictions, it is mainly cultured
in southwestern and northern China, but water resources are limited in these regions42. Whether it is possible
to breed high-temperature-tolerant varieties using gene function and molecular research to expand the culture
area for taimen has not been reported. Therefore, this study focused on the importance of water temperature
and screened for taimen reference genes suitable for use when fishes were grown under high-temperature condi-
tions. These findings lay a foundation for the study of gene expression during temperature changes and provides
a theoretical basis for breeding new taimen varieties with high temperature tolerance.
With the development of functional genomics, gene expression analysis methods are also e volving43. Real-
time fluorescence quantitative PCR technology is a conventional gene expression analysis method. To eliminate
errors caused by technicians or template factors during qRT-PCR, reference genes are often used to normalize
the expression levels of target g enes44. The ideal reference gene should be stably expressed in all tissues and cell
types without being affected by internal or external f actors27. However, owing to differences in species 45,46, tis-
sue functions47,48, and metabolic c haracteristics49,50, it is almost impossible to obtain universal reference genes.
Scientific Reports | (2022) 12:313 | https://doi.org/10.1038/s41598-021-03872-x 8
Vol:.(1234567890)www.nature.com/scientificreports/
Figure 6. Validation of candidate taimen reference gene stability levels. The expression levels of hsp60 and
hsp70 in the blood and brain under different heat stress conditions were determined using various candidate
references genes. Data represent the means ± SEMs of the log10 values of three biological replicates. Different
lowercase letters in the same group indicate significant differences among treatments within each normalization
factor (p = 0.05, Tukey’s HSD test).
Many researchers optimize the reference genes used for different species. For example, RPL13 is the most
stable internal reference gene in various tissues of naked schizothoracin (Oxygymnocypris stewarti)51, whereas
Scientific Reports | (2022) 12:313 | https://doi.org/10.1038/s41598-021-03872-x 9
Vol.:(0123456789)www.nature.com/scientificreports/
UBCE and 18S rRNA are the most stable genes in various tissues of Nile tilapia (Oreochromis niloticus)52. RPL17
and ACTB have the highest stable expression levels in various tissues of Korean rockfish (Sebastes schlegelii)53,
whereas B2M and 18S rRNA have the highest stable expression levels in pompano (Trachinotus ovatus)54. In
addition, in different tissues of the same species and under varied experimental conditions, the selection of
internal reference genes is also different. For example, sep15 and metap1 have been selected as stably expressed
reference genes in different zebrafish tissues, but RPL13a and RP1P0 are the most stably expressed genes after
chemotherapy stimulation55. Therefore, it is necessary to characterize the expression of the reference genes under
specific experimental conditions.
Four software programs, geNorm, NormFinder, BestKeeper, and RefFinder, are commonly used to assess the
stability of reference genes. The geNorm software27 may be used to screen reference genes for real-time PCR and
to determine the number of optimal reference genes under specific conditions. N ormFinder28 uses a calculation
principle similar to that of geNorm. However, NormFinder not only compares the expression differences of
candidate genes, but it also calculates the variation between sample groups. BestKeeper29 analyzes the expression
values of reference and target genes. R efFinder30 evaluates reliable reference genes, including miRNAs, for gene
expression analyses by integrating the main calculation programs currently available (geNorm, NormFinder,
BestKeeper, and the comparative delta-Ct method). It assigns appropriate weights to individual genes according
to the ranking of each program, and then it calculates the geometric means of its weights to form a final ranking.
These four software programs have their own characteristics and should be considered comprehensively. In this
study, we used a combination of these four programs to identify stably expressed taimen genes in different tis-
sues during temperature changes. geNorm identified RPS29, RPL13 and RPL19 as being the most stable, whereas
28S rRNA, ARBPR, and β-actin were the most unstable. This was consistent with the results of BestKeeper.
NormFinder identified RPS29, β-actin, and Saha as being more stable in the tissues than RPL13 and RPL19. This
differed from the results of geNorm and BestKeeper. The inconsistent results might be due to the co-regulation
of the reference genes. The four software were designed dependent on the assumption that the evaluated genes
are not co-regulation, in this study, the 10 reference genes were involved in cell skeleton, metabolism, and ribo-
some, although the public databases show that there is no connection between them, it is unclear whether they
are co-regulation. However, all three programs identified 28S rRNA, ARBP, and 18S rRNA as being unstable.
The comprehensive analysis by RefFinder identified RPS29 and RPL19 as being stable in all of the tested tissues,
followed by RPL13 and Saha, which was almost consistent with the results of the first three analyses.
The stability of reference genes can also be affected by gene duplication. Salmonids underwent the fourth
round whole genome duplication event, which caused many genes to replicate followed by pseudogenization,
neofunctionalization, and duplication. These paralogous genes might differentially express in tissues and cause
difficulty in designing primers to amplify specific copies due to the high similarity between paralogous genes.
Among the 10 reference genes selected in this study, the primers of RPL19, RPS29, and alpha-tubulin could be
used to amplify one gene by aligning the primer sequences to the huchen (Hucho hucho) genome, two or more
homologous genes of the other primers were obtained which might affect the expression stability in tissues.
Therefore, gene duplication should be considered to design primers for reference genes, which might hinder the
gene expression analysis in non-model species without genomic background information.
To validate the reference genes, we carried out the expression analysis of hsp60 and hsp70 in the blood and
brain. When the most stable genes were used to normalize the CT values, the expression of the target gene in
the blood and brain significantly increased under heat stress and the expression patterns were consistent. When
unstable genes (28S and ARBP) were used to normalize the CT values, the expression patterns of the target
genes in the blood and brain were different and the expression levels showed fluctuating changes, which were
also different from the results normalized by RPS29, RPL19, and their combination. Although few studies have
reported the expression profiles of hsp60 and hsp70 in the blood and brain under heat stress, the combination of
RPL19 and RPS29 might be an optimal reference gene set based on the assumption that the expression profiles
should be similar regardless of the reference genes used. These results further demonstrate the importance of
selecting the right reference gene for analytical purposes.
As immunomodulators56, heat shock proteins have been widely tested as heat-stress indicator proteins in fish.
For example, Liu et al.57 found that HSP40, HSP70, and HSP90 family members were significantly upregulated
in the gill and liver of hybrid catfish under heat stress by RNA-Seq analysis; Smith et al.58 showed that hsp60,
hsp70, and hsp90A were significantly up-regulated in the liver of crimson spotted rainbow fish (Melanotaenia
duboulayi) under heat stress; and Shi et al.59 found that hsp60 was significantly up-regulated in the gill, liver,
spleen, and head kidney of rainbow trout after more than 4 h at 25 °C, which was similar to the results of the
present study. In the present study, the expressed levels of hsp70 in the blood were significantly increased and
presented an upward trend as the water temperature rose, which implied that the expression of hsp70 in blood
might be a potential and convenient marker for heat stress in taimen.
RPS29, RPL13, and RPL19 encode large ribosomal subunits, and they are highly conserved in eukaryotes.
They are not only involved in protein synthesis, but also in the processes of replication, transcription, RNA pro-
cessing, DNA repair, self-translational regulation, and developmental regulation. Therefore, these genes can be
used as an internal reference genes47. The present study showed that the expression levels of RPS29 and RPL19 in
different taimen tissues under heat-stress conditions were more stable compared with those of other candidate
reference genes. Therefore, we recommend RPS29 and RPL19 as reference genes for future studies in taimen.
Received: 22 June 2021; Accepted: 6 December 2021
Scientific Reports | (2022) 12:313 | https://doi.org/10.1038/s41598-021-03872-x 10
Vol:.(1234567890)www.nature.com/scientificreports/
References
1. Holcík, J., Hensel, K., Nieslanik, J. & Skácel, L. The Eurasian Huchen, Hucho hucho: largest salmon of the world (ed. Skácel, L.)
1–254 (Springer Netherlands, 1988).
2. Yin, J. et al. Age structure, sex ratio and growth of the taimen (Hucho taimen) in Wusuli River. Acta Zoologica Sinica 49, 687–692
(2003).
3. Yue, P. & Chen, Y. China Red Data Book Of Endangered Animals-pisces (ed. Chen, Y.) 114–115 (Beijing: Science Press, 1998).
4. Xu, W. et al. Preliminary study on artificial breeding technology of tetra fish. J. Fish. Sci. 010, 26–30 (2003).
5. Wang, J., Zhang, Y. & Yin, J. S. Study on the growth of Hucho taimen juvenile at different temperatures. Acta agriculturae boreali-
sinica 26, 274–277 (2011).
6. Wang, J., Kuang, Y., Tong, G. & Yin, J. Development of 12 polymorphic EST-SSR for endangered fish, Hucho taimen (Pallas). Indian
J. Anim. Sci. 81, 302–305 (2011).
7. Tong, G., Kuang, Y., Yin, J., Liang, L. & Sun, X. Isolation of microsatellite DNA and analysis on genetic diversity of endangered
fish, Hucho taimen (Pallas). Mol. Ecol. Notes 6, 1099–1101 (2006).
8. Tong, G. X. et al. De novo assembly and characterization of the Hucho taimen transcriptome. Ecol. Evol. 8, 1271–1285. https://doi.
org/10.1002/ece3.3735 (2018).
9. Tong, G. et al. First high-resolution genetic linkage map of taimen (Hucho taimen) and its application in QTL analysis of growth-
related traits. Aquaculture 529, 735680 (2020).
10. Mahanty, A., Purohit, G. K., Mohanty, S. & Mohanty, B. P. Heat stress-induced alterations in the expression of genes associated
with gonadal integrity of the teleost Puntius sophore. Fish Physiol. Biochem. 45, 1409–1417 (2019).
11. Wong, M. L. & Medrano, J. F. Real-time PCR for mRNA quantitation. Biotechniques 39, 75–85 (2005).
12. Bustin, S. A., Benes, V., Nolan, T. & Pfaffl, M. W. Quantitative real-time RT-PCR—A perspective. J. Mol. Endocrinol. 34, 597–601
(2005).
13. Klatte, M. & Bauer, P. Accurate real-time reverse transcription quantitative PCR. Methods Mol Biol. 479, 61–77 (2009).
14. Kong, F., Cao, M., Sun, P., Liu, W. & Mao, Y. Selection of reference genes for gene expression normalization in Pyropia yezoensis
using quantitative real-time PCR. J. Appl. Phycol. 27, 1003–1010 (2015).
15. Dheda, K. et al. Validation of housekeeping genes for normalizing RNA expression in real-time PCR. Biotechniques 37, 112–119
(2004).
16. Kok, J. B. et al. Normalization of gene expression measurements in tumor tissues: comparison of 13 endogenous control genes.
Lab. Invest. 85, 154–159 (2005).
17. Ferguson, B. S., Nam, H., Hopkins, R. G. & Morrison, R. F. Impact of reference gene selection for target gene normalization on
experimental outcome using real-time qRT-PCR in adipocytes. PLoS ONE 5, e15208. https://doi.org/10.1371/journal.pone.00152
08 (2010).
18. Brattelid, T. et al. Reference gene alternatives to Gapdh in rodent and human heart failure gene expression studies. BMC Mol. Biol.
11, 22 (2010).
19. Filby, A. L. & Tyler, C. R. Appropriate “housekeeping” genes for use in expression profiling the effects of environmental estrogens
in fish. BMC Mol Biol 8, 10 (2007).
20. Ma, F., Liu, Z., Huang, J., Kang, Y. & Wang, J. Evaluation of reference genes for quantitative real-time PCR analysis of messenger
RNAs and microRNAs in rainbow trout Oncorhynchus mykiss under heat stress. J Fish Biol 95, 540–554 (2019).
21. Liao, Z. et al. Screening of reference genes in tiger puffer (Takifugu rubripes) across tissues and under different nutritional condi-
tions. Fish Physiol. Biochem. https://doi.org/10.1007/s10695-021-01012-w (2021).
22. Pei, D.-S. et al. Zebrafish GAPDH can be used as a reference gene for expression analysis in cross-subfamily cloned embryos. Anal.
Biochem. 363, 291–293 (2007).
23. Olsvik, P. A., Lie, K. K., Jordal, A.-E.O., Nilsen, T. O. & Hordvik, I. Evaluation of potential reference genes in real-time RT-PCR
studies of Atlantic salmon. BMC Mol. Biol. 6, 21–21 (2005).
24. Jorgensen, S. M., Kleveland, E. J., Grimholt, U. & Gjoen, T. Validation of reference genes for real-time polymerase chain reaction
studies in Atlantic salmon. Mar. Biotechnol. (NY) 8, 398–408 (2006).
25. Shekh, K., Tang, S., Niyogi, S. & Hecker, M. Expression stability and selection of optimal reference genes for gene expression
normalization in early life stage rainbow trout exposed to cadmium and copper. Aquat. Toxicol. 190, 217–227 (2017).
26. Kaur, R. et al. Selection of suitable reference genes for normalization of quantitative RT-PCR (RT-qPCR) expression data across
twelve tissues of riverine buffaloes (Bubalus bubalis). PLoS ONE 13, e0191558. https://doi.org/10.1371/journal.pone.0191558
(2018).
27. Vandesompele, J. et al. Accurate normalization of real-time quantitative RT-PCR data by geometric averaging of multiple internal
control genes. Genome Biol. 3, research0034.0031. https://doi.org/10.1186/gb-2002-3-7-research0034 (2002).
28. Andersen, C. L., Jensen, J. L. & Ørntoft, T. F. Normalization of real-time quantitative reverse transcription-PCR data: A model-based
variance estimation approach to identify genes suited for normalization, applied to bladder and colon cancer data sets. Cancer Res.
64, 5245–5250 (2004).
29. Pfaffl, M. W., Tichopad, A., Prgomet, C. & Neuvians, T. P. Determination of stable housekeeping genes, differentially regulated
target genes and sample integrity: BestKeeper—Excel-based tool using pair-wise correlations. Biotech. Lett. 26, 509–515 (2004).
30. Xie, F., Xiao, P., Chen, D., Xu, L. & Zhang, B. miRDeepFinder: A miRNA analysis tool for deep sequencing of plant small RNAs.
Plant Mol. Biol. https://doi.org/10.1007/s11103-012-9885-2 (2012).
31. Tong, G. et al. Effects of heat stress on blood parameters and gene expressions of heat shock proteins in Hucho Taimen. Freshw.
Fish. 51, 23–28 (2021).
32. Lai, D. & Love, D. R. Automation of a primer design and evaluation pipeline for subsequent sequencing of the coding regions of
all human Refseq genes. Bioinformation 8, 365–368 (2012).
33. Koch, I. et al. Real-time quantitative RT-PCR shows variable, assay-dependent sensitivity to formalin fixation: implications for
direct comparison of transcript levels in paraffin-embedded tissues. Diagn. Mol. Pathol. 15, 149–156 (2006).
34. Giulietti, A. et al. An overview of real-time quantitative PCR: Applications to quantify cytokine gene expression. Methods 25,
386–401 (2001).
35. Nelissen, K., Smeets, K., Mulder, M., Hendriks, J. J. & Ameloot, M. Selection of reference genes for gene expression studies in rat
oligodendrocytes using quantitative real time PCR. J. Neurosci. Methods 187, 78–83 (2010).
36. Oksala, N. K. et al. Natural thermal adaptation increases heat shock protein levels and decreases oxidative stress. Redox Biol. 3,
25–28 (2014).
37. Tedeschi, J. N. et al. Increased expression of Hsp70 and Hsp90 mRNA as biomarkers of thermal stress in loggerhead turtle embryos
(Caretta Caretta). J. Therm. Biol. 47, 42–50 (2015).
38. Hunter-Lavin, C. et al. Hsp70 release from peripheral blood mononuclear cells. Biochem. Biophys. Res. Commun. 324, 511–517
(2004).
39. Dukay, B., Csoboz, B. & Tóth, M. E. Heat-shock proteins in neuroinflammation. Front. Pharmacol. 10, 920 (2019).
40. Miller, D. J. & Fort, P. E. Heat shock proteins regulatory role in neurodevelopment. Front. Neurosci. 12, 821 (2018).
41. Kim, N., Kim, J. Y. & Yenari, M. A. Anti-inflammatory properties and pharmacological induction of Hsp70 after brain injury.
Inflammopharmacology 20, 177–185 (2012).
Scientific Reports | (2022) 12:313 | https://doi.org/10.1038/s41598-021-03872-x 11
Vol.:(0123456789)www.nature.com/scientificreports/
42. Gao, Y. et al. Integrated assessment of water resources potential in the North China Region. Water Int. 31, 71–80 (2006).
43. Yegnasubramanian, S. & Isaacs, W. B. Modern Molecular Biology (Springer, 2010).
44. Lourenço, A. P., Mackert, A., Cristino, A. S. & Simões, Z. L. P. Validation of reference genes for gene expression studies in the
honey bee, Apis mellifera, by quantitative real-time RT-PCR. Apidologie 39, 372–385 (2008).
45. Mayfield, A. B., Hirst, M. B. & Gates, R. D. Gene expression normalization in a dual-compartment system: A real-time quantitative
polymerase chain reaction protocol for symbiotic anthozoans. Mol. Ecol. Resour. 9, 462–470 (2009).
46. Ivan Bower, N., Joachim Moser, R., Robert Hill, J. & Arabella Lehnert, S. Universal reference method for real-time PCR gene
expression analysis of preimplantation embryos. Biotechniques 42, 199–206 (2007).
47. Chen, X. J. et al. Selection of reference genes for quantitative real-time RT-PCR on gene expression in Golden Pompano (Trachi-
notus ovatus). Pol J Vet Sci 20, 583–594 (2017).
48. Olsvik, P. A., Softeland, L. & Lie, K. K. Correction: Selection of reference genes for qRT-PCR examination of wild populations of
Atlantic cod Gadus morhua. BMC Res. Notes 4, 456 (2011).
49. Zhang, Q.-L. et al. Selection of reliable reference genes for normalization of quantitative RT-PCR from different developmental
stages and tissues in amphioxus. Sci. Rep. 6, 37549 (2016).
50. Dang, W. & Sun, L. Determination of internal controls for quantitative real time RT-PCR analysis of the effect of Edwardsiella
tarda infection on gene expression in turbot (Scophthalmus maximus). Fish Shellfish Immunol 30, 720–728 (2011).
51. Sun, H. et al. Screening of reference genes of Real-time quantitative PCR in Stewart’ snaked high-Asian-carp Oxygymnocypris
stewarti. J. Dalian Ocean Univ. 34(03), 370–375 (2019).
52. Yang, C. G. et al. Evaluation of reference genes for quantitative real-time RT-PCR analysis of gene expression in Nile tilapia (Oreo-
chromis niloticus). Gene 527, 183–192 (2013).
53. Liman, M. et al. Selection of reference genes for reverse transcription quantitative real-time PCR normalization in black rockfish
(Sebastes schlegeli). Mar. Genomics 11, 67–73 (2013).
54. Gantasala, N. P. et al. Selection and validation of reference genes for quantitative gene expression studies by real-time PCR in
eggplant (Solanum melongena L). BMC Res. Notes 6, 312 (2013).
55. Xu, H. et al. Genome-wide identification of suitable zebrafish Danio rerio reference genes for normalization of gene expression
data by RT-qPCR. J. Fish Biol. 88, 2095–2110 (2016).
56. Zininga, T., Ramatsui, L. & Shonhai, A. Heat Shock Proteins as Immunomodulants. Molecules 23(11), 2846 (2018).
57. Liu, S. et al. RNA-Seq reveals expression signatures of genes involved in oxygen transport, protein synthesis, folding, and degrada-
tion in response to heat stress in catfish. Physiol. Genomics 45, 462–476 (2013).
58. Smith, S., Bernatchez, L. & Beheregaray, L. B. RNA-seq analysis reveals extensive transcriptional plasticity to temperature stress
in a freshwater fish species. BMC Genomics 14, 1–12 (2013).
59. Shi, H. N. et al. Short Communication: Effect of heat stress on heat-shock protein (Hsp60) mRNA expression in rainbow trout
Oncorhynchus mykiss. Genet Mol Res 14, 5280–5286 (2015).
Acknowledgements
This study was financially supported by the Central Public-interest Scientific Institution Basal Research Fund,
HRFRI (no. HSY201801Z and no. HSY202016PT), the Science Foundation Project of Heilongjiang Province (no.
LH2019C090 and no. QC201732), the Survey of Fishery Resources and Environment in Key Waters in Northeast
China, and the Central Public-interest Scientific Institution Basal Research Fund (no. 2020TD56). We thank
LetPub (www.letpub.com) for its linguistic assistance during the preparation of this manuscript.
Author contributions
Y.K., G. Tong, and J. Yin conceived the study; X.Y., L.D., T.Y., and H.X. analyzed the date and drew the figures;
X.Y. and G. Tong wrote the manuscript; T.Y., H.X., G. Tang, Y.Z., J.Y., and Y.K. revised the manuscript; and K.M,.
X.Y., L.D., and G. Tong collected the tissues samples and extracted RNA samples.
Competing interests
The authors declare no competing interests.
Additional information
Supplementary Information The online version contains supplementary material available at https://doi.org/
10.1038/s41598-021-03872-x.
Correspondence and requests for materials should be addressed to Y.K.
Reprints and permissions information is available at www.nature.com/reprints.
Publisher’s note Springer Nature remains neutral with regard to jurisdictional claims in published maps and
institutional affiliations.
Open Access This article is licensed under a Creative Commons Attribution 4.0 International
License, which permits use, sharing, adaptation, distribution and reproduction in any medium or
format, as long as you give appropriate credit to the original author(s) and the source, provide a link to the
Creative Commons licence, and indicate if changes were made. The images or other third party material in this
article are included in the article’s Creative Commons licence, unless indicated otherwise in a credit line to the
material. If material is not included in the article’s Creative Commons licence and your intended use is not
permitted by statutory regulation or exceeds the permitted use, you will need to obtain permission directly from
the copyright holder. To view a copy of this licence, visit http://creativecommons.org/licenses/by/4.0/.
© The Author(s) 2022
Scientific Reports | (2022) 12:313 | https://doi.org/10.1038/s41598-021-03872-x 12
Vol:.(1234567890)You can also read