Evaluating intervention strategies in controlling coronavirus disease 2019 (COVID-19) spread in care homes: An agent-based model
←
→
Page content transcription
If your browser does not render page correctly, please read the page content below
Infection Control & Hospital Epidemiology (2021), 42, 1060–1070
           doi:10.1017/ice.2020.1369

           Original Article

           Evaluating intervention strategies in controlling coronavirus disease
           2019 (COVID-19) spread in care homes: An agent-based model
           Le Khanh Ngan Nguyen MPH1                          , Susan Howick PhD1                  , Dennis McLafferty MSc2, Gillian H. Anderson BA1                                 ,
           Sahaya J. Pravinkumar MBBS, MPH, FFPH3, Robert Van Der Meer PhD1                                                    and Itamar Megiddo PhD1
           1
            Department of Management Science, Strathclyde Business School, University of Strathclyde, Glasgow, United Kingdom, 2Adult Services, Health & Social Care
           North Lanarkshire, Motherwell, United Kingdom and 3Department of Public Health, NHS Lanarkshire, Kirklands Hospital, Bothwell, United Kingdom

           Abstract
           Background: Care homes are vulnerable to widespread transmission of severe acute respiratory coronavirus virus 2 (SARS-CoV-2) with poor
           outcomes for staff and residents. Infection control interventions in care homes need to not only be effective in containing the spread of coro-
           navirus disease 2019 (COVID-19) but also feasible to implement in this special setting which is both a healthcare institution and a home.
           Methods: We developed an agent-based model that simulates the transmission dynamics of COVID-19 via contacts between individuals,
           including residents, staff members, and visitors in a care home setting. We explored a representative care home in Scotland in our base case
           and explore other care home setups in an uncertainty analysis. We evaluated the effectiveness of a range of intervention strategies in con-
           trolling the spread of COVID-19.
           Results: In the presence of the reference interventions that have been implemented in many care homes, including testing of new admissions,
           isolation of symptomatic residents, and restricted public visiting, routine testing of staff appears to be the most effective and practical
           approach. Routine testing of residents is no more effective as a reference strategy while routine testing of both staff and residents only shows
           a negligible additive effect. Modeling results are very sensitive to transmission probability per contact, but the qualitative finding is robust to
           varying parameter values in our uncertainty analysis.
           Conclusions: Our model predictions suggest that routine testing should target staff in care homes in conjunction with adherence to strict hand
           hygiene and using personal protective equipment to reduce risk of transmission per contact.
           (Received 27 August 2020; accepted 8 December 2020; electronically published 14 December 2020)

           As of July 15, 2020, ~24 million people had been infected with                                from hospitals, patients have to stay in hospitals longer than they
           severe acute respiratory coronavirus virus 2 (SARS-CoV-2) world-                              need, putting them at greater risk, adding to the pressure on hos-
           wide, and 3.4% of those infected have died.1 Many studies have                                pitals, and causing tremendous distress for many individuals.
           demonstrated that comorbidity and old age are associated with                                 Because vaccination for COVID-19 is currently unavailable, infec-
           poor outcomes among coronavirus disease 2019 (COVID-19)                                       tion control interventions within care homes and across settings
           patients.2,3 Care homes across the globe, where most residents                                are vitally important to protect the vulnerable residents and health-
           are elderly and have complex medical and care needs, have suffered                            care workers.
           devastating outcomes.4,5 High rates of mortality involving                                        Agent-based models (ABMs) have been used to study epidemic
           COVID-19 have been attributed to residents in this setting (eg,                               behavior and interventions and to mitigate them in the past couple
           40%–70% in Canada,6 33%–64% in European countries,5 and                                       of decades, leading to new insights. Although compartmental
           47% in Scotland7).                                                                            models have been popularly used to simulate transmission dynam-
              Care homes are integral to the wider healthcare system, and it is                          ics of infectious diseases at the population level, ABMs have been
           essential that they continue to function safely and effectively amid                          useful for understanding the effects of heterogeneous individual
           the COVID-19 pandemic to avoid increasing the pressure on the                                 characteristics and behavior in conjunction with the stochasticity
           acute-care sector. If care homes stop admitting patients discharged                           of transmission events. They have shown that individual character-
                                                                                                         istics such as age, comorbidity, and socio-spatial structures and
              Author for correspondence: Ms Le Khanh Ngan Nguyen, E-mail: nguyen-le-khanh-               contact patterns in different settings influence disease spread
           ngan@strath.ac.uk                                                                             and the effectiveness of interventions.8–12 Many of these factors
              Cite this article: Nguyen LKN, et al. (2021). Evaluating intervention strategies in        are important in the care-home setting and for COVID-19 specifi-
           controlling coronavirus disease 2019 (COVID-19) spread in care homes: An agent-               cally. Influenza and COVID-19 pandemic ABMs have studied dis-
           based model. Infection Control & Hospital Epidemiology, 42: 1060–1070, https://doi.org/
           10.1017/ice.2020.1369
                                                                                                         ease dynamics and interventions at the population level,10,13–15 and

           © The Author(s), 2020. Published by Cambridge University Press on behalf of The Society for Healthcare Epidemiology of America. All rights reserved. This is an Open Access article,
           distributed under the terms of the Creative Commons Attribution licence (http://creativecommons.org/licenses/by/4.0/), which permits unrestricted re-use, distribution, and reproduction
           in any medium, provided the original work is properly cited.

Downloaded from https://www.cambridge.org/core. 24 Jan 2022 at 07:09:06, subject to the Cambridge Core terms of use.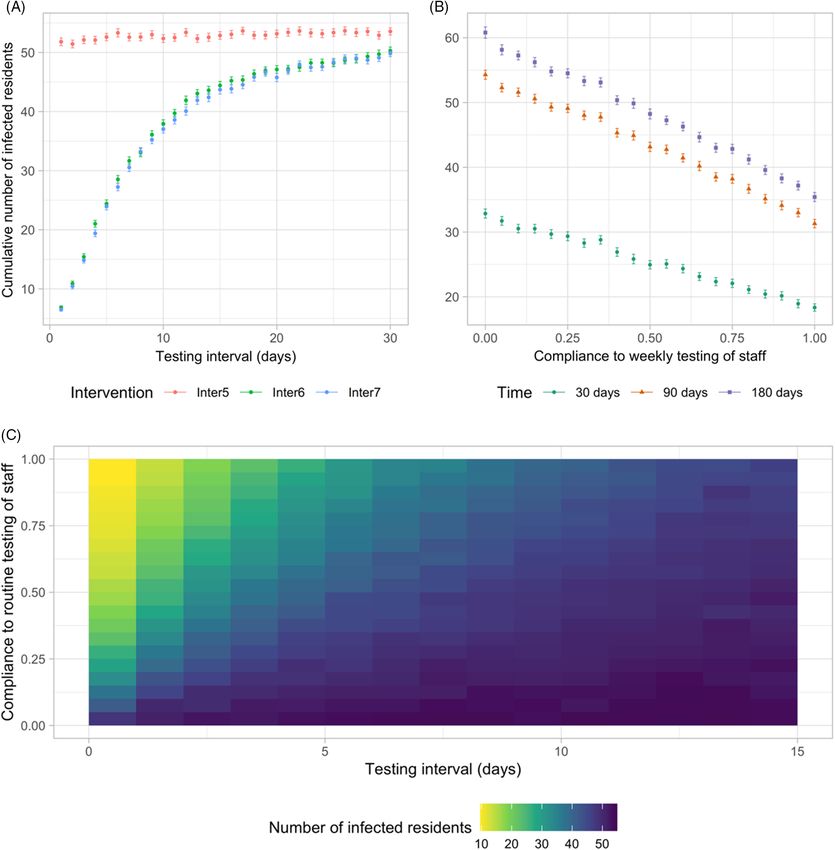
Infection Control & Hospital Epidemiology                                                                                                                  1061

           a number of recent ABMs have investigated how interventions in                            As we examined the spread of SARS-CoV-2 once infection already
           small-scale settings, such as schools and workplaces, would influ-                        exists in the care home, 1 random resident is infected at the begin-
           ence the behavior of epidemics in wider communities.10,16,17 None                         ning of the simulation; staff and other residents are susceptible.
           of these models explores the care-home setting, and many mea-
           sures implemented schools and workplaces, such as closure and                             Data collection and parameters
           social distancing, are not suitable for care homes that also act as
                                                                                                     We interviewed care-home stakeholders including managers, staff
           a residence and where staff interaction with residents is often
                                                                                                     in different roles, and we had regular discussions with represent-
           unavoidable.
                                                                                                     atives from the Health and Social Care Partnerships and Public
              Many studies have investigated the spread of SARS-CoV-2 in
                                                                                                     Health in Lanarkshire to analyze the problem, build the model,
           the general population, but research on the unique transmission
                                                                                                     and design the intervention strategies. The interviews were semi-
           dynamics and interventions for COVID-19 in healthcare settings,
                                                                                                     structured, and each lasted ~45–60 minutes. We also conducted
           and care homes in particular, is scarce. We searched PubMed,
                                                                                                     literature reviews to obtain the values for parameters characteriz-
           MedRxiv, and BioRxiv for papers published between January 1,
                                                                                                     ing the transmission of SARS-CoV-2 and the disease progression.
           2020, and July 15, 2020, that contained the terms (COVID OR
                                                                                                     Other parameters are based on national data for Scotland and
           coronavirus OR nCoV OR SARS-CoV-2) AND (care home* OR
                                                                                                     regional data for North Lanarkshire where available. Model input
           nursing home* OR skilled nursing facility* OR long-term care
                                                                                                     parameters used for the base case simulation are presented in
           OR LTCF* OR residential care). We identified 152 preprints
                                                                                                     Table 1.
           and articles published in academic journals, mostly outbreak
           reports, point prevalence surveys, commentary and editorial
                                                                                                     Intervention scenarios
           papers that discuss the importance and challenges of controlling
           the spread of SARS-CoV-2 in this setting. They describe experien-                         We considered the impact of 9 different intervention strategies
           ces of containing spread in some specific care homes and a need for                       summarized in Table 2. The reference intervention strategy
           improved control interventions, and they call for more attention                          (Inter1) was based on discussions with local care-home stakehold-
           and a plan from governments. We found 1 preprint modeling                                 ers in Lanarkshire and aligned with the guidance from the Scottish
           study18 that evaluates the capability of surveillance strategies to                       government for controlling SARS-CoV-2. Interventions such as
           detect simulated outbreaks under limited testing capacity in a                            hand hygiene and using personal protective equipment (PPE)
           long-term care hospital. This paucity suggests a lack of research                         change the infection probability per contact, representing the
           on the transmission dynamics of SARS-CoV-2 and the effective-                             reduction in transmission risk and an increase in compliance.
           ness of infection control interventions in this setting. Therefore,                       Residents and staff members who are symptomatic or tested pos-
           we investigated the transmission dynamics of SARS-CoV-2 in a                              itive are isolated and excluded from work respectively the day after
           care home and the effectiveness of a range of infection control                           being tested because we assumed it would take 1 day for results to
           intervention strategies using agent-based modeling.                                       be returned in base-case simulations. Because standard RT-PCR
                                                                                                     testing is highly specific,20 we assumed perfect specificity. The
           Methods                                                                                   COVID-19 epidemic in the general population was assumed to
                                                                                                     be ongoing at a constant prevalence within the simulated time
           Model
                                                                                                     (1 year) because we focused on interventions that do not shield
           We developed an ABM that simulates the transmission dynamics                              the care home from the external world. Finally, the intervention
           of SARS-CoV-2 via contacts between individual agents, including                           strategies we examined were in force during this period.
           residents, staff members, and visitors within a care home. We
           assumed that all rooms are single occupancy because the vast                              Outcomes
           majority of rooms in Scottish care homes are of this type19 and,
                                                                                                     A stochastic ABM produces different outputs for the same param-
           based on discussions with care-home stakeholders, single occu-
                                                                                                     eter set; therefore, it requires a large number of simulations to gain
           pancy has been a consensus practice during the COVID-19 pan-
                                                                                                     an understanding of the behavior of the system over time. We ran
           demic. The model structure (Fig. 1) is described in detail in the
                                                                                                     300 simulations for each scenario because the mean outputs con-
           ‘ODD’ (overview, design concepts, and details) protocol
                                                                                                     verged after this number of simulations. The outcomes we consid-
           (Appendix S1 online). In brief, susceptible individuals may acquire
                                                                                                     ered in the results were the prevalence of infected residents over
           the infection when exposed to infectious sources. They are infected
                                                                                                     time (means and distribution of prevalence at peak) and the cumu-
           but not yet infectious (exposed). Once exposed, individuals
                                                                                                     lative number of infected residents (means, medians, interquartile
           become infectious, they can either remain asymptomatic for the
                                                                                                     ranges [IQRs], and 1.5×IQRs).
           entire infectious period or develop symptoms after a presympto-
           matic period. Symptoms could be mild or severe and require hos-
                                                                                                     Uncertainty and sensitivity analyses
           pitalization. Infectious individuals eventually recover or die.
           Infections can be imported into the care home by infected residents                       We performed global probabilistic sensitivity analyses for param-
           upon admission (from hospitals and the community) and staff or                            eter uncertainty for the reference intervention (Inter1) and weekly
           visitors who acquired the infection elsewhere. The COVID-19                               testing of staff strategies (Inter6). The probability distributions of
           prevalence in hospitals and the community determine the proba-                            the analyzed parameters are summarized in Table 1. We adopted
           bility at which these individuals introduce the infection into the                        the Latin hypercube sampling (LHS) method to generate 300 sets
           care home. Transmission events occur through contacts made                                of samples, and we performed 100 iterations for each set (ie, 30,000
           between susceptible and infectious (presymptomatic, asympto-                              simulations in total). We calculated the partial rank correlation
           matic, and symptomatic) individuals at risk, determined by the                            coefficient (PRCC) to determine the strength of the relationship
           infection probability per contact. We assumed that recovered indi-                        between each LHS parameter and each outcome measure. We also
           viduals are immune to reinfection throughout the simulated time.                          examined how robust the relative effectiveness of interventions

Downloaded from https://www.cambridge.org/core. 24 Jan 2022 at 07:09:06, subject to the Cambridge Core terms of use.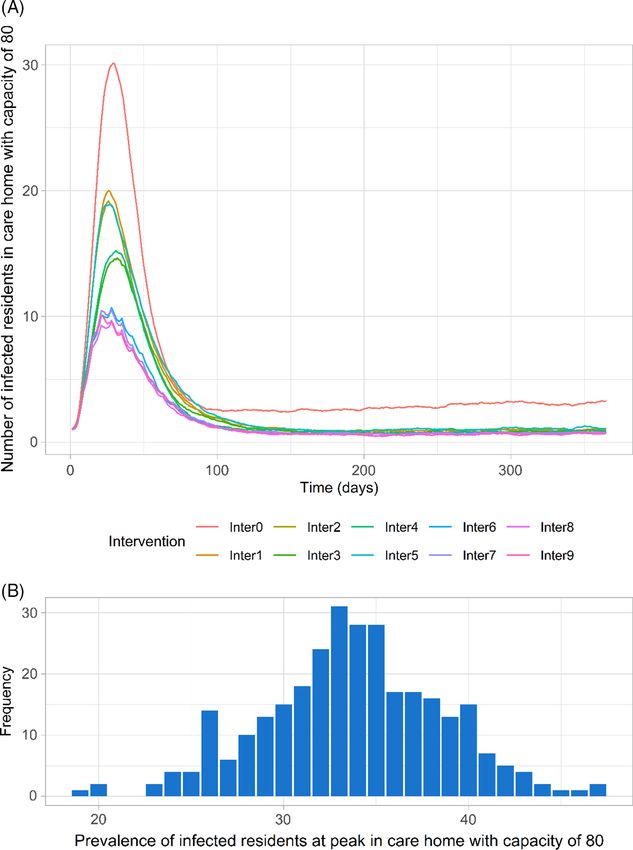
1062                                                                                                                                              Le Khanh Ngan Nguyen et al

           Fig. 1. Overview of the model structure. (A) The structure of the care home and routes of introducing SARS-CoV-2 into the home. The base case care home, representative of a care
           home in North Lanarkshire, Scotland, has 80 residents and a team of 72 staff members. It is split into 2 units containing 40 residents and 16 and 15 care staff members on duty per
           unit per day. The staff pools for the 2 units contain 33 and 32 care staff members respectively. A group of 7 well-being coordinators and housekeepers is shared between the 2 units.
           (B) The progression of COVID-19 cases. Susceptible people may acquire the infection when exposed to infectious sources. They are infected but not yet infectious (exposed state).
           Once exposed people become infectious, they can either remain asymptomatic for the entire infectious period or develop symptoms after a pre-symptomatic period. Symptoms
           could be mild or severe and require hospitalizations. Infectious people will eventually recover or die. (C) Interactions between residents, staff and visitors in a care home. The
           dashed lines linking individuals denote their possible ways of interaction. Different colours are used for these lines to distinguish different types of interaction: blue, staff-resident
           interaction; green, resident-resident interaction; red, staff–staff interaction; black, resident-visitor interaction; and purple, staff–visitor interactions.

           were with respect to the most impactful uncertain parameters                                   Results
           determined in the PRCC analysis.
                                                                                                          Spread of COVID-19
               We assessed the impact of the testing interval between 1 and 30
           days on the effectiveness of routine testing interventions (Inter6,                            In all scenarios, the mean prevalence of infected residents peaked
           Inter7, Inter8, and Inter9). We also tested the robustness of the                              ~30 days after the first infection in the care home, decreased, then
           findings to the care home’s capacity, structure, and staff pooling                             stabilized after around ~90 days (Fig. 2A). The distribution of
           system (Supplementary Table S4-1 in Appendix S4 online).                                       prevalence at peak (mean, 34; standard deviation [SD], 4.9; range,
           Finally, we examined model outputs with infection prevalence                                   19–47) in the no intervention scenario is illustrated in Figure 2B.
           in the community set to historical daily data in Scotland adjusted                             Relatively large variations in prevalence values are due to stochastic
           for undetected cases and start the simulation without a seeded                                 uncertainty of interactions within the care home and disease
           infection.21,22                                                                                progression.
                                                                                                             In the absence of any control measures and spontaneous
           Statistical analysis                                                                           changes in the behaviors of individuals, the introduction of a single
                                                                                                          infected resident resulted in an outbreak (ie, at least 2 residents are
           We used the Welch t test at a significant level of α = 0.05 to per-
                                                                                                          infected) in 99.7% of simulations (299 of 300); in 1 simulation,
           form hypothesis testing for difference in the mean cumulative
                                                                                                          transmission died out quickly. By the time that any infected resi-
           numbers of infections after 90 and 180 days between scenarios
                                                                                                          dents manifested COVID-19 symptoms, an average of 6 residents
           (Appendix S2 online). We also adopted the Bonferroni correction
                                                                                                          (SD, 4.2; range, 1–23) had acquired the infection but may not (yet)
           method in which the P values were multiplied by the number of
                                                                                                          have shown symptoms. Infected cases that did not (yet) display
           tests to counteract the potential type 1 error in multiple
                                                                                                          symptoms made up approximately half of all infections among
           comparisons.

Downloaded from https://www.cambridge.org/core. 24 Jan 2022 at 07:09:06, subject to the Cambridge Core terms of use.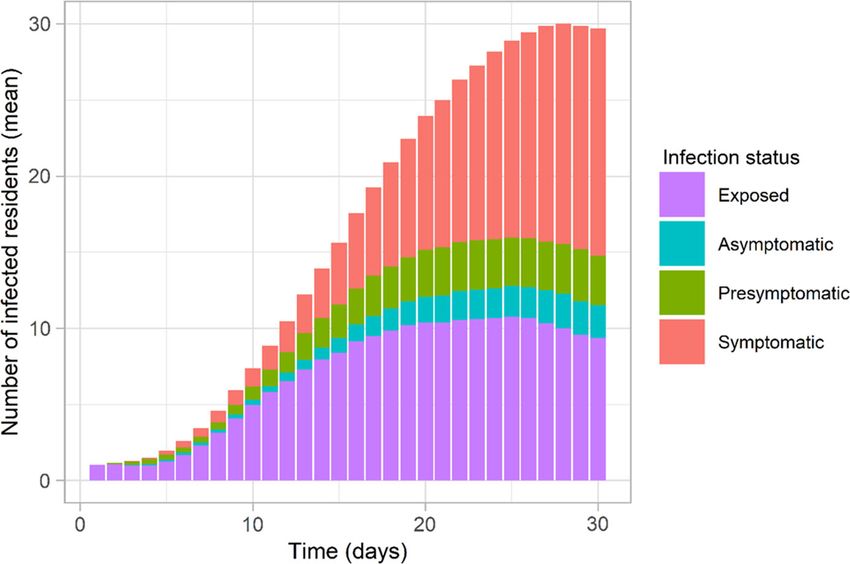
Downloaded from https://www.cambridge.org/core. 24 Jan 2022 at 07:09:06, subject to the Cambridge Core terms of use.
Infection Control & Hospital Epidemiology
Table 1. Input Parameters for Base Case Simulation and Distributions of Parameters
Input Parameter Base Case Value Sensitivity/Uncertainty Analysis Source
Infection prevalence in the hospital 0.02 Triangular distribution (min = 0, max = 0.5, mode National Records Scotland,7 Public Health
= 0.2) Scotland,22Scottish government31(estimated)
Infection prevalence in the community 0.05 Triangular distribution (min = 0, max = 0.2, mode Perez-Reche and Strachan21
= 0.05)
The probability that an infected resident dies (age- Drawn for each individual resident No (This parameter does not impact our main Ferguson et al,13Kulu and Dorey32
specific) from empirical distribution by age: model output, the number of infected residents, The Infection Fatality Rate (IFR) for Scotland is adjusted
80þ y: 11% significantly.) based on the overall aged-adjusted IFR value for the UK
70–79 y: 6.0% and the relative IFR value (=1.18) for other urban areas in
60–69 y: 2.6% Scotland. Most of the population (>80%) in North
50–59 y: 0.71% Lanarkshire live in areas classified as other urban areas.
40–49 y: 0.18%
30–49 y: 0.09%
20–29 y: 0.04%
18–20 y: 0.007%
The probability that an infected staff member dies Drawn for each individual staff No Ferguson et al,13Kulu and Dorey32
member from a uniform distribu-
tion (0.0003–0.022)
The no. of contacts that a resident has with other Drawn for each individual resident Mean of the Poisson distribution is drawn from a Van den Dool et al,11Chamchod and Ruan33
residents per day from a Poisson distribution with a triangular distribution (min, 1; max, 5; mode = 3.9)
mean of
3.9 contacts per resident per day
The no. of contacts that a staff has with other staff Drawn for each individual staff Mean of the Poisson distribution is drawn from a Van den Dool et al11
per day member from a Poisson distribu- triangular distribution (min, 1; max, 10; mode, 7.3)
tion with a mean of 7.3 contacts
per staff member per day
The no. of contacts that a staff has with residents Drawn for each individual staff Mean of the Poisson distribution is drawn from a Van den Dool et al,11Chamchod and Ruan33
per day member from a Poisson distribu- triangular distribution (min, 10; max, 20; mode,
tion with a mean of 16.2 contacts 16.2)
per staff per day
The no. of contacts that a staff has with visitors 5.0 contacts per staff member per Triangular distribution (min, 0; max, 10; mode, 5.0) Discussions with the manager and staff of the representa-
per day day tive care home
The probability that a resident comes into contact 20% Triangular distribution (min, 0; max, 0.5; mode, 0.2) Discussions with the manager and staff of the representa-
with another resident in the other unit tive care home
The average no. of people visiting a resident per 1.0 visitor per resident per day Triangular distribution (min, 0; max, 2.0; mode, 1.0) Van den Dool et al,11Port et al34
day
The rate at which residents leave the care home 0.005 deaths or discharges per Triangular distribution (min, 0.001; max, 0.005; Scotland Information Services19 (Calculated from data for
because of deaths caused by other reasons, mov- resident per day mode, 0.004) care homes in North Lanarkshire)
ing to another facility, admitted to hospitals, or
returning to their own home (rare)
Staff turnover rate 24% per year Triangular distribution (min, 0.1; max, 0.5; mod, Scottish Care35
0.24)
(Continued)
1063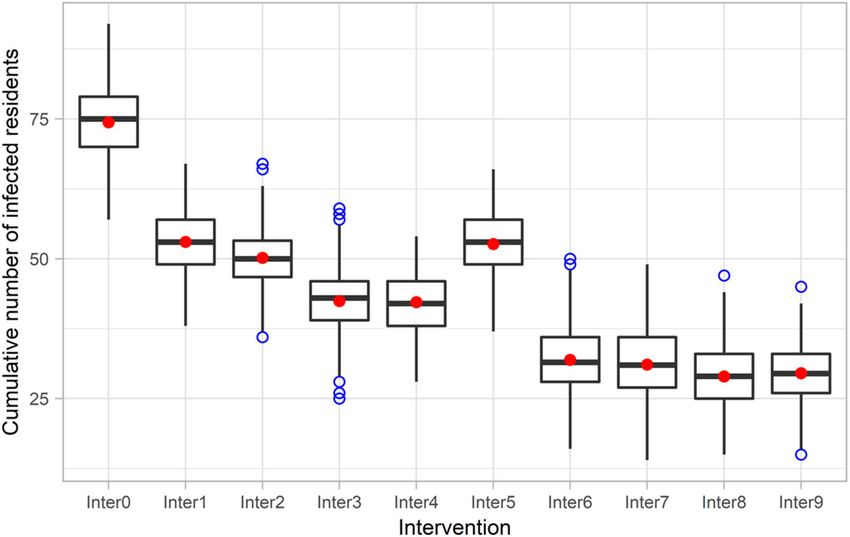
Downloaded from https://www.cambridge.org/core. 24 Jan 2022 at 07:09:06, subject to the Cambridge Core terms of use.
Table 1. (Continued )
Input Parameter Base Case Value Sensitivity/Uncertainty Analysis Source
1064
The probability that an infected resident will Drawn for each individual resident Triangular distribution (min, 0.5; max, 0.9; mode, Ferguson et al,13Verity et al36
develop symptoms from empirical distribution: 0.8)
80þ y: 0.9
70–79 y: 0.85
60–69 y: 0.8
50–59 y: 0.75
40–49 y: 0.7
30–49 y: 0.65
20–29 y: 0.6
18–20 y: 0.55
The probability that an infected staff member will 0.7 Triangular distribution (min, 0.5; max, 0.9; mode, Ferguson et al,13Verity et al36
develop symptoms 0.7) (for a population like the United Kingdom or the United
States)
The probability that a symptomatic resident has Drawn for each individual resident No (This parameter does not affect no. of infections Ferguson et al,13Kulu and Dorey32
severe symptoms from empirical distribution: significantly given the assumptions that sympto- The proportion of symptomatic cases requiring hospitaliza-
80þ y: 0.28 matic individuals are isolated) tions for Scotland is adjusted based on the overall aged-
70–79 y: 0.25 adjusted value for the United Kingdom
60–69 y: 0.17
50–59 y: 0.11
40–49 y: 0.05
30–49 y: 0.03
20–29 y: 0.01
18–20 y: 0.001
The probability that a symptomatic staff member Drawn for each individual staff No Ferguson et al,13Kulu and Dorey32
has severe symptoms member from a uniform distribu-
tion (0.01–0.17)
The probability that an individual (resident or 0.02 Triangular distribution (min, 0.001; max, 0.1; mode, Ferguson et al,13Wang et al,37Tang et al38
staff) is infected after coming into contact with 0.02)
another infectious individual (resident, staff or visi-
tor)
The time elapsed between first exposure and Lognormal (μ = 1.16, σ = 0.85) No (This parameter does not significantly affect Lauer et al,39McAloon et al,40Nishiura et al41 (log normal
becoming infectious number of infections as exposed individuals are mean, 4.6; SD, 4.8)
not infectious. Also, values for this parameter are
relatively consistent across studies.)
The time elapsed between becoming infectious Discrete uniform distribution (1,3) No (Values for this parameter are consistent across He et al,42 Gatto et al,43 Byrne et al44
and onset of symptoms studies.)
The time elapsed between onset of symptoms and Asymptomatic: log normal No (There is a strong consensus about the distribu- Kerr et al,17 Wölfel et al45
recovery (or recovery time for those who remain (μ = 2.049, σ = 0.246) tion of this parameter in literature.)
asymptomatic) Symptomatic:
Mild: log normal (μ = 2.049,
σ = 0.246)
Le Khanh Ngan Nguyen et al
Severe: log normal (μ = 2.624,
σ = 0.170)
The reduction of resident–resident and staff–staff 0.75 Triangular distribution (min, 0.2; max, 0.9; mode, Assumed (based on other models’ assumption13,46 and dis-
interactions when social distancing is implemented 0.75) cussions with care home staff and managers)
The sensitivity of RT-PCR test 0.7 Triangular distribution (min, 0.6; max, 0.98; mode, Watson et al,47 Arevalo-Rodriguez et al48
0.7)
The lag between testing and test result 1 day No (implemented in scenario-based uncertainty Discussion with representatives from Public Health Medicine
analysis) (NHS Lanarkshire) and Lanarkshire Health and Social Care
Partnership
Effectiveness of isolation of infected residents 100% 50%, 75%, and 100% Assumed (based on other models’ assumptions13,46)
Infection Control & Hospital Epidemiology 1065
Table 2. Summary of Intervention Strategies Considered
Intervention
Strategy Description
Inter0 No intervention
Inter1 Isolation of symptomatic cases & testing of new admissions (2 tests) and social distancing and restricted visiting (referred to as the
reference intervention).
Inter2 Inter1 and 14-d compulsory isolation for new admissions regardless of the result of their tests
Inter3 Inter1 and adaptive testing (ie, testing staff and residents and the care home is closed to new admissions when there is a symptomatic
case, reopening when all symptomatic and confirmed residents recover)
Inter4 Inter3 and 14-d compulsory isolation for new admissions
Inter5 Inter1 and weekly testing of residents
Inter6 Inter1 and weekly testing of staff
Inter7 Inter1 and weekly testing of staff and residents
Inter8 Inter6 and 14-d compulsory isolation for new admissions
Inter9 Inter7 and 14-d compulsory isolation for new admissions
residents (Fig. 3), which aligns with reported data.23 Additionally, of new admissions (Inter8 and Inter9) only slightly reduced the
the proportion of asymptomatic cases among infected residents in peak and cumulative outcomes. Additional plots of modeling
our study (7%; range, 4%–10%) shows a good approximation of results for different time intervals are included in Appendix S3
observed data for long-term aged care (8%; range, 3%–18%).24-26 (online).
Effectiveness of various routine testing strategies and
Effectiveness of the examined intervention strategies compliance
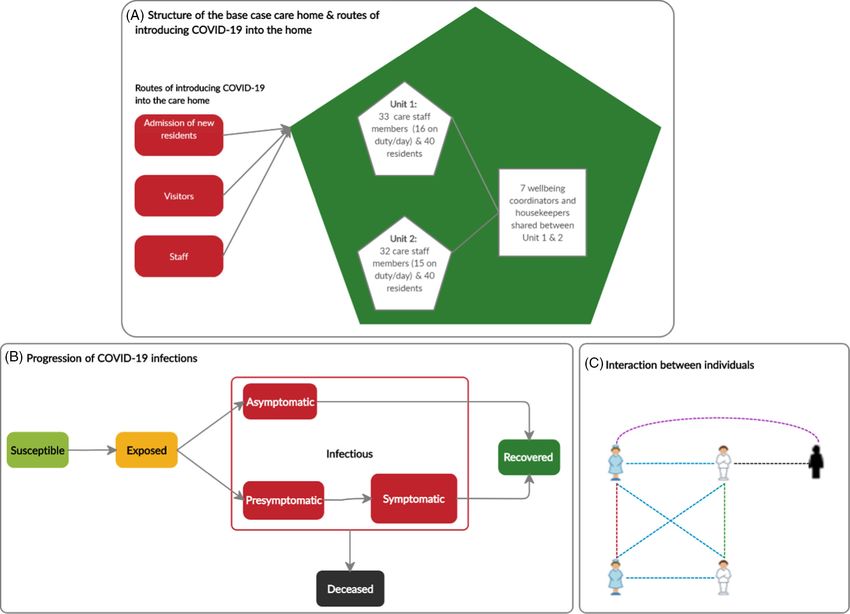
Implementing the reference intervention, which combines isola- Routine testing of residents (Inter5) was predicted to be no more
tion of symptomatic residents, testing of new admissions, social effective than the reference intervention strategy (Inter1) regard-
distancing, and restricted visiting (Inter1), clearly lowered the peak less of testing frequency (P ~ 1.0; 95% CI of the difference, –0.1
and reduced the cumulative number of infections after 90 days to 2.1 [180 days]). The effectiveness of routine testing of staff
compared to the no intervention scenario (Inter0) (Fig. 2A and (Inter6) and of staff and residents (Inter7) decreased nonlinearly
Fig. 4). There was very strong evidence (P < .001) for rejecting with increased testing intervals (Fig. 5A). The difference between
the null hypothesis in favor of the alternative hypothesis that the 2 interventions (Inter6 and Inter7) reduced as the infection
the mean cumulative number of infected residents for the reference probability reduced (Fig. S4-3 online). Increasing compliance to
intervention scenario was lower than the mean when doing noth- routine testing of staff linearly reduced the cumulative number
ing (95% CI of the difference, 20.4–22.4 [90 days]). of infected residents (Fig. 5B). Moreover, compliance with routine
Adding the 14-day compulsory isolation of new admissions testing of staff had a significant effect on the model outcome when
(Inter2) slightly decreased the number of infections compared to a testing interval was1066 Le Khanh Ngan Nguyen et al
Fig. 2. Time series of COVID-19 prevalence among residents in care
home with capacity of 80 residents across all scenarios using the
base case parameters (means of 300 simulations for each scenario)
(A) and distribution of the prevalence at peak for no intervention sce-
nario (Inter0) using the base case parameters for 300 simulations (B).
(Inter0: No intervention; Inter1: Reference intervention (isolation of
symptomatic/confirmed residents, testing of new admissions,
closed to visitors, social distancing); Inter2: Inter 1 þ isolation upon
admission; Inter3: Inter1 þ adaptive testing strategy; Inter4:
Inter3 þ isolation upon admission; Inter5: Inter1 þ Weekly testing
for residents; Inter6: Inter1 þ weekly testing for staff; Inter7:
Inter1 þ weekly testing for staff and residents; Inter8: Inter6 þ iso-
lation upon admission; Inter9: Inter7 þ isolation upon admission).
Fig. 3. Time series of prevalence of infected residents (mean) in
different infection status across 300 simulations when no inter-
vention is implemented (Inter0) using the base case parameters.
Downloaded from https://www.cambridge.org/core. 24 Jan 2022 at 07:09:06, subject to the Cambridge Core terms of use.Infection Control & Hospital Epidemiology 1067
Fig. 4. Box plot of cumulative numbers of infected residents 90 days
after a resident is infected at the start of the simulation in nine inter-
vention scenarios using the base case parameters (The result is pre-
sented as a box plot − lower hinge: 25% quantile; lower whisker:
smallest observation greater than or equal to lower hinge −
1.5×IQR; middle: median; upper hinge: 75% quantile; upper whisker:
largest observation less than or equal to upper hinge þ 1.5×IQR; red
dot: mean; blue dot: outlier). Note. IQR, interquartile range.
sensitivity to different types of contacts ocurred because a social hand hygiene and PPE that reduce this risk are crucial for control-
distancing measure was implemented in the reference interven- ling the spread of SARS-CoV-2. The importance of these measures
tion, and we assumed that the intervention reduced staff–staff in controlling COVID-19 should be emphasized and reinforced
and resident–resident contact while staff–resident contact rates among staff in care homes as they may become less compliant
remained unchanged. Test sensitivity affected the effectiveness when community transmission improves and interventions are
of routine testing of staff strategy. The model outcomes were relaxed.
not sensitive to the number of visitors allowed. Across values of Among the examined SARS-CoV-2 testing strategies, routine
the most impactful parameters, the relative effectiveness of inter- testing of staff appears to be the most effective and practical
vention strategies remained unchanged (Supplementary Fig. S4-3 approach in the presence of the reference intervention strategy.
in Appendix 4 online). When the risk of transmission per contact is reduced by enhancing
The findings regarding the relative effectiveness of interven- compliance to hand hygiene and PPE use, the strategy of routine
tions were robust when modifying the structures (unit size and testing of staff is as effective as more stringent interventions strat-
residents-per-staff ratio) and capacity of the care home. Unit size egies. This includes the combination of this strategy and 14-day
or residents-per-staff ratio did not significantly impact the cumula- compulsory isolation of new admissions, routine testing of both
tive number of infected residents. Neither did care-home capacity staff and residents with/without isolation of new admissions.
affect the proportion of infections among residents. Furthermore, Routine testing of residents does not show additional effect com-
when we used the daily data of Scotland adjusted for undetected pared to the reference intervention strategy. Therefore, our model
cases21,22 and started the simulation without a seeded infection, predictions suggest that routine testing should target staff in care
the order of the impact of strategies remained robust. homes in conjunction with encouragement and support to
enhance compliance to hand hygiene and using PPE.
Our modeling results on the effectiveness of routine testing of
Discussion
staff and residents are supported by a number of recently published
We present an ABM that captures heterogeneity and stochasticity studies. Weekly universal testing of all staff and residents irrespec-
of individuals’ disease progression and interaction patterns and tive of symptoms conducted in 123 West Virginia nursing homes
their effect on transmission dynamics of SARS-CoV-2 and the showed that this intervention was more effective in lowering the
effectiveness of control interventions in a care-home setting. prevalence of COVID-19 than daily symptom-based resident
Care homes are diverse in terms of their resident population, struc- and staff screening.27 Other empirical studies in nursing homes
ture and management, and ABMs have more flexibility compared in the United States and France also reported that routine universal
to simpler epidemiological compartment models to reflect this testing helped identify cases among staff and residents more
variation and to examine how it influences findings. The stochastic quickly and interrupted transmission in the facility.28-30 These
feature of ABM is well-suited for simulating a small population in studies, however, did not examine the impact of routine testing tar-
an intricate setting like a care home, where chance events can lead geting staff only and compared it to resident testing, which is easier
to major effects. Furthermore, while deterministic compartment to study in a simulation model such as ours than designing a con-
models yield a single output for each parameter set, an ABM pro- trolled experiment.
duces a distribution of outputs accounting for stochastic uncer- Regarding testing intervals, our model predictions, along with
tainty of interactions within the care home and disease discussions with local experts and management regarding feasibil-
progression. ity, suggest that routine testing of staff should be carried out every
Our simulations show that once SARS-CoV-2 is introduced 7–10 days. Although more frequent intervals of testing of staff
into care homes, it spreads very quickly and stopping the spread result in better outcomes, this may not be feasible and is costly.
is very difficult. Because risk of transmission per contact appears The adverse effects of more frequent testing of staff include
to be the most impactful factor on the prevalence and cumulative increased workload, time pressure, worsened staff shortages, and
prevalence of infections among residents, interventions such as decreasing tolerance; therefore, they may lead to reduced
Downloaded from https://www.cambridge.org/core. 24 Jan 2022 at 07:09:06, subject to the Cambridge Core terms of use.1068 Le Khanh Ngan Nguyen et al
Fig. 5. Effectiveness of different routine testing strategies and compliance. (A) The impact of different testing intervals in routine testing scenarios on the cumulative number of
infections after 90 days. (B) The impact of compliance to weekly testing of staff (Inter6) on the cumulative number of infections after 30, 90, and 180 days. Other parameters take
the values at base case. (Dots denote the mean values of 300 simulations and error bars represent 95% confidence interval of the mean.)
(C) Heatmap plot for the impact of testing interval and compliance to routine testing of staff (Inter6) on the cumulative number of infections after 90 days.
compliance to testing among staff members. Increasing workload staff that interact with residents more frequently also provide an
and time pressure may, in turn, affect other care activities provided entry point for infection. This finding suggests that relaxing the
to residents and staffs’ compliance with testing and hand hygiene, visiting policy, will not significantly impact the effectiveness of
which has greatest impact on the transmission of SARS-CoV-2. A the examined interventions. However, the assumption that the
more frequent testing policy could be tailored to care homes with model starts with a seeded infection limits this interpretation.
outbreaks to achieve the best outcomes at an acceptable cost. At Further work is required to combine a model such as the one
this stage, we did not explicitly consider the implications of these we present with a model of prevalence in the community over time
additional costs in our model. to explore the effect of relaxing visiting under different scenarios of
Care homes are interested in developing strategies for visitors, infection prevalence in the community.
which is important for the welfare of residents. The model out- This work has a number of limitations. First, we assumed that
comes are not sensitive to the number of visitors allowed because the level of COVID-19 in the community is static. However,
Downloaded from https://www.cambridge.org/core. 24 Jan 2022 at 07:09:06, subject to the Cambridge Core terms of use.Infection Control & Hospital Epidemiology 1069
varying this parameter or using time series data of Scotland did not 6. Hsu AT, Lane N. Impact of COVID-19 on residents of Canada’s long-term
affect the intervention ranking. Second, the model does not care homes — ongoing challenges and policy response. LTC Responses to
account for the potential that residents with atypical symptoms COVID website. https://ltccovid.org/2020/04/15/impact-of-covid-19-on-
are not successfully detected and, therefore, isolated in a timely residents-of-canadas-long-term-care-homes-ongoing-challenges-and-
manner. However, we conducted sensitivity analysis to consider policy-response/. Published 2020. Accessed 15 April, 2020.
7. Deaths involving coronavirus (COVID-19) in Scotland. National Records of
varying values of the probability residents develop symptoms to
Scotland website. https://www.nrscotland.gov.uk/statistics-and-data/
reflect this uncertainty because we modeled atypical symptomatic statistics/statistics-by-theme/vital-events/general-publications/weekly-
residents who are not detected as asymptomatic residents. We and-monthly-data-on-births-and-deaths/deaths-involving-coronavirus-
found that this parameter does not affect the outcomes. Third, covid-19-in-scotland. Published 2020. Accessed 20 June, 2020.
although we carried out uncertainty and sensitivity analyses on 8. Adiga A, Chu S, Eubank S, et al. Disparities in spread and control of influ-
a care home’s size and structure, the diversity of this setting in enza in slums of Delhi: findings from an agent-based modelling study. BMJ
terms of characteristics of resident populations, health and care Open 2018;8:e017353.
services provided, and management would limit the generalization 9. He T, Li K, Roberts MS, et al. Prevention of hepatitis C by screening and
of our findings. Finally, we have not evaluated the cost- treatment in US prisons. Ann Intern Med 2016;164:84–92.
effectiveness of the examined interventions which would impact 10. Hoertel N, Blachier M, Blanco C, et al. A stochastic agent-based model of the
SARS-CoV-2 epidemic in France. Nat Med 2020;26:1417–1421.
the feasibility of implementation.
11. van den Dool C, Bonten MJM, Hak E, Heijne JCM, Wallinga J. The effects of
In conclusion, our analysis sheds light on the transmission influenza vaccination of healthcare workers in nursing homes: insights from
dynamics of COVID-19 in care homes. The effectiveness evalu- a mathematical model. PLoS Med 2008;5(10):e200.
ation of different infection control intervention strategies has 12. Stephenson B, Lanzas C, Lenhart S, et al. Comparing intervention strategies
potentially significant implications for public health policy mak- for reducing Clostridioides difficile transmission in acute healthcare settings:
ing. Infection control interventions in care homes need to be both an agent-based modeling study. BMC Infect Dis 2020;20:799.
effective in containing the spread of COVID-19 and also feasible to 13. Ferguson N, Laydon D, Nedjati Gilani G, et al. Report 9: Impact of Non-
implement in this setting which has a dual nature: a healthcare Pharmaceutical Interventions (NPIs) to Reduce COVID19 Mortality and
institution and a home. Routine testing that targets staff is most Healthcare Demand. London: Imperial College London 2020. doi:
effective and practical, and more rigorous testing strategies may 10.25561/77482.
14. Halloran ME, Ferguson NM, Eubank S, et al. Modeling targeted layered
not induce additional impact. We also emphasize the importance
containment of an influenza pandemic in the United States. Proc Nat
of interventions such as hand hygiene and using PPE that reduce Acad Sci 2008;105:4639–4644.
risk of transmission in inter-individual contacts on the spread of 15. Ferguson NM, Cummings DA, Cauchemez S, et al. Strategies for
SARS-CoV-2 and the COVID-19 pandemic. containing an emerging influenza pandemic in Southeast Asia. Nature
2005;437:209–214.
Supplementary material. To view supplementary material for this article,
16. Panovska-Griffiths J, Kerr CC, Stuart RM, et al. Determining the optimal
please visit https://doi.org/10.1017/ice.2020.1369
strategy for reopening schools, the impact of test and trace interventions,
Acknowledgments. We thank Health and Social Care Partnerships and Public and the risk of occurrence of a second COVID-19 epidemic wave in the
Health Medicine - NHS Lanarkshire (Judy Allison, David Cromie, Jim White), UK: a modelling study. Lancet Child Adolescent Health 2020;4:817–827.
and Jennifer McKellar and other staff members in Highgate care home for help- 17. Kerr CC, Stuart RM, Mistry D, et al. Covasim: an agent-based model of
ful discussion. We also thank Dr Sarah J.E. Barry from Department of COVID-19 dynamics and interventions. medRxiv 2020. doi: 10.1101/
Mathematics and Statistics—University of Strathclyde for reviewing the statis- 2020.05.10.20097469.
tical methods and results of the study. 18. Smith DR, Duval A, Pouwels KB, et al. How best to use limited tests?
Improving COVID-19 surveillance in long-term care. medRxiv. 2020.
Financial support. This work was funded by the University of Strathclyde as doi: 10.1101/2020.04.19.20071639.
part of L.L.K.N.’s doctoral project. 19. Care Home Census for Adults in Scotland, 2016. Scotland Information
Services Division website. http://www.isdscotland.org/Health-Topics/
Conflicts of interest. All authors declare no potential conflicts of interest Health-and-Social-CommunityCare/Publications/2016-10-25/2016-10-25-
related to this article. CHCensus-Report.pdf. Published 2016. Accessed December 10, 2020.
20. Corman VM, Landt O, Kaiser M, et al. Detection of 2019 novel
coronavirus (2019-nCoV) by real-time RT-PCR. Eurosurveillance
References
2020;25(3):2000045.
1. Coronavirus disease (COVID-19) pandemic. World Health Organization 21. Perez-Reche F, Strachan N. Importance of untested infectious individuals
website. https://www.who.int/emergencies/diseases/novel-coronavirus- for the suppression of COVID-19 epidemics. medRxiv 2020. doi: 10.
2019. Published 2020. Accessed 15 July, 2020. 1101/2020.04.13.20064022.
2. Wang D, Hu B, Hu C, et al. Clinical characteristics of 138 hospitalized 22. Coronavirus (COVID-19) data. Public Health Scotland website. https://
patients with 2019 novel coronavirus–infected pneumonia in Wuhan, publichealthscotland.scot/our-areas-of-work/sharing-our-data-and-
China. JAMA 2020;323:1061–1069. intelligence/coronavirus-covid-19-data/. Published 2020. Accessed 20
3. Chen N, Zhou M, Dong X, et al. Epidemiological and clinical characteristics June, 2020.
of 99 cases of 2019 novel coronavirus pneumonia in Wuhan, China: a 23. Kimball A, Hatfield KM, Arons M, et al. Asymptomatic and presympto-
descriptive study. Lancet 2020;395:507–513. matic SARS-CoV-2 infections in residents of a long-term care skilled nurs-
4. McMichael TM, Currie DW, Clark S, et al. Epidemiology of covid-19 in a ing facility—King County, Washington, March 2020. Morbid Mortal Wkly
long-term care facility in King County, Washington. N Engl J Med Rept 2020;69:377.
2020;382:2005–2011. 24. Byambasuren O, Cardona M, Bell K, Clark J, McLaws M-L, Glasziou P.
5. Comas-Herrera A, Zalakain J, Litwin C, Hsu AT, Fernandez-Plotka J-L. Estimating the extent of true asymptomatic COVID-19 and its potential
Mortality associated with COVID-19 outbreaks in care homes: early for community transmission: systematic review and meta-analysis.
international evidence. LTC Responses to COVID website. https:// medRxiv 2020. doi.org/10.1101/2020.05.10.20097543.
ltccovid.org/2020/04/12/mortality-associated-with-covid-19-outbreaks-in- 25. Arons MM, Hatfield KM, Reddy SC, et al. Presymptomatic SARS-CoV-2
care-homes-early-international-evidence/?subscribe=success#blog_ infections and transmission in a skilled nursing facility. N Engl J Med
subscription-3. Published 2020. Accessed 19 April, 2020. 2020;382:2081–2090.
Downloaded from https://www.cambridge.org/core. 24 Jan 2022 at 07:09:06, subject to the Cambridge Core terms of use.1070 Le Khanh Ngan Nguyen et al
26. Freitas F. COVID-19 pandemic: true asymptomatic cases among SARS- 39. Lauer SA, Grantz KH, Bi Q, et al. The incubation period of coronavirus dis-
CoV-2–infected individuals. SSRN 2020. doi: l10.2139/ssrn.3590123. ease 2019 (COVID-19) from publicly reported confirmed cases: estimation
27. McBee SM, Thomasson ED, Scott MA, et al. Notes from the field: universal and application. Ann Intern Med 2020. doi: 10.7326/M20-0504.
statewide laboratory testing for SARS-CoV-2 in nursing homes— 40. McAloon CG, Collins A, Hunt K, et al. The incubation period of COVID-19:
West Virginia, April 21–May 8, 2020. Morbid Mortal Wkly Rept a rapid systematic review and meta-analysis of observational research. BMJ
2020;69:1177–1179. Open 2020;10:e039652.
28. Dora AV, Winnett A, Jatt LP, et al. Universal and serial laboratory testing 41. Nishiura H, Linton NM, Akhmetzhanov AR. Serial interval of novel coro-
for SARS-CoV-2 at a long-term care skilled nursing facility for veterans— navirus (COVID-19) infections. Int J Infect Dis 2020;93:284–286.
Los Angeles, California, 2020. Morbid Mortal Wkly Rept 2020;69:651–655. 42. He X, Lau EH, Wu P, et al. Temporal dynamics in viral shedding and trans-
29. Sacco G, Foucault G, Briere O, Annweiler C. COVID-19 in seniors: findings missibility of COVID-19. Nat Med 2020;26:672–675.
and lessons from mass screening in a nursing home. Maturitas 43. Gatto M, Bertuzzo E, Mari L, et al. Spread and dynamics of the COVID-19
2020;141:46–52. epidemic in Italy: effects of emergency containment measures. Proc Nat
30. Hatfield KM, Reddy SC, Forsberg K, et al. Facility-Wide testing for SARS- Acad Sci 2020;117:10484–10491.
CoV-2 in nursing homes - seven US jurisdictions, March–June 2020. 44. Byrne AW, McEvoy D, Collins A, et al. Inferred duration of infectious
Morbid Mortal Wkly Rept 2020;69:1095–1099. period of SARS-CoV-2: rapid scoping review and analysis of available evi-
31. Coronavirus (COVID-19): daily data for Scotland. Scottish Government dence for asymptomatic and symptomatic COVID-19 cases. BMJ Open
website. https://www.gov.scot/publications/coronavirus-covid-19-daily- 2020;10:e039856.
data-for-scotland/. Published 2020. Accessed 9 August, 2020. 45. Wölfel R, Corman VM, Guggemos W, et al. Virological assessment of hos-
32. Kulu H, Dorey P. The contribution of age structure to the number of deaths pitalized patients with COVID-2019. Nature 2020;581:465–469.
from COVID-19 in the UK by geographical units. medRxiv. 2020. doi: 10. 46. Matrajt L, Leung T. Evaluating the effectiveness of social distancing inter-
1101/2020.04.16.20067991. ventions to delay or flatten the epidemic curve of coronavirus disease. Emerg
33. Chamchod F, Ruan S. Modeling the spread of methicillin-resistant Infect Dis 2020;26:1740–1748.
Staphylococcus aureus in nursing homes for elderly. PloS One 2012;7(1): 47. Watson J, Whiting PF, Brush JE. Interpreting a COVID-19 test result. BMJ
e29757. 2020;369. doi: 10.1136/bmj.m1808.
34. Port CL, Hebel JR, Gruber-Baldini AL, et al. Measuring the frequency of 48. Arevalo-Rodriguez I, Buitrago-Garcia D, Simancas-Racines D, et al. False-
contact between nursing home residents and their family and friends. Negative results of initial RT-PCR assays for COVID-19: a systematic
Nurs Res 2003;52:52–56. review. medRxiv 2020. doi: 10.1101/2020.04.16.20066787.
35. Care home workforce data report. Scottish Care website. https://scottishcare. 49. COVID-19 pandemic planning scenarios. Centers for Disease Control and
org/wp-content/uploads/2019/11/Care-Home-Workforce-Data-2018.pdf. Prevention website. https://www.cdc.gov/coronavirus/2019-ncov/hcp/
Published 2018. Accessed August 15, 2020. planning-scenarios.html. Published 2020. Accessed June 13, 2020.
36. Verity R, Okell LC, Dorigatti I, et al. Estimates of the severity of coronavirus 50. National clinical and practice guidance for adult care homes in Scotland
disease 2019: a model-based analysis. Lancet Infect Dis 2020;20:669–677. during the COVID-19 pandemic. Scottish Government website. https://
37. Wang K, Lu Z, Wang X, et al. Current trends and future prediction of novel www.gov.scot/publications/coronavirus-covid-19-clinical-and-practice-
coronavirus disease (COVID-19) epidemic in China: a dynamical modeling guidance-for-adult-care-homes/. Updated May 15, 2020. Accessed
analysis. Math Biosci Engin 2020;17(4):3052. December 10, 2020.
38. Tang B, Bragazzi NL, Li Q, Tang S, Xiao Y, Wu J. An updated estimation of 51. Taylor R. Interpretation of the correlation coefficient: a basic review. J Diagn
the risk of transmission of the novel coronavirus (2019-nCov). Infect Dis Med Sonogr 1990;6:35–39.
Model 2020;5:248–255.
Downloaded from https://www.cambridge.org/core. 24 Jan 2022 at 07:09:06, subject to the Cambridge Core terms of use.You can also read