Evaluating Freshness Loss of Green Tea with Q10 Method and Weibull Hazard Analysis under Accelerated Shelf Life Testing
←
→
Page content transcription
If your browser does not render page correctly, please read the page content below
Hindawi
Journal of Chemistry
Volume 2022, Article ID 2955839, 10 pages
https://doi.org/10.1155/2022/2955839

Research Article
Evaluating Freshness Loss of Green Tea with Q10 Method and
Weibull Hazard Analysis under Accelerated Shelf Life Testing

 Mengxuan Xiao, Sitong Liu, Huozhu Jin, Mingji Xiao, Huiqiang Wang, Haiwei Zhang,
 and Qianying Dai
 State Key Laboratory of Tea Plant Biology and Utilization, Anhui Agricultural University, Hefei, Anhui 230036, China

 Correspondence should be addressed to Qianying Dai; daiqianying@ahau.edu.cn

 Received 9 July 2021; Revised 11 November 2021; Accepted 10 December 2021; Published 13 January 2022

 Academic Editor: Beatriz P. P. Oliveira

 Copyright © 2022 Mengxuan Xiao et al. This is an open access article distributed under the Creative Commons Attribution
 License, which permits unrestricted use, distribution, and reproduction in any medium, provided the original work is
 properly cited.
 The important quality of green tea is freshness, but high temperature, light, oxygen, and humidity during storage may reduce the
 freshness of green tea. Thus, this study investigated the freshness loss of green tea (FLGT) under an accelerated shelf-life testing
 (ASLT) by sensory evaluation and acceptability test. The FLGTs of the samples stored at 20°C, 30°C, and 40°C, were determined as 67
 days, 55 days, and 45 days, respectively by the Q10 method. In addition, they were further determined as 67 days, 57 days, and 42 days,
 respectively, by the Weibull Hazard Analysis (WHA). The sensory evaluation and acceptability test confirmed the correctness of the
 above results by 2-alternative choice analysis and chemical analysis. The Q10 method was applied to predict the FLGTs stored at 4°C
 and − 20°C which were 93 days and 150 days, which was further verified by 2-alternative choice analysis and chemical analysis. The
 results show that it is possible to predict the suitable drinking period of green tea during storage by the Q10 method.

1. Introduction (ASLT) is a process of testing a product under accelerated
 conditions to predict the shelf life of a product under typical
Green tea (Camellia sinensis (L.) O. Ktze) is one of the most storage conditions [9]. Basically, elevated temperature
popular functional beverages in the world because of its condition is normally applied to the ASLT to expedite the
antioxidant and anticancer activities and prevention of deterioration process, whereas Q10 method is used to esti-
metabolic disease and neurodegenerative disease [1–4]. mate the shelf life of a product through the chemical reaction
Basically, fresh green tea leaves normally were thermally rate alteration in response to every 10-degree rise in tem-
treated to inactivate the endogenous enzymes and dehy- perature [10]. Sensory evaluation plays an important role in
dration after harvest to yield dried green tea, and such the ASLT, and quality-based method and survival analysis
treatments can preserve bioactive compounds and freshness are two common methods used in the sensory evaluation [9].
attributes of green tea [5]. While green tea would lose its In the quality-based method, the quality difference will be
freshness by high temperature, light, oxygen, and humidity established between the fresh product and products treated
during storage, when green tea loses its freshness, it exhibits through ASLT [9]. For example, a seven-point scale
dark yellow color with an obviously stale aroma [6], which judgement has been established by Hough and Freitas be-
may decrease pharmacological activity [7]. Therefore, it is tween the fresh and stored commercial ricotta cheese with 0
significantly important to establish a reliable method on point as no difference and 6 points as the biggest difference
evaluating the freshness loss of green tea (FLGT) during [11].
storage. Survival analysis in ASLT refers to a sensory judgement
 Accelerated shelf-life testing (ASLT) was conducted and on the acceptance of a product by customers after
temperature sensitivity (Q10) was measured to investigate accelerated treatment, and Weibull Hazard Analysis (WHA)
the freshness of food [8]. Accelerated shelf-life testing is a normal analytical approach for the sensory judgement
2 Journal of Chemistry

[9]. It has been accepted that the quality turning point for a appearances of tea leaves, the tea infusion color, aroma, and
product after accelerated treatment will be determined when taste with weight coefficients of 30%, 20%, 30%, and 20%,
its sensory acceptance fails from 50% of the panelists [12]. respectively, has been evaluated by weighted sum method.
For example, an investigation on the storage period of fresh-
cut apples quality using WHA has indicated that the fresh-
cut apples stored at 4°C could have 7.5-day shelf life [13]. It 2.3. Evaluating the FLGT by the Q10 Method. Q10 is defined as
has been reported that Njangsa seed oil after a 21-week shelf- the temperature sensitivity of a reaction, which describes the
life period will not be accepted by more than 50% of panel increase of reaction (or growth) rate or the decrease of shelf
judges in terms of its taste under WHA [14]. life for a 10°C increase in temperature, and it is usually
 Few studies have been conducted to determine the FLGT assumed to be constant over a narrow range of temperature.
with storage process to the best of our knowledge. Therefore, It has been used to predict quality or nutrient losses for many
this paper applies ASLT to investigate the FLGT by sensory foods [15]. Here, it is used to determine the FLGT of the
evaluation, the Q10 method, and WHA, for establishing a green tea samples in ASLT. Q10 of the green tea samples can
reliable approach to predict the FLGT. be calculated using the following equation [16]:
 θ (T 1 )
 QΔT/10 � , ΔT � T2 − T1 , (1)
2. Materials and Methods 10
 θ(T 2 )
2.1. Green Tea Samples and Chemicals. Huangshan Maofeng where T1 and T2 represent storage temperatures at 30°C and
green tea (Camellia sinensis (L.) O. Ktze) is used as the 40°C, respectively, and θ(T1 ) and θ(T2 ) are found to be the
sample in the present study. The green tea samples are times when the tea samples stored at 30°C and 40°C lose their
provided from West Huangshan Tea Manufacturer freshness according to the weighted score in the sensory
(Huangshan, Anhui, China). According to the manufac- evaluation, respectively.
turer, the fresh green tea leaves after harvest are immediately
fixed using the thermal treatment to prevent green tea leaves
from fermentation under the standard operating procedure 2.4. Evaluating the FLGT by WHA. The WHA of these tea
of the green tea production. Afterwards, the green tea leaves samples has been carried out according to a published method
are dehydrated to a moisture content below 5.73%, and then with minor modifications using the same panelists in tea
the dehydrated green tea leaves (9.0 kg) are immediately sensory evaluation [17]. A total of 10 panelists, 4 males and 6
packed in 50 g/aluminum foil zip-lock bag with vacuum. females with an age range of 20 to 40 years, have the basic
 These green tea samples are randomly divided into 5 knowledge on the sensory evaluation and complete a 2-hour
groups and stored at − 20°C, 4°C, 20°C, 30°C, and 40°C. The tea sensory evaluation training program. There are two
stored green tea samples at − 20°C can be considered as fresh panelists in the beginning of the sensory evaluation. In the
tea, and the stored green tea samples at 20°C, 30°C, and 40°C, process of sensory evaluation, if all the panelists accept the
are prepared for the Q10 method and WHA in ASLT. The sample to be fresh, just one more panelist is added in the next
freshness duration of the stored green tea samples at 4°C will sensory evaluation. If there are unacceptable attitudes, the
be evaluated and predicted. number of unacceptable panelists was also extra added except
 Folin-Ciocalteu reagent was purchased from Beijing the former one panelist in the following sensory evaluation
Solarbio Science & Technology Co., Ltd. (Beijing, China). [18]. The panelists considered that all sensory attributes of the
(+)-Catechin (C), (-)-epicatechin (EC), (-)-epigallocatechin tea sample can be accepted by putting “✓” after the name of
(EGC), (-)-gallocatechin (GC), (-)-epicatechin gallate the tea sample; otherwise, they were marked with “✕,” and the
(ECG), (-)-gallocatechin gallate (GCG), EGCG, and GA sensory evaluation would be conducted every five days until
were purchased from Sigma-Aldrich (St. Louis, MO, USA). more than 50% of the panelists thought the tea sample was
HPLC grade methanol and acetonitrile were a product of unaccepted. Let h(x) denote a hazard value at time x obtained
Tedia Co., Ltd. (Fairfield, OH, USA). by
 1
 h(x) � 100, (2)
2.2. Establishing Nine-Point Scale by Sensory Evaluation. k
A sensory evaluation is carried out in a panel room with where k is the reverse rank of failed products (rank k and h(x)
constant temperature (25°C) and humidity (75%) in the State are given by columns 1 and 3 in Table 1). For each failure time,
Key Laboratory of Tea Plant Biology and Utilization, Anhui xi, the cumulative hazard value is calculated by summing the
Agricultural University. Each tea sample (3.0 g) stored at hazard value and all preceding hazard values. The cumulative
20°C, 30°C, and 40°C is extracted with 150 mL of boiling hazard can be obtained from the following equation:
water for 4 min. The tea appearance and the color, aroma,
 I
and taste of tea infusion are compared with the fresh control
 h(T) � hti . (3)
tea leaves (stored at − 20°C). A total of 6 profession panelists I�i
(a man and five women) are asked to describe their dif-
ference, from which the nine-point scale will be established It should be noted that the cumulative hazard values can
according to a published method [11] with minor modifi- be larger than 100%. The cumulative distribution function
cations. The overall tea sensory quality, including the F(t) of the Weibull model can be expressed as
Journal of Chemistry 3

 Table 1: Weibull hazard ranking table for tea samples under the ASLT (20°C, 30°C, and 40°C).
Storage temperature (°C) Reverse rank k Age at termination (days) Hazard 100\k Cumulative hazard (%)
 12 50 8.33 8.33
 11 50 9.09 17.42
 10 60 10.00 27.42
 9 65 11.11 38.54
 8 65 12.50 51.04
 7 65 14.29 65.32
20
 6 67 16.67 81.99
 5 67 20.00 101.99
 4 67 25.00 126.99
 3 67 33.33 160.32
 2 67 50.00 210.32
 1 67 100.00 310.32
 18 40 5.56 5.56
 17 40 5.88 11.44
 16 45 6.25 17.69
 15 45 6.67 24.35
 14 50 7.14 31.50
 13 50 7.69 39.19
 12 50 8.33 47.52
 11 50 9.09 56.61
 10 50 10.00 66.61
30
 9 50 11.11 77.73
 8 55 12.50 90.23
 7 55 14.29 104.51
 6 55 16.67 121.18
 5 55 20.00 141.18
 4 55 25.00 166.18
 3 55 33.33 199.51
 2 55 50.00 249.51
 1 55 100.00 349.51
 17 25 5.88 5.88
 16 25 6.25 12.13
 15 30 6.67 18.80
 14 30 7.14 25.94
 13 35 7.69 33.63
 12 35 8.33 41.97
 11 40 9.09 51.06
 10 40 10.00 61.06
40 9 40 11.11 72.17
 8 45 12.50 84.67
 7 45 14.29 98.96
 6 45 16.67 115.62
 5 45 20.00 135.62
 4 45 25.00 160.62
 3 45 33.33 193.96
 2 45 50.00 243.96
 1 45 100.00 343.96

 t shelf life. When the test is extended beyond shelf life, most of
 F(t) � 1 − exp − − β . (4)
 α samples are judged as unacceptable shifting β outside the
 optimum range [18].
 The relationship between H(t) and F(t) can be expressed
in the following form:
 t 2.5. Verifying the FLGT by 2-Alternative Choice. The com-
 H(t) � − ln[1 − F(t)] � − β. (5) parison between fresh green tea and stale green tea at 20°C,
 α
 30°C, and 40°C is carried out using the 2-alternative choice
 So, we can perform data analysis based on this formula [19]. analysis based on a published method [20]. A total of 20
 This probability corresponds to a Weibull percentile of undergraduates majored in Tea Science in Anhui Agricul-
69.3%. The shape factor (β) is determined as 1/slope. The tural University (Hefei, Anhui, China) participated in this
range of β is 2 < β < 4, which leads to better estimations of experiment. These students were 9 males and 11 females and
4 Journal of Chemistry

their ages were between 20 and 30 years. These panelists have weighted score means both acceptable and slightly un-
basic sensory evaluation knowledge and have been trained acceptable. The higher the number, the greater the ac-
specifically on distinguishing the fresh and stale odor from ceptability. For example, a score of 4 points was regarded
green tea. It has been reported that a minimum number of as no difference with fresh tea and a score of − 4 points was
correct judgements to establish significance at various entirely unacceptable as fresh tea. The overall tea sensory
probability levels for paired difference was 15 out of 20 total quality, including the appearances of tea leaves and the
participants under a significance level of 0.05 [21]. During tea infusion color, aroma, and taste with weight coeffi-
the analysis, two tea samples are randomly numbered and cients of 30%, 20%, 30%, and 20%, respectively, has been
given to panelists. The panelists are asked to judge whether evaluated by weighted sum method. The next Q10, WHA,
the two tea samples are both fresh. The FLGT is determined and 2-alternative choice analysis are all based on the
at regular storage temperature by the Q10 method. The green nine-point scale.
tea samples stored at − 20°C and 4°C for 93 days and 150 days,
respectively, have been compared in terms of the appear-
ances of the leaves and the infusion colors, aromas, and 3.2. Evaluating the FLGT by the Q10 Method Based on Nine-Point
tastes under a professional panel. These panelists will be Scale. Table 3 lists the score of the attribute factors and the
asked to give score according to a nine-point scale. weighted score of these tea samples stored at 20°C, 30°C, and
 40°C, respectively. We can observe that the weighted scores
 of all tea samples decrease during storage and eventually
2.6. Verifying the FLGT by Chemical Analysis. Contents of tea reach negative points, and the higher storage temperature,
polyphenols (TPs) were determined by the Chinese National the less time to reach the negative points. Tea stored at 20°C,
Standard GB/T 8313-2008. Catechins, including C, EC, 30°C, and 40°C got negative point and lost its freshness at 70
EGC, GC, ECG, GCG, and EGCG, in the tea leaves were days, 55 days, and 45 days, respectively, which indicates that
analyzed on an Agilent 1260 HPLC system. A Venusil C18 the high storage temperature can accelerate freshness loss of
column (4.6 × 250 mm, 5 μm) was used to separate these green tea.
compounds (Agilent Technologies, Santa Clara, CA, USA) It is found that the FLGTs are 55 days and 45 days at 30°C
under a 1.0 mL/min flow rate. Mobile phase consisted of (A) and 40°C, respectively (Table 3), which can infer that Q10 of
acetonitrile and (B) 1% acetic acid (v/v) in acetonitrile. A the green tea samples is 11/9 by equation in Methods.
gradient program was as follows: 0 to 7 min, 10% to 30% A; 7 Additionally, the FLGT stored at 20°C can be further cal-
to 10 min, 30% A isocratic; 10 to 12 min, 30% to 60% A; 12 to culated using the following equation:
15 min, 60% to 10% A; and 15 to 20 min, 10% A isocratic. 20)/10
The column was maintained at 40°C during the gradient θ(20° C) � θ(30° C) × Q(30− . (6)
program. The injection volume was set at 5 μL and the
wavelength of the ultraviolet detector was 278 nm. External In the above equation, θ(30° C) is 55 days and Q(30− 20)/10 is 11/9.
standard, catechin, was used for the quantitation of cate- The FLGT stored at 20°C can be obtained as 67 days according
chins in the tea infusion, respectively. All data were repeated to the Q10 method. In our sensory evaluation result, the
three times and recorded as mean ± standard deviation (SD). weighted score was 0.58 at 65 days and was − 0.88 at 70 days,
 which means that the FLGT stored at 20°C is between 65 and
 70 days. The FLGT obtained by the Q10 method agrees well
2.7. Statistical Analysis. Data have been expressed as the with that of sensory evaluation at 20°C. The tea after the FLGT
mean ± standard deviation (SD) of triplicate tests. The plot exhibits a yellowish leaves appearance and its infusion is
between Weibull percentiles and storage time has been obviously yellow color with strong stale aroma and nonfresh
drafted using Origin 9.0 software (Origin Lab Corp., taste according to our panelists.
Northampton, MA, USA). Heat map was performed using
TBtools software (https://github.com/CJ-Chen/TBtools).
The 2-alternative choice data have been programmed into 3.3. Evaluating the FLGT by WHA. In the WHA, the pan-
minimum numbers of correct judgements to establish sig- elists will be asked to judge whether the tea sample after
nificance at various probability levels according to a pub- different storage periods will be still considered acceptable as
lished method [21]. fresh tea in terms of the overall quality of tea (Table 4). The
 overall quality of the tea samples was identified as “not
3. Results accepted” when more than half of the panelists marked a
 “✕.” Table 1 shows Weibull hazard ranking for tea samples
3.1. Establishment of Nine-Point Scale. A nine-point scale stored at an accelerated shelf-life condition (20°C, 30°C, and
can be established by sensory evaluation (Table 2), in 40°C). According to the WHA, the betas (β) at three tem-
which the factor with positive points means no/slight/ peratures are 3.37, 3.13, and 3.42, respectively, which meet
some/visible difference with fresh tea, and the factor with the requirements of Weibull distribution for β and indicate
negative points means entirely/visibly/slightly/some that Figure 1 can accurately predict the FLGT at three
unacceptable as fresh tea. It is suggested that tea sample temperatures. Probability Weibull plot of time is shown on
with a positive weighted score will be considered as fresh Figure 1. The FLGT is the time when the Weibull percentile
tea, whereas the tea with a negative weighted score will be reached 69.3% [18]. The FLGTs are 67 days, 57 days, and 42
regarded as nonfresh tea. The tea sample with zero days for the samples stored at 20°C, 30°C, and 40°C,
Journal of Chemistry 5

 Table 2: Establishment of nine-point scale and sensory attributes description.
 Description
Score of Difference from fresh
difference tea Infusion aroma Infusion taste
 Appearance (30%) Infusion color (20%)
 (30%) (20%)
 Clean and pure,
4.0 No difference Yellowish green, emerald and vivid Green and bright Mellow and fresh
 refreshing
 Yellowish green, emerald and Green and bright, Clean and pure, Mellow and less
3.0 Slight difference
 slightly vivid slightly yellow less refreshing fresh
 Clean and pure
 Yellowish green, emerald and some Yellowish green and Mellow with little
2.0 Some difference with little
 bright bright fresh
 refreshing
 Some thick
 Yellowish green, emerald part
1.0 Visible difference Yellowish green Clean and pure feeling, without
 turns yellowish green
 freshness
 Yellowish green and
 Both acceptable and Little clean and Neutral, just tea
0.0 Yellowish green, no emerald the yellow part is
 slightly unacceptable pure taste
 light
 Greenish yellow and
 Yellowish green or greenish yellow,
− 1.0 Slightly unacceptable the yellow part is Unscented A little stale taste
 the main color is undistinguishable
 light
 Greenish yellow or yellow, a little dull odor
− 2.0 Some unacceptable Greenish yellow Some stale taste
 obviously and stale
 Yellow and a little auburn or dry
− 3.0 Visibly unacceptable Yellow Some stale odor More stale taste
 yellow
− 4.0 Entirely unacceptable Auburn yellow Deep yellow Stale odor Stale taste

 Table 3: Sensory attribute score and weighted score of tea samples under the ASLT (20°C, 30°C, and 40°C).
 Score
Storage temperature (°C) Time (days) Weighted score
 Leaves appearance Infusion color Infusion aroma Infusion taste
 0 4.00 ± 0.00 4.00 ± 0.00 4.00 ± 0.00 4.00 ± 0.00 4.00
 5 3.50 ± 0.00 3.77 ± 0.73 3.50 ± 0.21 3.50 ± 0.80 3.00
 10 2.58 ± 0.65 3.50 ± 1.06 4.00 ± 1.04 3.50 ± 1.12 3.37
 15 2.30 ± 0.29 3.30 ± 0.58 2.40 ± 0.51 3.00 ± 0.00 2.67
 20 2.40 ± 0.42 2.87 ± 0.37 1.75 ± 0.21 3.50 ± 0.50 2.52
 25 1.80 ± 0.63 0.80 ± 0.11 0.30 ± 0.41 1.50 ± 0.58 1.09
 30 0.00 ± 0.58 0.00 ± 0.00 0.67 ± 0.58 1.83 ± 0.29 0.57
20 35 2.20 ± 0.29 2.80 ± 0.76 2.00 ± 0.00 2.20 ± 0.29 2.26
 40 0.70 ± 0.58 0.60 ± 0.55 1.30 ± 0.45 1.05 ± 0.58 1.02
 45 − 1.50 ± 0.80 − 0.30 ± 0.00 1.50 ± 0.53 1.00 ± 0.20 0.14
 50 0.70 ± 0.52 − 1.00 ± 1.10 0.40 ± 1.06 2.00 ± 0.63 0.53
 55 0.70 ± 1.11 0.30 ± 1.40 0.30 ± 0.19 1.60 ± 1.13 0.68
 60 0.42 ± 0.29 1.40 ± 0.20 0.00 ± 0.34 1.40 ± 0.53 0.69
 65 − 0.16 ± 0.68 0.50 ± 0.22 0.75 ± 0.37 1.50 ± 1.11 0.58
 70 − 1.00 ± 0.18 − 1.00 ± 0.21 − 0.50 ± 0.65 − 1.00 ± 0.55 − 0.88
 0 4.00 ± 0.00 4.00 ± 0.00 4.00 ± 0.00 4.00 ± 0.00 4.00
 5 2.00 ± 0.41 2.80 ± 0.41 2.80 ± 0.34 2.30 ± 0.52 2.46
 10 2.71 ± 0.46 2.20 ± 0.12 2.57 ± 1.04 2.68 ± 0.59 2.56
 15 2.80 ± 0.29 2.00 ± 1.00 3.00 ± 0.58 2.00 ± 1.00 2.54
 20 2.40 ± 0.55 2.50 ± 0.50 2.30 ± 0.74 2.60 ± 0.55 2.43
 25 1.50 ± 0.34 2.00 ± 0.39 0.16 ± 0.55 2.50 ± 1.20 1.40
 30 1.00 ± 0.19 0.00 ± 0.11 1.00 ± 0.49 1.00 ± 1.17 0.80
30 35 1.00 ± 0.50 1.00 ± 0.35 1.00 ± 0.00 1.00 ± 0.90 1.00
 40 0.80 ± 1.00 − 0.30 ± 0.08 − 1.00 ± 0.29 − 2.00 ± 0.30 0.10
 45 − 1.30 ± 0.53 1.00 ± 0.00 0.00 ± 0.15 1.00 ± 0.00 0.01
 50 − 0.50 ± 0.61 1.00 ± 0.46 0.00 ± 0.14 2.00 ± 0.16 0.25
 55 − 1.30 ± 0.39 − 1.60 ± 0.60 − 1.00 ± 0.71 − 0.67 ± 0.51 − 1.14
 60 − 0.71 ± 0.76 − 1.00 ± 0.58 − 1.67 ± 0.52 0.14 ± 0.69 − 0.59
 65 − 1.00 ± 0.75 − 0.60 ± 0.75 − 2.00 ± 0.39 0.00 ± 0.33 − 0.62
 70 − 1.60 ± 0.55 − 2.30 ± 0.29 − 2.20 ± 0.34 − 0.20 ± 0.84 − 1.64
6 Journal of Chemistry

 Table 3: Continued.
 Score
Storage temperature (°C) Time (days) Weighted score
 Leaves appearance Infusion color Infusion aroma Infusion taste
 0 4.00 ± 0.00 4.00 ± 0.00 4.00 ± 0.00 4.00 ± 0.00 4.00
 5 2.50 ± 0.55 2.30 ± 0.52 2.75 ± 0.67 2.25 ± 0.32 2.49
 10 2.60 ± 0.76 3.25 ± 0.36 2.20 ± 0.57 1.80 ± 0.19 2.45
 15 1.00 ± 0.00 2.00 ± 0.00 1.00 ± 0.56 2.00 ± 0.00 1.40
 20 1.50 ± 0.50 1.25 ± 0.39 1.00 ± 0.45 1.60 ± 0.55 1.32
 25 0.40 ± 0.67 − 0.25 ± 0.16 0.00 ± 0.00 0.00 ± 0.60 0.07
 30 0.50 ± 0.16 0.30 ± 0.25 − 1.00 ± 0.29 1.00 ± 0.50 0.11
40 35 0.75 ± 0.50 1.00 ± 0.58 1.30 ± 0.41 2.00 ± 0.58 1.22
 40 0.00 ± 0.29 − 0.25 ± 0.23 0.00 ± 0.57 0.80 ± 0.00 0.11
 45 − 2.00 ± 0.15 − 0.67 ± 1.00 − 1.67 ± 0.66 − 0.50 ± 0.75 − 1.34
 50 − 1.70 ± 0.28 − 2.17 ± 0.18 − 1.80 ± 0.17 0.40 ± 0.75 − 1.40
 55 − 1.90 ± 0.19 − 1.90 ± 0.90 − 2.60 ± 0.60 − 0.85 ± 0.35 − 1.90
 60 − 2.00 ± 0.58 − 1.40 ± 0.31 − 1.60 ± 0.83 − 0.71 ± 0.65 − 1.50
 65 − 1.80 ± 0.17 − 1.30 ± 0.32 − 1.30 ± 0.39 − 1.00 ± 0.27 − 1.39
 70 − 2.40 ± 0.30 − 0.67 ± 0.45 − 1.75 ± 1.14 − 1.00 ± 0.34 − 1.58
Data were the mean ± standard deviation of triplicate tests for leaves appearance, as well as infusion color, aroma, and taste.

 Table 4: Acceptability test of tea samples under the ASLT (20°C, 30°C, and 40°C).
Storage temperature (°C) Time (days) Individual description Overall description
 5 ✓ ✓ Accept
 10 ✓ ✓ ✓ Accept
 15 ✓ ✓ ✓ ✓ Accept
 20 ✓ ✓ ✓ ✓ ✓ Accept
 25 ✓ ✓ ✓ ✓ ✓ ✓ Accept
 30 ✓ ✓ ✓ ✓ ✓ ✓ ✓ Accept
 35 ✓ ✓ ✓ ✓ ✓ ✓ ✓ ✓ Accept
 40 ✓ ✓ ✓ ✓ ✓ ✓ ✓ ✓ ✓ Accept
 45 ✓ ✓ ✓ ✓ ✓ ✓ ✓ ✓ ✓ ✓ Accept
20
 ✕ ✕
 50 ✓ ✓ ✓ ✓ ✓ ✓ ✓ ✓ Accept
 11 12
 55 ✓ ✓ ✓ ✓ ✓ ✓ ✓ ✓ ✓ ✓ Accept
 ✕
 60 ✓ ✓ ✓ ✓ ✓ ✓ ✓ ✓ ✓ Accept
 10
 ✕ ✕ ✕
 65 ✓ ✓ ✓ ✓ ✓ ✓ ✓ Accept
 7 8 9
 ✕ ✕ ✕ ✕ ✕ ✕
 70 ✓ ✓ ✓ ✓ Reject
 1 2 3 4 5 6
 5 ✓ ✓ Accept
 10 ✓ ✓ ✓ Accept
 15 ✓ ✓ ✓ ✓ Accept
 20 ✓ ✓ ✓ ✓ ✓ Accept
 25 ✓ ✓ ✓ ✓ ✓ ✓ Accept
 30 ✓ ✓ ✓ ✓ ✓ ✓ ✓ Accept
 35 ✓ ✓ ✓ ✓ ✓ ✓ ✓ ✓ Accept
30 ✕ ✕
 40 ✓ ✓ ✓ ✓ ✓ ✓ ✓ Accept
 16 17
 ✕ ✕
 45 ✓ ✓ ✓ ✓ ✓ ✓ ✓ ✓ Accept
 14 15
 ✕ ✕ ✕ ✕ ✕
 50 ✓ ✓ ✓ ✓ ✓ Accept
 9 10 11 12 13
 ✕ ✕ ✕ ✕ ✕ ✕ ✕ ✕
 55 ✓ ✓ Reject
 1 2 3 4 5 6 7 8
Journal of Chemistry 7

 Table 4: Continued.
Storage temperature (°C) Time (days) Individual description Overall description
 5 ✓ ✓ Accept
 10 ✓ ✓ ✓ Accept
 15 ✓ ✓ ✓ ✓ Accept
 20 ✓ ✓ ✓ ✓ ✓ Accept
 ✕ ✕
 25 ✓ ✓ ✓ ✓ Accept
 16 17
 ✕ ✕
40 30 ✓ ✓ ✓ ✓ ✓ ✓ ✓ Accept
 14 15
 ✕ ✕
 35 ✓ ✓ ✓ ✓ ✓ ✓ ✓ ✓ Accept
 12 13
 ✕ ✕ ✕
 40 ✓ ✓ ✓ ✓ ✓ ✓ ✓ Accept
 9 10 11
 ✕ ✕ ✕ ✕ ✕ ✕ ✕ ✕
 45 ✓ ✓ Reject
 1 2 3 4 5 6 7 8
A “✓” was checked when the panelists accepted the overall quality of the tea, whereas the tea with its overall quality not accepted by the panelists was given a
“✕” in the analysis.

 99.9 99.9
 99 99

 90 90

 69.3 69.3
 Weibull Percentiles (%)

 Weibull Percentiles (%)

 50 50

 10 10

 5 5

 1 1

 10 67 100 10 67 100
 Time (Day) Time (Day)

 Percentiles Percentiles
 Reference line Reference line
 95% confidence band 95% confidence band
 (a) (b)
 Figure 1: Continued.
8 Journal of Chemistry

 99.9
 99

 90

 69.3

 Weibull Percentiles (%)
 50

 10

 5

 1

 10 67 100
 Time (Day)

 Percentiles
 Reference line
 95% confidence band
 (c)

Figure 1: Probability Weibull plot of time. (a) Tea samples were stored at 20°C; (b) tea samples were stored at 30°C; (c) tea samples were
stored at 40°C.

respectively. Evaluations of the FLGTs by WHA are almost Furthermore, the tea samples could be completely divided
well consistent with the results from the sensory evaluation into two categories by hierarchical cluster analysis (Figure 2).
and the Q10 method. The same batch of tea samples was sampled at intervals. In the
 early stage of storage, although the temperature was different,
 the compounds content in the tea samples changed little, and
3.4. Verifying the FLGT by 2-Alternative Choice. We find that they were clustered into one category, which was fresh tea
a total of 17 panelists can distinguish the freshness difference group (blue box in Figure 2). At the same time, the remaining
between the fresh tea sample and the tea sample stored at 40°C samples were clustered into another category called stale tea
for 45 days. Meanwhile, a difference on the freshness between group, in which it was worth noting that the four tea samples
the fresh tea sample and the tea stored at 30°C for 55 days has at 20°C for 67 days, 20°C for 65 days, 30°C for 55 days, and
been also confirmed by 18 panelists. 16 panelists gave a 40°C for 45 days were clustered together alone (red box in
different judgement between the fresh tea and the tea stored at Figure 2), which were consistent with the results of FLGT by
20°C for 67 days. All the three numbers are greater than 15; sensory evaluation.
therefore, all these stored tea samples exhibit the significant
difference compared to the fresh tea sample in terms of their
freshness. The analysis of the FLGT using 2-alternative choice 3.6. Evaluating the FLGT at Regular Storage Temperature by
approach further verifies the results of the tea samples under the Q10 Method. According to the theory of the Q10 method,
the ASLT. This also indicates that the alterations in the quality Q10 of these tea samples in this study is 11/9. Therefore, the
attributes (leaves appearance, as well as tea infusion color, freshness duration time for the tea sample stored at 4°C and
aroma, and taste) of the tea sample under the ASLT can − 20°C can be theoretically predicted to be 93 days and 150
provide reliable information on the investigation of freshness days, respectively, as shown in Table 5.
loss of green tea under a regular temperature condition. In order to verify the evaluated freshness duration for the
 tea samples stored at 4°C and − 20°C, a sensory evaluation has
 been also carried out using the tea samples stored at 4°C for
3.5. Verifying the FLGT by Chemical Analysis. To further 93 days and the tea samples stored at − 20°C for 150 days with
verify the correctness of the sensory results, we tested the 6 professional panelists (Table 5). Appearance of the leaves
content of tea polyphenols and catechins, including C, EC, and infusion color of tea stored at 4°C for 93 days exhibit
EGC, GC, ECG, GCG, and EGCG, in the tea samples at each some difference/visible difference with the fresh tea. How-
stage of the ASLT. The results showed that the polyphenols ever, the aroma and taste exhibit mean with some unac-
and catechins in the tea samples had some changes during the ceptable/slightly unacceptable appearances and get a
ASLT. Contents of GA, EGC, GCG, and ECG decreased, and negative overall weighted score (Table 5). The panelists
contents of TPs, EC, and EGCG first increased and then describe the quality of green tea stored at 4°C for 93 days as
decreased, while C content increased during the ASLT. aged and stale and the tea gets “Reject” in the acceptability
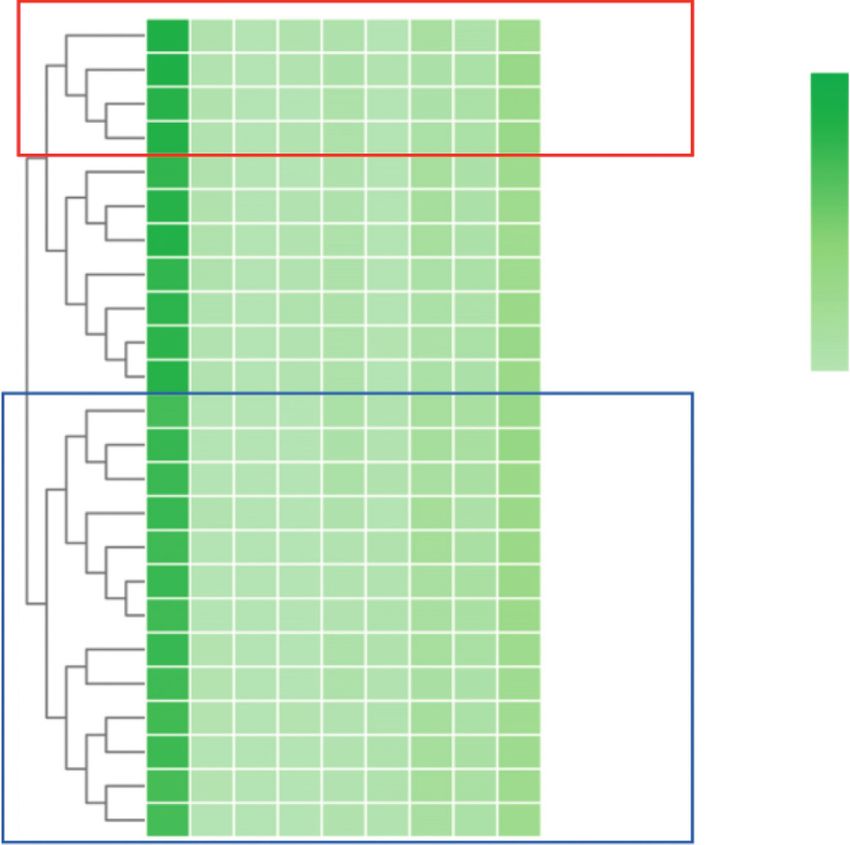
Journal of Chemistry 9

 40°C-45 d Compounds (mg/g)
 FLGT 30°C-55 d 300.00
 20°C-65 d
 20°C-67 d 250.00
 Stale
 30°C-45 d 200.00
 30°C-50 d
 150.00
 40°C-40 d
 20°C-70 d 100.00
 40°C-50 d 50.00
 20°C-55 d
 0.00
 30°C-60 d
 40°C-30 d
 20°C-30 d
 30°C-30 d
 30°C-40 d
 30°C-10 d
 20°C-20 d
 Fresh
 30°C-20 d
 20°C-40 d
 20°C-45 d
 0d
 20°C-10 d
 40°C-10 d
 40°C-20 d
 TPs
 C
 GA
 GC
 EC
 EGC
 GCG
 ECG
 EGCG

 Figure 2: Hierarchical cluster analysis (HCA) for tea samples under the ASLT (20°C, 30°C, and 40°C).

 Table 5: Sensory evaluation and acceptability test of FLGT stored at 4°C for 93 days and at − 20°C for 150 days.
 Score
Store temperature (°C) Time (days) Weighted score Acceptability
 Leaves appearance Infusion color Infusion aroma Infusion taste
4 93 2.00 ± 0.35 1.00 ± 0.00 − 2.00 ± 0.90 − 1.00 ± 0.25 − 0.18 Reject
− 20 150 3.50 ± 0.45 4.00 ± 0.19 3.00 ± 0.00 2.75 ± 0.33 3.30 Accept
Data were the mean ± standard deviation of triplicate tests for leaves appearance, as well as infusion color, aroma, and taste.

test, which also verifies that the method is reliable to evaluate Q10 method, and the FLGT of the tea samples stored at 4°C
the FLGT by the Q10 method. has also been verified by acceptability test. Therefore, this
 The appearances of the leaves and the color, aroma, and paper can predict the suitable drinking period of green tea
taste of the tea stored at − 20°C for 150 days get positive stored at a certain temperature, provide a theoretic in-
scores, with no or slight difference compared to the fresh tea struction to keep fresh green tea, and suggest that re-
(Table 5), and the panelists describe the quality of tea as searchers should conduct their experiments before the
almost fresh, which means that the tea samples stored at FLGT.
− 20°C for 150 days also remain fresh and do not reach the
FLGT. Abbreviations
4. Conclusions FLGT: Freshness loss of green tea
 Q10: Temperature sensitivity
The suitable drinking period of green tea is relatively ASLT: Accelerated shelf-life testing
short, so it is important to explore the FLGT. In this paper, WHA: Weibull Hazard Analysis
the FLGTs of tea samples stored at 20°C, 30°C, and 40°C HPLC: High-performance liquid chromatography
have been evaluated to be 67 days, 55 days, and 45 days TPs: Tea polyphenols.
using the Q10 method and WHA in ASLT based on nine-
point scale sensory evaluation and acceptability test Data Availability
session. The results have also been verified by 2-alternative
choice analysis and chemical analysis. The FLGT of the tea The data used to support the findings of this study are in-
samples stored at 4°C was predicted to be 93 days using the cluded within the article.
10 Journal of Chemistry

Conflicts of Interest commercial ricotta cheese,” Journal of Dairy Science, vol. 82,
 no. 1, pp. 454–459, 1999.
The authors declare that there are no conflicts of interest [12] G. Hough, K. Langohr, G. Gómez, and A. Curia, “Survival
regarding the publication of this paper. analysis applied to sensory shelf life of foods,” Journal of Food
 Science, vol. 68, no. 3, pp. 359–362, 2003.
 [13] E. Torrieri, R. D. Monaco, S. Cavella, and P. Masi, “Fresh-cut
Authors’ Contributions annurca apples: Acceptability study and shelf-life determi-
 nation,” Journal of Sensory Studies, vol. 23, no. 3, pp. 377–397,
Qianying Dai, Mengxuan Xiao, Sitong Liu, and Huozhu Jin
 2008.
designed the study, interpreted the results, and drafted the [14] K. Harold, A. Abaidoo, G. Prince et al., “Compositional
manuscript. Mingji Xiao, Huiqiang Wang, and Haiwei analysis and shelf-life modeling of Njangsa (Ricinodendron
Zhang collected test data. Mengxuan Xiao and Sitong Liu heudelotii) seed oil using the Weibull Hazard Analysis,”
contributed equally to this work. Journal of Food Science, vol. 82, no. 8, pp. 34–40, 2017.
 [15] F. Bin and T. P. Labuza, “Shelf-life prediction: Theory and
Acknowledgments application,” Food Control, vol. 4, no. 3, pp. 25–133, 1993.
 [16] K. R. Davey, “A predictive model for combined temperature
This study was financially supported by the National Natural and water activity on microbial growth during the growth
Science Foundation of China (331772057) and National Key phase,” Journal of Applied Bacteriology, vol. 67, no. 5,
Research and Development Program (2017YFD0400805). pp. 483–488, 1989.
 [17] M. C. Gacula and J. J. Kubala, “Weighting coefficients for the
 estimation of sensory threshold,” Narnia, vol. 3, no. 1,
References pp. 105–121, 1978.
 [18] C. Cardelli and T. P. Labuza, “Application of Weibull hazard
 [1] H. S. Wang, J. R. Chen, P. F. Ren, Y. W. Zhang, and analysis to the determination of the shelf life of roasted and
 O. S. Onyango, “Ultrasound irradiation alters the spatial grand coffee,” Lebensmittei-Wissenschaft & Technologie,
 structure and improves the antioxidant activity of the yellow vol. 34, no. 5, pp. 273–278, 2001.
 tea polysaccharide,” Ultrasonics Sonochemistry, vol. 4, no. 55, [19] N. Wayne, “Theory and applications of hazard plotting for
 p. 11, 2021. censored failure data,” Technometrics, vol. 42, no. 1, pp. 11–15,
 [2] H. Fujiki, T. Watanabe, E. Sueoka, A. Rawangkan, and 2000.
 M. Suganuma, “Cancer prevention with green tea and its [20] V. Braun, M. Rogeaux, N. Schneid, M. O. Mahony, and
 principal constituent, EGCG: from early investigations to B. Rousseau, “Corroborating the 2-afc and 2-ac thurstonian
 current focus on human cancer stem cells,” Molecules and models using both a model system and sparkling water,” Food
 Cells, vol. 41, no. 2, pp. 73–82, 2018. Quality and Preference, vol. 15, no. 6, pp. 501–507, 2004.
 [3] S.-Y. Cao, C.-N. Zhao, R.-Y. Gan et al., “Effects and mech- [21] E. B. Roessler, R. M. Pangborn, J. L. Sidel, and H. Stone,
 anisms of tea and its bioactive compounds for the prevention “Expanded statistical tables for estimating significance in
 and treatment of cardiovascular diseases: an updated review,” paired-preference, paired-difference, duo-trio and triangle
 Antioxidants, vol. 8, no. 6, pp. 166–182, 2019. tests,” Journal of Food Science, vol. 20, no. 1, pp. 32–43, 1978.
 [4] X. Chang, C. Rong, Y. Chen et al., “(− )-Epigallocatechin-3-gallate
 attenuates cognitive deterioration in Alzheimer’s disease model
 mice by upregulating neprilysin expression,” Experimental Cell
 Research, vol. 334, no. 1, pp. 136–145, 2015.
 [5] M. Gacula and S. Rutenbeck, “Sample size in consumer test
 and descriptive analysis,” Journal of Sensory Studies, vol. 21,
 no. 2, pp. 129–145, 2006.
 [6] Q. Dai, S. Liu, Y. Jiang et al., “Recommended storage tem-
 perature for green tea based on sensory quality,” Journal of
 Food Science and Technology, vol. 56, no. 9, pp. 4333–4348,
 2019.
 [7] J. L. Ros-Santaella, M. Kadlec, and E. Pintus, “Pharmaco-
 logical activity of honeybush (cyclopia intermedia) in boar
 spermatozoa during semen storage and under oxidative
 stress,” Animals, vol. 10, no. 3, pp. 463–475, 2020.
 [8] A. Ariano, L. Scarano, M. Barile, G. Palma, and N. Murru,
 “Shelf life of anchovy products (Engraulis encrasicolus):
 Evaluation of sensory, microbiological and chemical prop-
 erties,” Italian Journal of Food Safety, vol. 3, no. 1, pp. 9–11,
 2014.
 [9] G. Ana, A. Florencia, and A. Gastón, “Sensory shelf-life es-
 timation: A review of current methodological approaches,”
 Food Research International, vol. 49, no. 1, pp. 311–325, 2012.
[10] S. Mizrahi, D. Kilcast, and P. Subramaniam, “Accelerated
 shelf life testing of foods,” Food and Beverage Stability and
 Shelf Life, vol. 20, no. 1, pp. 482–506, 2011.
[11] G. Hough, M. L. Puglieso, R. Sánchez, D. Mendes, and
 O. Silva, “Sensory and microbiological shelf-life of a
You can also read