Evaluating California's Zero-Emission Vehicle (ZEV) Credits and Trading Mechanism and its Potential Suitability for Implementation in Chinese ...
←
→
Page content transcription
If your browser does not render page correctly, please read the page content below
November, 2014

Evaluating California's Zero-Emission Vehicle
(ZEV) Credits and Trading Mechanism and its
Potential Suitability for Implementation in
Chinese Cities
Acknowledgement
 We are gracious for the generous support of the Blue
 Moon Fund, as well as for the valuable comments
 provided by experts and colleagues. Special thanks to
 Tom Cackette for his instrumental guidance and
 inputs.

 Report Title
 Evaluating California's Zero-Emission Vehicle (ZEV)
 Credits and Trading Mechanism and its Potential
 Suitability for Implementation in Chinese Cities

 Report Date
 November 2014

 Authors
 Maya Ben Dror, Feng An, Daniel Ding, Ayaka Habu

The Innovation Center for Energy and Transportation
Phone: +86.10.65857324 | Fax: +86.10.65857394
Email: info@icet.org.cn | Website: www.icet.org.cn

 1

Content

Executive summary .................................................................................................................................................5
1. Background ..................................................................................................................................................... 10
2. Introduction toCalifornia’s Major Market-Oriented Low-Carbon Development
Programs: ZEV and cap-and-trade ................................................................................................................ 11
 2.1 California’s role: CARB’s major goals and tools ........................................................................ 11
 2.2 CARB’s ZEV-credits and cap-and-trade programs: a coherent framework?................. 13
 2.3 Chinese Cities: Goals, Tools, and Implementation Gaps ........................................................ 14
 2.4 Conclusions .............................................................................................................................................. 16
3. The ZEV-CreditsProgram .......................................................................................................................... 17
 3.1 ZEV-Credits program introduction ................................................................................................ 17
 3.1.1 ZEV-credits program history ....................................................................................... 17
 3.1.2 A short introduction to the ZEV regulation ........................................................... 20
 3.2 ZEV-credits quantitative assessment ............................................................................................ 28
 3.2.1 Meta-analysis: ZEV mandate evaluation................................................................ 28
 3.2.2 Tesla Motors Inc.case study ......................................................................................... 37
 3.2.2.1 Company introduction ......................................................................................... 39
 3.2.2.2 Market penetration: challenges and strategy............................................. 40
 3.2.2.3 ZEV contribution to Tesla’s market stabilization ...................................... 42
 3.2.2.4 ZEV credits’ role in Tesla’s product development ...................................... 44
 3.2.2.5 ZEV credits’ role in Tesla’s market expansion ............................................. 46
 3.2.2.6 ZEV credits’ role in Tesla’s financial market robustness ......................... 47
 3.2.2.7ZEV credits’ role in Tesla’s business development ...................................... 49
 3.2.2.8ZEV credits’ value in the case of Tesla ............................................................ 51
 3.3 ZEV-credits qualitative evaluation ................................................................................................. 51
 3.3.1 Key stakeholders interviews ...................................................................................... 51
 3.3.1.1 Underlying ZEV-credits design considerations ........................................... 52
 3.3.1.2 Major ZEV-credits management and implementationissues ................ 54
 3.3.1.3 Initial ZEV-credits related thoughts for the case of China ..................... 56
 3.3.2 Meta-analysis: Roles and responsibilities ............................................................. 57
 3.3.2.1 The role of government ....................................................................................... 57
 3.3.2.2 The role of industry............................................................................................... 60
 3.3.2.3 The role of third sector and other players .................................................... 62
 3.4 Conclusion ................................................................................................................................................ 63
4. The California Cap-and-Trade program .............................................................................................. 66
 4. 1 Introduction........................................................................................................................................... 66
 4.1.2 Fuel Suppliers .................................................................................................................... 67
 4.1.3 Covered Entities ................................................................................................................ 67
 4.1.4 Inclusion Thresholds ...................................................................................................... 68
 4.1.5 Allowance Allocation ...................................................................................................... 68
 4.1.6 Compliance Path ............................................................................................................... 69
 4.1.7 Penalties ............................................................................................................................... 71
 4.2 Cap-and-Trade qualitative evaluation: Key stakeholders interviews ............................. 71
 4.2.1Cap-and-trade influence over ZEV purchase choices and use-phase costs
 ............................................................................................................................................................. 71
 4.2.3The value of a separate cap-and-trade scheme for governing fuel ............... 72
 4.3 Conclusion ................................................................................................................................................ 73
5.Conclusions........................................................................................................................................................... 75
Appendix I................................................................................................................................................................. 77

 2

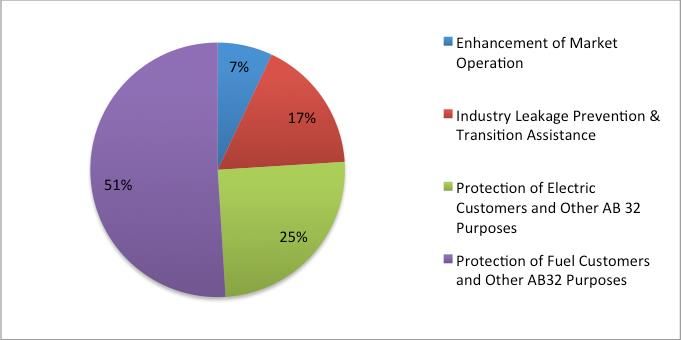
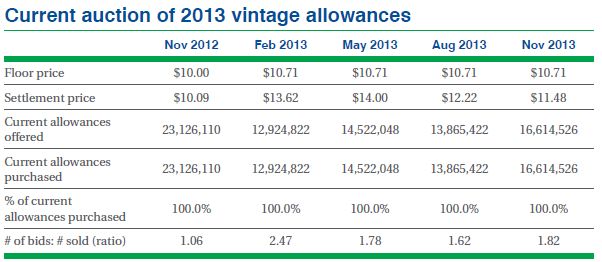
Appendix II ..................................................................................................................................................................0

List of Figures

Figure 1: An illustration of the linkage between the ZEV-credits and Cap-and-Trade ........... 13
Figure 2: Vehicle types emissions sources, by use-phase.................................................................... 14
Figure 3: California ZEV program – minimum ZEV floor throughout the years......................... 19
Figure 4: ZEV Requirements Simplified Broken From 2018 Down by Vehicle Types ............. 20
Figure 5: ZEV Credits Program Illustration ............................................................................................... 21
Figure 6: California and Federal Hydrocarbon Emissions Standard Development .................. 28
Figure 7: Fleet Average NMOG Compared with Most Stringent LEV Emissions Categories . 29
Figure 8: ZEV mandate phase in and commercial uptake ................................................................... 29
Figure 9: Battery Electric Vehicle Patents filed........................................................................................ 30
Figure 10: Hybrid (HEV) and Fuel Cell (PEM) Vehicle Patents filed ............................................... 30
Figure 11: Production Locations for MY 2015 Electric Vehicles Sold in the US ......................... 31
Figure 12: Projections of ZEV sales in California by major types in comparison to the ZEV
 requirement .................................................................................................................................................... 32
Figure 13: Total credits balance by company, Sep 2013 ..................................................................... 32
Figure 14: Credits balance of the top 5 “bankers” by credits type, Sep 2013 ............................. 33
Figure 15: Total credits balance by company as percentage of the total credits type, Sep
 2013.................................................................................................................................................................... 33
Figure 16: Annual ZEV credit generation predictions vs. requirements in California ............ 34
Figure 17: ZEV credit transfers out/in by company between October 1, 2013 and
 September 30, 2014..................................................................................................................................... 35
Figure 18: Annual trends of ZEV credit (excluding all PZEVs) transfer ........................................ 36
Figure 19: Annual trends of ZEV credit transfer (excluding all PZEVs) by company
 percentage ....................................................................................................................................................... 37
Figure 20: Annual contribution of major ZEV credit-transferring companies (excluding all
 PZEVs credits) ................................................................................................................................................ 38
Figure 21: JPM TSLA Vehicle Production Volume Forecast (2012E-2020E) .............................. 41
Figure 22: Tesla major developments timeline (2003-2012) ........................................................... 42
Figure 23: ZEV Credits Drove Tesla’s Net Profitability......................................................................... 43
Figure 24: ZEV Credits Drove Tesla’s Net Profitability ........................................................................ 44
Figure 25: Tesla Motor’s Gross Revenue Trend and Sources ............................................................ 46
Figure 26: The ZEV Credits Impact on Tesla’s Gross Margin ............................................................. 47
Figure 27: TSLA Gross Margins vs. Automaker Peers ........................................................................... 48
Figure 28: The ZEV Credits Impact on Tesla’s Gross Margin ............................................................. 48
Figure 29: Tesla’s Stock Value and Weekly Volume over 5 Years.................................................... 48
Figure 30: 2012 California Total GHG emissions distribution map ................................................ 66
Figure 31: An illustration of California’s cap-and-trade scope ......................................................... 67
Figure 32: Proposed Distribution of Cumulative Allowance Value (2012-2020) ..................... 69
Figure 33: An illustration of the cap-and-trade process ...................................................................... 69
Figure 34: 2013 Auctions of vintage allowances .................................................................................... 70

 3
List of Tables

Table 1: California Vehicle Groups Introduction ..................................................................................... 12
Table 2: An outline of ZEV requirements’ adjustments per vehicle model in brief* ................ 12
Table 3: NEV and Trading programs in Selected Pilot Cities ............................................................. 15
Table 4: Challenges facing major ZEV ecosystem players ................................................................... 15
Table 5: Detailed steps of the California ZEV-credits regulation...................................................... 20
Table 6: Company subjection to the ZEV regulation.............................................................................. 22
Table 7: LDT2* calculation into the ZEV base volume determination ........................................... 23
Table 8: Minimum general ZEV requirements per vehicle year model ......................................... 23
Table 9: ZEV credits categories and minimum annual requirement per ZEVs ........................... 23
Table 10: ZEVs type vehicles and ZEVs credits earned per vehicle type ...................................... 24
Table 11: Basic credits calculation method ............................................................................................... 25
Table 12: PZEV credits cap restriction in fulfillment of ZEV credits requirement ................... 26
Table 13: ZEVs and PZEVs transactions for MY 2013 period and Sep 2013 credits balance35
Table 14: Tesla’s 2008-2013 annual ZEV credits n the context of revenues and cost ............ 43
Table 15: Tesla’s vehicles eligibility for ZEV credits ............................................................................. 45
Table 16: 2013 quarterly ZEV credits as part of revenues and profits.......................................... 50
Table 17: CARB ZEV-Credits Key Experts Interviewed ........................................................................ 52
Table 18: CARB ZEV-Credits Key Experts .................................................................................................. 52
Table 19: Natural gas suppliers’ projected proportions of Limited Use Holding Accounts .. 68
Table 20: CARB Cap-and -Trade Key Experts Interviewed................................................................. 71
Table 21: Detailed steps of the California ZEV-credits regulation ................................................... 77
Table 22: Company subjection to the ZEV regulation ........................................................................... 78
Table 23: Company subjection to the ZEV regulation ........................................................................... 78
Table 24: LDT2* calculation into the ZEV base volume determination ........................................ 80
Table 25: Minimum ZEV requirements per vehicle year model ....................................................... 81
Table 26: ZEV credits categories and minimum annual requirement per ZEVs ........................ 81
Table 27: ZEVs type vehicles and ZEVs credits earned per vehicle type ...................................... 82
Table 28: LVMs 2009-2011 model year period: Alternative Path for meeting ZEV
 requirements .................................................................................................................................................. 83
Table 29: LVMs annual percentage obligation for the 2012 through 2017 model years....... 84
Table 30: Zero-Emission VMT Allowance Determination Option A................................................ 85
Table 31: Advanced Componentry Allowance Determination for PZEVs in Use of High
 Pressure Gaseous Fuel or Hydrogen Storage .................................................................................... 85
Table 32: Advanced Componentry Allowance Determination for PZEVs in Use of a
 Qualifying HEV Electric Drive System .................................................................................................. 86
Table 33: Applicable multiplier determination ....................................................................................... 87
Table 34: Basic credits calculation method ............................................................................................... 87
Table 35: PZEV credits cap restriction in fulfillment of ZEV credits requirement ................... 88
Table 36: Special provisions for utilizing NEV credits in meeting ZEV requirements ............ 89
Table 37: Transportation systems credits ................................................................................................. 90
Table 38: Model Years that can be transferred per ZEV type under the travel provisions ... 90
Table 39: Additional 2016 and 2017 Model Year ZEV requirements for LVMs and IVMs..... 91
Table 40: Reduced TZEVs for LVMs and IVMs meeting the Additional Section 177 State
 2016 and 2017 requirement .................................................................................................................... 91
Table 41: Total, floor ZEV and Ceiling TZEV requirements for LVMs and IVMs electing the
 optional path for section 177 state compliance ............................................................................... 92

 4
Executive summary
 The State of California, representing one of the most polluted regions in the US with
over 26 million cars on its roads accounting for about25% of its GHG emissions, is
continuously developing and implementing some of the world’s most innovative programs
for air quality improvement. The underlying targets of this advanced and rich regulatory
framework include: the sales of 1/7 cars (15.4% of projected sales estimated at 1.4M) of none
or nearly-none polluting vehicles and significant increase in vehicles’ fuel economy by 2025;
34% and 75% reduction in new vehicles GHG emissions and smog-forming emissions,
respectively; Environmentally superior cars will be available across the range of vehicle
models (compacts, SUVs, pickups, minivans etc.) for minimizing consumer compromise while
shifting to greener vehicles; Consumer savings on fuel costs will average $6,000 over the life
of the car (from a BAU level) and greater than the average $1,900 increase in vehicle price
(for ultra-clean, high-efficiency technology).

 California’s stringent and complementary programs include zero as well as low-
emission vehicles' development and market commercialization, and low-carbon fuels
development and commercialization. The central goal and advantage of California’s ZEV
approach lays in its integrated methodology for addressing both criteria of pollution (and
GHG emissions) while allowing ZEV credits trading in a pre-defined market place. Through
credits trading, early stage zero and near-zero emission vehicle companies are funded and all
automakers are provided with an added incentive to develop ever-cleaner vehicles and
related technologies. California’s cap-and-trade is also a market-based approach based on
emission caps.

 While California’s early ZEV-credits program was designed to accelerate and diversify
zero-emissions vehicle solutions development and commercialization since 1990, the recent
cap-and-trade program includes fuel supply with the aim of advancing the commercial
development of clean and alternative fuels and to incentivize adequate infrastructure
(started 2013 and extended to include fuels from 2015). Cap-and-trade fuel governance may
influence fuel availability and prices, therefore potentially impacting low-carbon and zero-
emissions vehicle use-phase costs. In turn, this may influence car purchase choices. As the
two programs thus feed into the transport sector both directly and indirectly, their impacts
can be accelerated or offset if management and implementation are not coherent, as
demonstrated in this work (section 2.2).

An illustration of the linkage between the ZEV-credits and Cap-and-Trade

 Reduced GHG, Air Pollution & Health Effects

 Vehicle Vehicle Use Phase Fuel Production, Distribution
 Production & Storage
 Type, Energy Type,
 Volumes use Fuel Type Fuel Consumption volumes Fuel Consumption

 ZEV-credits Cap-and-Trade: Fuel Suppliers

 5
The ZEV credits program has proven to deliver ground-breaking results: no
manufacturer selling vehicles in California breached the regulation in its 17 years of
implementation; nearly 2 million Californians are driving partial zero and advanced
technology partial zero emission vehicles (PZEV and AT PZEV), with near-zero tailpipe
emissions and some 80% cleaner exhausts than the average 2002 model year car. Gas-
electric hybrid vehicles are also a success, accounting for over 400,000 vehicles on
California’s roads. Various vehicles and vehicle technologies were developed in conjunction
by manufacturers with the support of the ZEV-regulation (e.g. “MOA” Vehicles, FreedomCar),
which also arguably triggered the development of several other successful vehicle models
(e.g. Toyota Prius, Honda Insight).Innovative energy vehicle manufacturers new to the
industry were able to survive their initial years arguably by the demand and external profit
enabled by the regulation .This phenomenon has been extensively studied in this work
(section 3) through the story of Tesla Motors, which achieved revenues of about $245M over
5.5 years thus enabling it to reach market maturity in an overwhelmingly resources-
consuming new energy vehicle industry that had previously diminished PEV players
elsewhere.

 These outcomes, however, may be the result of California’s unique characteristics
(such as its role as an innovation hub, its comprehensive regulatory framework, the amount
of early-adopters is houses etc.). In order to assess the program’s suitability for the case of
China, local market conditions and the robustness of its institutional framework should be
examined. Furthermore, experts point out that a multi-stakeholders collaboration, led by
dedicated pilot city planners, is needed to enable in-depth understanding of both the forces
that may lead to the success of a China-tailored program as well as to assist in designing such
a program (section 3.3). One clear shortfall of the ZEV-credits program's scope lays in its
neglect of low-emissions infrastructure, fuels and components players: while auto
manufacturers can enjoy the fruit of the program during their seed period, other
complementary players that have a significant influence on market demand and uptake are
excluded from this scheme. Another issue with the current California-grown ZEV credit
scheme is the inability of a participating seed-company to expand geographically and
internalize its market potential at every technological step. As evidenced in the case of Tesla,
selling its first model the Roadster abroad has resulted in a slowdown of revenue.

 6
An illustration of the ZEV credits program

Program participation: ZEV Base Volume ZEV Requirement
Size Determination Determination: Prior Determination:
(SVM, ISVM, IVM, LVM) Years/Same Year Basic + specific

 “Bank” Sell Purchase credits from Pay high
 (with restrictions) (according to provisions) other players penalties

 Excess of credits Shortage of credits

 Receive credits
 Divided by ZEVs and Achieve the min requirement per each
 the various PZEVs vehicle Type: Produce
 ZEVs (several optional Types) ZEVs and
 PZEVs (3 major groups) PZEVs

 As the worlds' larger GHG emitter, and home to 16 of world's 20 most air-polluted
 cities, China is aggressively promoting its New Energy Vehicle (NEV) demonstration project
 aimed at showcasing and assessing a variety of climate mitigation measurements. In
 particular, its "10 cities 1000 vehicles" program from 2008 for accelerating the development
 of new PEV technologies was quickly followed by the gradual formation of 25 pilot cities
 meant to exemplify commercially scalable PEV projects under governmental support. These
 schemes have not only prepared the participating cities for NEV incorporation in city
 planning, but have also set the direction for further energy savings and the development of
 new energy vehicles' institutional framework. This work suggests that the city or cities given
 the task of assessing and designing a ZEV credit type program and related trading
 mechanisms (e.g. cap-and-trade) should be selected carefully to ensure market readiness,
 institutional feasibility, government proactive collaboration, and potential linkages to
 broader areas and sectors.

 China has recently committed itself to ambitious air pollution and energy targets, and
 has already started incentivizing the commercial development of New Energy Vehicles
 (NEVs) and related infrastructure. In 2012, China announced a challenging target of the sale

 7
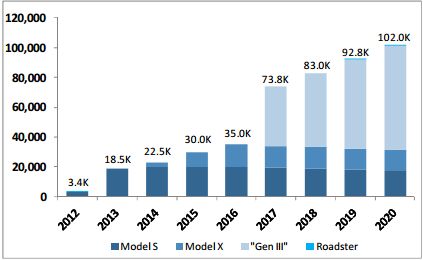
of 5 million NEVs by 20201. However, in 2013, NEV sales reached only 20 thousand vehicles2,
and in the first 8 months of 2014 sales only reached 22.8k. Recognizing some of the barriers
for NEV demand, China exempted NEVs from import and purchase tax as of September 20143,
incentivizing purchases of well-recognized global brands by potential early-adopters. This
step is projected to not only assist in triggering demand for NEVs and potentially serving
local brands down the road, but also in motivating infrastructure development as
demonstrated new agreements between importers and strong local players aimed at
advancing the development and deployment of EV infrastructure. The Tesla and China
Unicom partnership announced early August 20144 is an example of one of these agreements.
Tackling yet another commercialization barrier, the MIIT abolished the protectionist local
NEV approval lists5 paving the way for the national market growth of local brands, which
until recently couldn’t secure purchase benefits to potential clients in areas beyond their
production geographies.

 However, local experiences show that more aggressive, comprehensive, and
innovative approaches are in need for decoupling socio-economic development from private
mobility usage and creating a commercial clean vehicle supply with adequate supportive
networks of operation. Not only should the high-profile automakers, electricity utilities, and
fuel providers be included in the design and implementation of new-energy-vehicle
programs, but new players providing hardware and software solutions for the rapidly
evolving connected car market should be included as well.

An illustration of the cap-and-trade process

 Supplier Covered Entity

 Emission Report Received Data

 Customers List

 Delivers Data

 ARB

 Supplier’s reported ARB’s calculated emissions from Compliance
 emissions deliveries to covered entities Obligation

 In recognition of the importance that market-based mechanisms play in the transition
to a low-emission economy, the national government has recently stated its wish to create
market-based mechanism for accelerating vehicle standards’ compliance and advancing

1 http://www.gov.cn/zwgk/2012-07/09/content_2179032.htm
2 http://chinaafc.miit.gov.cn/n2257/n2260/c95046/content.html
3 http://www.gov.cn/guowuyuan/2014-07/09/content_2714830.htm
4 http://www.reuters.com/article/2014/08/29/us-tesla-motors-china-unicom-hk-idUSKBN0GT0I320140829
5 http://www.miit.gov.cn/n11293472/n11505629/n11506277/n11984220/n11984250/index.html
 8
home-grown high-end technologies integration 6 . Chinese mega cities such as Shenzhen,
Shanghai, and Beijing have launched carbon emissions trading systems over the past couple
of years. These systems, currently in their pilot stages, are projected to further test the
grounds for innovative market approaches and multidisciplinary participation aimed at
increasing carbon efficiency and improving air quality (e.g. cap-and-trade). The city of
Shenzhen, for example, is currently developing a consumer-based mechanism for tracking
energy efficiency and carbon reduction, as well as mobile sources emissions capping and
trading which could be thereafter linked to its pilot China Shenzhen Emissions Rights
Exchange (CERX). A potential gap between national and local efforts is the centralization of
standards, disabling local governments from creating a market-based program for
accelerating truly innovative and advanced technology commercialization.

 This study only infers potential barriers outlined by California experts rather than
key players from China. Through key stakeholders’ engagement, key barriers for
implementing a ZEV credits type program in a pilot city (or cities) in China and measures
recommended to overcome them may be identified. A recommended next step is a
stakeholder workshop and roundtable discussion for suggesting areas to be further explored
and issues of importance when considering ZEV-type design for China.

6For example, Article 21 in MIIT’s announcement from July 21 2014:
http://zbs.miit.gov.cn/n11293472/n11295142/n11299183/16074587.html

 9
1. Background
 Accounting for over 25% of GHG emissions and about 50% of city center air pollution,
China’s petroleum-based transportation system is growing at an unprecedented rate and
driving the global production and sales of automobiles. The rapid increase in China’s vehicle
fuel consumption is in stark contrast to the global goal of reducing petroleum consumption
by 50%-80% by mid-century. Meanwhile, air quality in China’s major cities continues to
deteriorate at alarming rates, posing major health risks and triggering social unrest.

 China has recently committed itself to ambitious air pollution and energy targets, and
has already started incentivizing the commercial development of New Energy Vehicles
(NEVs) and related infrastructure, aiming at 5 million NEVs deployment by 2020 7 and an
incorporation of trading mechanism in vehicle mandates8. It is clear that more aggressive,
comprehensive, and innovative approaches are needed. For example, instead of solely
incentivizing consumption through end-user subsidies, it is necessary that we also address
the inventive structure that drives manufacturing in order to create diverse and attractive
commuting alternatives. Through such an inclusive approach, socio-economic development
could be decoupled from private mobility usage. Furthermore, multi-stakeholder
engagement that is guided by the government but managed through market mechanisms is
deeply needed to slow and eventually reverse the trend of worsening air pollution.

 In recognition of the importance that market-based mechanisms play in the transition
to a low-emission economy, Chinese mega cities such as Shenzhen, Shanghai, and Beijing have
launched carbon emissions trading systems over the last couple of years. These systems,
currently in their pilot stages, are projected to further test the grounds for innovative market
approaches and multidisciplinary participation aimed at increasing carbon efficiency and
improving air quality. The city of Shenzhen, for example, is currently developing a consumer-
based mechanism for tracking energy efficiency and carbon reduction, as well as mobile
sources emissions capping and trading, which could be thereafter linked to its pilot China
Shenzhen Emissions Rights Exchange (CERX).

 This project is aimed at evaluating recent innovative schemes for incentivizing
sustainable vehicle and fuel production and financing clean transportation technology
development through the industry players themselves. The first, the California Zero
Emissions Vehicles (ZEV) credit scheme, is unique program that evolved over a twenty year
period and was able to drive local low-emissions vehicle innovations through a mandate
combined with market-based implementation mechanism. The second is a recent Cap-and-
Trade scheme aimed at incentivizing energy and fuel supply through market forces. The two
programs, although not officially linked, are both serving similar air-quality improvement
and fuel and GHG emissions reduction targets under the state’s scoping plan for better air
quality and later on - reduced GHG emissions. After outlining these programs’ development
and evaluating their success, this report will highlight the potential and impediments for
similar programs design for implementation in Chinese cities.

7
 http://www.gov.cn/zwgk/2012-07/09/content_2179032.htm
8
 http://zbs.miit.gov.cn/n11293472/n11295142/n11299183/16074587.html

 10
2. Introduction to California’s Major Market-Oriented Low- Carbon Development Programs: ZEV and cap-and-trade This section is aimed at outlining two of California’s transport related programs covering cleaner vehicles and fuel commercialization using market-based mechanism: the ZEV-credits program, designed to promote the development and commercialization of new energy vehicles; and the cap-and-trade scheme, designed to (among other sectors) promote the production and distribution of cleaner fuels (including electricity). First, this section will lay out major drivers for the design and implementation of the California Air Resource Board regulations, then provide an introduction into the concept of clean transport in the context of California’s regulatory framework followed by a high-level overview of targets, tools and challenges faced by China in benefitting from California’s experiences. 2.1 California’s role: CARB’s major goals and tools The State of California, representing one of the most polluted regions in the US with over 26 million cars on its roads accounting for nearly 25% of its GHG emissions, is continuously developing and implementing some of the world’s most innovative programs for improving the state’s air quality9. These stringent and complementary programs include zero and low-emission vehicle development and market commercialization, as well as low- carbon fuel development and commercialization. California’s leading regulatory role started in 1967 with the Air Quality Act, giving the state a waiver to set its own emissions standards from mobile sources. With the target of advancing sales of 1/7 cars (15.4% of projected sales estimated at 1.4M) of non or nearly-nonpolluting vehicles10and achieving a significant increase in vehicle fuel economy by 202511, California is aiming to achieve the following goals: New vehicles will emit 34% fewer GHGs and 75% fewer smog-forming emissions, therefore addressing both global and local challenges. Environmentally superior cars will be available across the range of models (compacts, SUVs, pickups, minivans etc.), thus avoiding consumer compromise while shifting to greener vehicles. Consumer savings on fuel costs will average $6,000 over the life of the car. The savings are projected to be greater than the average $1,900 increase in vehicle price for ultra-clean, high-efficiency technology (however this contention excludes electric fuel cell vehicles of higher costs at this stage and probably also through 2025). Market conditions which independently promote the adoption of cleaner private transportation would hence be put in place allowing for mass adoption beyond the limited early-adoption. 9 Source: CARB ZEV tutorial. 10PHEV, EV and Hydrogen Fuel-cell vehicles. 11 Large volume manufacturers selling at least 20k vehicles in California, would have to introduce Zero Emissions Vehicles that would account for at least 15.4% of their fleets. 11
Since the 1990s, CARB continues to refine its definition of vehicles by their relative
volume of emissions, making sure technological progress is constantly being incentivized
towards an end-goal of zero-emissions vehicles. The current general definitions are as
follows:

Table 1: California Vehicle Groups Introduction
 Vehicle group acronym Definition
 LEV(Low Emission Vehicle) The least stringent emission standard for all new cars sold in
 California beyond 2004.
 ULEV(Ultra Low Emission 50% cleaner than the average new 2003 model vehicle.
 Vehicle)
 SULEV(Super Ultra Low These vehicles emit substantially lower levels of hydrocarbons,
 Emission Vehicle) carbon monoxide, oxides of nitrogen and particulate matter than
 conventional vehicles. They are 90% cleaner than the average
 new 2003 model vehicle.
 PZEV (Partial Zero Meets SULEV tailpipe standards, has a 15-year / 150,000 mile
 Emission Vehicle) warranty, and zero evaporative emissions. These vehicles are
 80% cleaner than the average 2002 model car.
 AT PZEV (Advanced These are advanced technology vehicles that meet PZEV
 Technology PZEV) standards and include ZEV enabling technology. They are 80%
 cleaner than the average 2002 model car.
 ZEV (Zero Emission Zero tailpipe emissions, and 98% cleaner than the average new
 Vehicle) 2003 model vehicle.
 TZEV (Transitional Zero Transitional zero emission vehicles (TZEVs) are vehicles with
 Emissions Vehicles) ultra-low tailpipe emissions and are propelled by a zero
 emission fuel such as electricity or hydrogen. e,g. PHEV, HICE.
 The name was changed during the 2012 ZEV amendments from
 Enhanced AT PZEVs to TZEVs for simplicity.

 In January 2012, California has adopted a new Advanced Clean Cars program for
further refining the path for its above stated goals, which is composed of four separate yet
related and somewhat inter-dependent mandate-based programs: GHG standards for cars
and light trucks; Clean Fuels Outlet; Reducing Smog-Forming Emissions; and Zero Emissions
Vehicle (ZEV) Regulation. The latter two are uniquely Californian, and the ZEV regulation has
been successfully adopted by 8otherUS states12, collectively representing about 25% of the
US vehicle market13.

Table 2: An outline of ZEV requirements’ adjustments per vehicle model in brief*
 Model year 1998 2001 2003 2009 2012 2015 2018
 fleet portion 2% 5% 10% 11% 12% 14% 16%
 requirement
* This table is a simplification of a dynamic and complex requirements measurement method and is meant for
providing an illustration only (in-depth introduction of the latest two versions of the regulation, before and after
model year 2018, are available in Appendix I).

12Connecticut, Maine, Maryland, Massachusetts, New-Jersey, New-York, Oregon, Rohde Islands and Vermont.
Arizona and New-Mexico have initially joined the California ZEV program but later pulled back from that
decision.
13http://www.mass.gov/eea/agencies/massdep/news/releases/governors-initiative-to-put-3-3-m-zevs-on-

road-by-2025.html
 12
Moreover, the ZEV strategy has been appropriately taking market factors and
economic impacts under consideration since 1990. Its results have been evidenced in recent
years by the number of clean vehicles conceived and the financial stabilization of innovative
clean technology companies. The ZEV program will therefore be at the focus of this work, and
the case of Tesla Motors will be examined to exemplify the program’s advantages and
robustness. California’s new Cap-and-Trade program, which will soon include entities from
fuel supply chains, is contributing to a broader inclusion of transportation ecosystem
emissions under the regulatory framework. Although with little experience to date, this cap-
and-trade approach offers a useful angle into transportation emissions and pollutants
governance.

2.2 CARB’s ZEV-credits and cap-and-trade programs: a coherent
framework?

 While California’s early ZEV-credits program is designed to accelerate vehicle
solutions development through sales-based mandate and incentivize the commercialization
of zero emissions vehicles through both the mandate and a complementary credits market,
the recent cap-and-trade program includes fuel supply with the aim of advancing the
commercial development of cleaner and alternative fuels and incentivizing adequate
infrastructure. Cap-and-trade fuel governance may influence fuel prices, thus impacting low-
carbon and zero-emissions vehicle use-phase costs potentially influencing car purchase
choices.

Figure 1: An illustration of the linkage between the ZEV-credits and Cap-and-Trade

 Reduced GHG, Air Pollution & Health Effects

 Vehicle Vehicle Use Phase Fuel Production, Distribution
 Production & Storage
 Type, Energy Type,
 Volumes use Fuel Type Fuel Consumption volumes Fuel Consumption

 ZEV-credits Cap-and-Trade: Fuel Suppliers

 As the two programs feed into the transport sector both directly and indirectly, their
impacts can be accelerated or offset if management and implementation are not coherent.
The below figure is meant to highlight the major GHG impacts of these two separate yet linked
schemes through the case of selected vehicle models: gasoline, diesel, CNG and electricity, for
the case of China.

 13
Figure 2: Vehicle types emissions sources, by use-phase

 300

 250
 GHG Emission per year
 (T CO2 Equivalent)

 200

 150

 100

 50

 0
 Gasoline Diesel CNG Electricty

 Upstream emissions Vehicle use-phase emissions

Assumptions: Based on Beijing Transport Annual Report (2013) vehicle’s average annual travel distance is
12,391 km; Based on iCET’s China Passenger Vehicle Fuel Consumption Development Annual Report (2013)
China’s average fuel consumption is 7.33L/100km; Vehicle use-phase emissions averages are based on ACEEE`s
Green Book Methodology (2011); Upstream emissions are based on the Proposed Updates to ACEEE`s Greener
cars Rating System for Model Year 2014.

 As demonstrated in the above figure, both the ZEV-credits and cap-and-trade
programs are instrumental for advancing a coherent low-emissions transport development
platform– the first through elimination of use-phase emissions and the later through the
creation of complimentary infrastructure for cleaner vehicles and an appropriate reduction
of upstream emissions. The first includes a GHG standards-based mandate and
complementary credits trading mechanism, while the latter is a more straightforward trading
platform.

2.3 Chinese Cities: Goals, Tools, and Implementation Gaps

 The central government has been promoting low-carbon and zero emissions
transport development since 2009. Key programs for guiding and incentivizing such
development include public transportation and private vehicle. Although these schemes have
successfully developed the concept of low and zero emission vehicles and created various
pilot projects, in-house solutions development and market commercialization has been
limited. Several barriers hamper medium and long-term market commitment, however all
face a similar underlying challenge: lack of independent business-case.

 Major city-level projects aimed at assessing low and zero-emissions vehicle solutions,
development paths, and governances, include new energy vehicle (NEV) development and
emissions trading schemes. Although such programs are typically independent and governed
by different local-government entities, the limited market engagement to date has led to
recent studies for evaluating the issues of implementation and examining the opportunities
in linking between these various methods.

 14
Table 3: NEV and Trading programs in Selected Pilot Cities
 NEV Pilot14 Emission trading pilot
 Beijing Since 2009, focused on Since 2008,established Beijing
 taxi and buses Environment Exchange15
 programs
 Tianjin Since 2010,focused on Since 2008,established Tianjin Climate
 buses program Exchange16
 Shanghai Since 2009,focused on Since2011,established Shanghai
 buses program Environment Energy Exchange17
 Shenzhen Since 2009, focused on Since 2010,established Shenzhen
 taxis and buses Emission Exchange18
 programs
 Guangzhou Since 2010,focused on Since 2012,established Guangzhou
 buses program Emission Exchange 19
 Xiamen Since 2010,focused on Since 2011,established pollution and
 buses program carbon allowance trade center20
 Hefei Since 2009,focused on a
 private car21

 Players from different sectors comprising a coherent zero-emissions vehicle
 ecosystem, including electricity providers, infrastructure operators and new power-train
 developers, all seem to be waiting for the “winning” new energy vehicle technology to reach
 economies of scale and create enough demand that will justify solutions development and
 integration. Once the risky and capital-intense investment shows a positive return on
 investment (ROI) in the foreseeable future, players would be able to commit themselves to
 the national task of shifting to clean mobility.

 Table 4: Challenges facing major ZEV ecosystem players
 ZEV ecosystem Solutions/ innovation Commercialization
 angel Impediments
State Grid22 Electricity Advanced bus battery switch Lacks the business-
 suppliers solutions; preliminary e-Taxi battery case for commercial
 switch solutions; charging solutions solutions development
 development and operation
China e-Taxi charging network development
Southern

 14http://www.gov.cn/zwgk/2009-

 02/05/content_1222338.htmhttp://www.gxdrc.gov.cn/zt/gglm_zt_jnjp/jnjp_wjgg/201006/t20100613_193693
 .htm
 15http://www.cbeex.com.cn/
 16http://www.chinatcx.com.cn/tcxweb/
 17http://www.cneeex.com/
 18http://www.cerx.cn/Portal/home.seam
 19http://www.cnemission.com
 20http://www.xemas.com.cn/ 15
 21http://www.ahkjt.gov.cn/technologi/dynamic/mtjj/webinfo/2014/07/1402451705152988.htm
 22http://www.sgcc.com.cn/
Grid23
Wangxiang24 Battery Acquisition of solutions (e.g. A123, Regulatory limitations
 manufacturers Fischer25) for vehicle powertrain and reputation issues
 components. preventing from
 entering the global
 market
CALB26 EV Batteries High costs for low
PRIDE27 Batteries and complete electric energy density
BYD28 powertrains solutions and limited
GUOXUAN29 Battery monitor demand to compensate
 for such costs
Potevio30 Electric car Providing operational services
 software
 providers
SHANGHAI Electric power- Reliance on imported
EDRIVE31 train high-end products

 The design of a regulatory framework that encounters for the challenges these
 various industry-players are facing is instrumental for enabling market-oriented innovation,
 development, deployment and operation of all aspects of new energy mobility. Without such
 coherent and bottom-up considerations, new energy vehicle governance would continue to
 make slow achievements with limited applicability in the market-place and little potential for
 groundbreaking commercialization.

 2.4 Conclusions

 The ZEV and cap-and-trade programs, although not linked, are together creating
 more inclusive governance aimed at cleaner transportation development: while one is
 encouraging innovative vehicle technologies commercialization, the other is advancing more
 sustainable fuels production and market introduction; while one is looking at driving cycle
 emissions, the other is going beyond use-phase perspective and utilizes a well-to-wheel
 approach.

 This section introduced California’s underlying goals and two main approaches for
 achieving its goals: the ZEV-credits program and the new cap-and-trade program. Section 3
 and 4 will provide richer background on each as well as experts’ views, and in section 5 main
 conclusions will be presented.

 23http://www.csg.cn/
 24http://www.wanxiang.com.cn/product/index.asp
 25 According to a new regulation, Wangxiang is not considered vehicle manufacturer unless it purchased or
 registered as a domestic auto company.
 26http://en.calb.cn/
 27http://www.pride-power.com/
 28http://bydit.com/doce/index.html
 29http://www.hfgxgk.com/
 30http://www.potevio.com/
 16
 31http://www.chinaedrive.com/english/index2.asp
3. The ZEV-Credits Program
 The Zero Emission Vehicle (ZEV) regulation was first adopted in 1990 as part of the
Low Emission Vehicle Program set by the California Air Resources Board (CARB). Its original
goal was to reduce smog-forming emissions. More recently, it has also become a leading
strategy to help achieve an 80% reduction in GHG emissions from 1990 levels by 2050. At
the core of this regulation is the utilization of industry players’ resources. The program is
designed to rapidly increase ZEV production to early commercial volumes, establishing a
sustainable and growing market for these advanced technology vehicles (mainly plug-in and
hydrogen fuel cell cars).

 The ZEV regulation is a credit scheme based on manufacturers’ mandatory
requirements for a portion of vehicles sold in a state during each model year to be zero
emission vehicles. It provides that a manufacturer earns credits, referred to as ZEV credits,
for each zero emissions vehicle it manufacturers. A manufacturer with a surplus of credits
may sell its excess credits to other manufacturers who can then apply those credits in order
to comply with the regulatory requirements, including making up for deficits and banking
credits for future use as long as the regulatory provisions permit.

 This section will review the ZEV-credits history and regulation (section 3.1), assess
its success through meta-analysis and the case of Tesla-Motors (section 3.2), and suggest in-
depth understating of its design mechanism and effectiveness through qualitative analysis
(section 3.3).

3.1 ZEV-Credits program introduction

3.1.1 ZEV-credits program history

 Zero-emissions vehicles regained momentum following the 1970’s oil crisis, yet failed
to break the domination of oil and auto companies in the vehicle market. However, the
California Air Resource Board (CARB), faced with severe air quality issues, developed its
initial ZEV requirement within its broader first Low Emissions Vehicle (LEV I) regulation. In
1990, the Board adopted the Low Emission Vehicle (LEV) fleet average standard to
dramatically reduce the environmental impact of light-duty vehicles through more stringent
emission limits on conventional cars and the gradual introduction of zero emission vehicles
(ZEV) into the California fleet. A requirement that at least 10% of the fleet be ZEVs was
adopted based on commercializing ZEVs and creating the opportunity for even greater
emission reductions in the future.

 The first inclusion of ZEV-credits, in the first Low Emission Vehicle (LEV) regulation,
which was enforced from 1994 through 2003, was as a footnote: “While meeting the fleet
average standards, each manufacturer’s sales fleet shall be composed of at least 2% ZEVs in
the model years 1998 through 2000, 5% ZEVs in 2001 and2002, and 10% ZEVs in 2003 and
subsequent.” Since its original adoption, the ZEV regulation has been adjusted six times - in
1996, 1998, 2001, 2003, 2008, and 2012, to reflect the pace of ZEV development and the
emergence of new ZEV and ZEV-like technologies.

 17
The rationale behind this new requirement, was that (i) the projected improvements
in conventional vehicle technology was not and will not be sufficient to meet air quality
standards, and that(ii) ZEVs can avoid internal combustion engine vehicle emissions
performance deterioration with age. These underlying assumptions are in line with experts’
comprehensive technology studies. Such research also led to the state’s 1994 announced
"road map" for attaining clean air standards, the State Implementation Plan (SIP).

 In 1996, the ZEV regulation was revised, retaining the 10% requirement by 2003 but
eliminating early requirements. CARB further established agreements with large auto makers
to place a technology demonstration fleet (“MOA” Vehicles), which was considered successful
in operation, yet exposed electric vehicle marketability challenges such as sufficient battery
availability.

 In 1998, the LEV II was introduced, aimed at replacing LEV I from 2004 through 2010,
requiring lower emission standards for all vehicle categories and announcing new Super
Ultra Low Emissions Vehicle (SULEV) emission standards and near (and zero) evaporative
requirements. The ZEV was moved to its own section (section 1962), detailing partial ZEV
(PZEV) credits for qualifying technologies, and stating PZEVs substitution up to 6% for large
volume manufacturers (LVM). PZEVs were defined as SULEVs with stringent exhaust
emissions 32 and evaporation 33 requirements, which have a 15-year or 150,000-mile
warranty, and have specific on-board specifications.

 In 2001, the ZEV regulations underwent amendments, yet maintained a technology
forcing mandate: it phased in ZEV and PZEV requirements; allowed further offset with
Advanced Technology PZEVs (AT PZEVs), recognizing them as technologies that would lead
to ZEVs; segregated low speed Neighborhood Electric Vehicles (NEVs) and assigned them
fractional ZEV credit; and gradually increased future ZEV requirements.

 Interestingly, CARB was facing litigation, including federal and state law-suit 34
complaints that challenged the legality CARB’s 2001 amendments on the ground that the
amended regulations violate the Supremacy Clause of the United States Constitution. The
litigation concluded that the credits are linked to efficiency, and the preliminary injunction
issued on June 2002 prohibited CARB from enforcing the regulation in both 2003 and2004
model years. CARB modified the regulation in 2003, and a settlement agreement for all cases
was signed in August of the same year.

 In 2003, following the litigation, CARB made further amendments that entered force
in 2005: the calculation method for AT PZEVs was changed; flexibility was inserted by
offering two paths (banking credits via the base path and new placement of ZEVs through the
alternative path); group demonstrations were enabled through phases (Phase I: 2005-08,
Phase II: 2009-11, Phase III: 2012-14, Phase IV: 2015-17); and the requirement was divided
from a general 10% to more detailed a maximum of 6% for PZEVs, with the remaining 4%

32 SULEV exhaust emissions requirements included: dual wall exhaust manifolds, close coupled catalyst plus
downstream catalyst with integral adsorbers, linear O2sensor, retarded timing at cold start, electric air injection,
and greater catalyst loading.
33Evaporation requirements included: Additional trap on canister vent, carbon vent on engine inlet, improved

seals at joints/junctions, consolidation of parts to minimize junctions, better materials.
34Including: CENTRAL VALLEY CHRYSLER-PLYMOUTH, INC., DAIMLERCHRYSLER CORP., FRONTIER DODGE,

INC., GENERAL MOTORS CORP., HALLOWELL CHEVROLET COMPANY, INC., KELLER MOTORS, INC., KITAHARA 18
PONTIAC-GMC-BUICK, INC., SURROZ MOTORS, INC., AND TOM FIELDS MOTORS, INC.
equally divided between AT PZEVs and ZEVs.

 In 2006 and 2008, expert panels were held, highlighting the potential of electric
vehicle commercialization with a short-medium term focus on plug-in hybrids. The panels
increased transparency and have sparked revisions in the ZEV definitions for better fitting
the regulation with industrial capacities and development. Additional conforming changes
were adopted in October 2013, and further revisions for meeting requests for flexibility by
Intermediate Volume Manufacturers (IVMs) are underway35.

 The most bold revisions were made in 2012, expressing the increase in stringency by
recognizing that hybrid have reach market maturity and thus should no longer be stimulated
through the ZEV credits program. In conjunction with the GHG2 standard, adopted in January
that year, the ZEV requirements were raised to 15.4% of sales by 2025 and the concept of
Transitional ZEVs replaced the previously known Enhanced Advanced PZEV, highlighting the
value of zero-emissions tail-pipe and electricity/hydrogen fuel. The below figures illustrated
the gradual increase in minimum ZEV floor which is the heart of the ZEV credits program
mandate.

Figure 3: California ZEV program – minimum ZEV floor throughout the years

 18.0% 18.00%
 Total ZEV Requirements (% Slaes)
 16.0% 16.00%
 14.0%
 ZEV Share of Car Sales

 14.00%
 12.0% 12.00%
 10.0% 10.00%
 8.0% 8.00%
 6.0% 6.00%
 4.0% 4.00%
 2.0% 2.00%
 0.0%
 0.00%
 2012201420162018202020222024
 2012-2014 2015-2017 2018-2020

 ZEVs Enhanced AT PZEVs AT PZEVs PZEVS

Note: Enhanced AT PZEVs were replaced with TZEVs from 2012.

Source: Enerknol Research Policy Brief, July 2014; Adapted from NRDC, 2010.

35 http://www.arb.ca.gov/msprog/zevprog/2014zevreg/zev_workshop_pres_july2014.pdf

 19
You can also read