Estimation of Dietary Capsaicinoid Exposure in Korea and Assessment of Its Health Effects - MDPI
←
→
Page content transcription
If your browser does not render page correctly, please read the page content below
nutrients
Article
Estimation of Dietary Capsaicinoid Exposure in Korea and
Assessment of Its Health Effects
Youngjoo Kwon

                                          Department of Food Science and Engineering, Ewha Womans University, Seoul 03760, Korea;
                                          Youngjoo.Kwon@ewha.ac.kr; Tel.: +82-2-3277-3103; Fax: +82-2-3277-4213

                                          Abstract: The consumption of capsaicinoids, the active components in chili peppers, has been
                                          associated with both positive and negative health effects, and the level of capsaicinoid exposure
                                          may be an important determinant. Dietary capsaicinoid exposure was estimated using a previously
                                          developed database for capsaicinoid content and a 24-h dietary recall dataset obtained from the Korea
                                          National Health and Nutrition Examination Survey. The estimated consumption level was evaluated
                                          to determine its potential effects on weight reduction and gastrointestinal distress. The estimated
                                          daily mean capsaicinoid intake was 3.25 mg (2.17 mg capsaicin), and most Koreans consumed
                                          1–30 mg of capsaicinoids (0.67–20 mg capsaicin) in a day. No adverse effect of capsaicin consumption
                                          was reported other than abdominal pain. For long-term repeated consumption, 30 mg may be the
                                          maximum tolerable dose. However, the effects on body weight or energy balance were inconsistent
                                          in 4–12 week clinical studies conducted with various capsaicin doses (2–135 mg), which was likely
                                          due to the complex interplay between capsaicin dose, study length, and participant characteristics.
                                          Therefore, the capsaicin consumption of most Koreans was below the levels that may cause adverse
                                          effects. However, more long-term studies for the dose range of 2–20 mg are required to further
                                characterize capsaicin’s health benefits in Koreans.


Citation: Kwon, Y. Estimation of
                                          Keywords: capsaicin; capsaicinoids; chili peppers; consumption; dietary exposure; health effect;
Dietary Capsaicinoid Exposure in
                                          body weight; gastric distress
Korea and Assessment of Its Health
Effects. Nutrients 2021, 13, 2461.
https://doi.org/10.3390/nu13072461

Academic Editor:
                                          1. Introduction
Sara Ramos-Romero                               Chili peppers (Capsicum annuum L.) are among the most popular spices worldwide.
                                          The spiciness of chili peppers stems from capsaicinoids, and the capsaicinoid content in
Received: 7 June 2021                     chili peppers is directly related to its pungency [1]. The major capsaicinoids are capsaicin (8-
Accepted: 16 July 2021                    methyl-N-vanillyl-6-nonenamide) and dihydrocapsaicin (8-methyl-N-vanillylnonanamide),
Published: 19 July 2021                   which account for approximately 90% of all capsaicinoids [2].
                                                In addition to their dietary intake, chili peppers have been applied topically to effec-
Publisher’s Note: MDPI stays neutral      tively manage pain. Capsaicin stimulates transient receptor potential vanilloid 1 (TRPV1),
with regard to jurisdictional claims in   a nonselective cation that is activated by a wide variety of physical and chemical stimuli [3].
published maps and institutional affil-   In contrast, exposure to high or repeated doses of capsaicin inhibits TRPV1, causing desen-
iations.
                                          sitization to its stimulants [4,5]. TRPV1 is expressed in a wide range of tissues, including
                                          skin, airways, and the gastrointestinal tract, as well as in different cell types such as urinary
                                          epithelial cells, pancreatic cells, and immune cells, thus highlighting the various biological
                                          roles of TRPV1 stimulants [6].
Copyright: © 2021 by the author.                Chili pepper consumption has been suggested to provide various health benefits, in-
Licensee MDPI, Basel, Switzerland.        cluding cancer-preventive, anti-inflammatory, and anti-obesity effects via TRPV1-dependent
This article is an open access article    and TRPV1-independent mechanisms [6–9]. Clinical studies on these beneficial effects
distributed under the terms and           of chili pepper have mostly focused on the effects of its consumption on energy bal-
conditions of the Creative Commons        ance [10–13]. These studies have suggested that capsaicin intake may reduce obesity by de-
Attribution (CC BY) license (https://
                                          creasing food intake, increasing energy expenditure, and/or increasing lipid oxidation [12].
creativecommons.org/licenses/by/
                                          Dihydrocapsaicin, another major capsaicinoid in chili peppers, has been also shown to
4.0/).

Nutrients 2021, 13, 2461. https://doi.org/10.3390/nu13072461                                            https://www.mdpi.com/journal/nutrients
Nutrients 2021, 13, 2461 2 of 16
activate TRPV1 [14] and to have similar pharmacological effects as capsaicin [15,16]. How-
ever, most clinical studies have focused on capsaicin as an active compound of chili pepper
and have documented its effects alone rather than in combination with other capsaicinoids
such as dihydrocapsaicin.
TRPV1 is thought to be involved in both the control of food intake and energy expendi-
ture [17]. TRPV1 can alter appetite and food intake by modulating appetite hormone levels
or gastrointestinal vagal afferent signaling, which are important for determining meal size
and duration [8,17]. Dietary capsaicin has been reported to increase thermogenesis via
the stimulation of TRPV1 activation-mediated postprandial sympathetic nervous system
(SNS) activity and increased catecholamine secretion in both humans and animals [18,19].
In response to TRPV1 excitation in afferent nerves (sensory neurons) upon exposure to cap-
saicin, efferent nerves (motor neurons) are excited to increase the secretion of catecholamine
(e.g., epinephrine, norepinephrine, and dopamine) from the adrenal medulla [20]. Cate-
cholamines secreted into the blood react with β-adrenergic receptors in peripheral organs,
which enhance energy metabolism and consequently increase thermogenesis [21].
Nevertheless, capsaicin is also an irritant that can induce a burning sensation upon
contact with any mucosa. Considering its irritant activity, there have been some concerns
regarding the toxicity of capsaicin. Capsaicin can induce gastric distress such as acid
reflux, and excessive chili consumption has been thought to be linked to gastric ulcers [22].
Consistent with this notion, a capsaicin-induced increase in satiety was attributed to
gastrointestinal stress (high pain scores, burning sensation, nausea, and bloating) rather
than modulation of the plasma concentrations of satiety-related hormones (e.g., glucagon-
like peptide-1 and peptide YY) [23]. Moreover, a case-control study in Mexico City reported
a significant increase in gastric cancer risk as the self-rated level of chili pepper consumption
increased [24]. The cancer-promoting effect of capsaicin has also been reported in preclinical
models of two-stage chemically induced skin cancer [25]. However, capsaicin is thought to
inhibit rather than stimulate acid secretion by stimulating afferent neurons in the stomach
and inhibiting the growth of Helicobacter pylori (H. pylori) [22]. A meta-analysis also
indicated that dietary capsaicin can promote or prevent cancer depending on the dose [26].
Therefore, the beneficial effects or toxicity of capsaicin may depend on its consumption
level.
Capsaicin intake has been estimated based on the overall consumption of major chili
products (i.e., yields and export volumes) or the frequency of chili-pepper-containing prod-
uct intake [27]. However, the association between capsaicin consumption and its health
effects would be facilitated by more accurate estimations of capsaicin consumption [27].
Therefore, this study sought to estimate the dietary capsaicinoid (or capsaicin) exposure
level in the Korean population and assess whether these consumption levels are linked to
weight reduction and gastrointestinal distress. This study used the Capsaicinoid Content
for Foods Commonly Consumed in Korea (CAPKO) database and the 24 h-dietary recall
datasets obtained from the Korea National Health and Nutrition Examination Survey (KN-
HANES) to estimate the capsaicinoid consumption level in Korea. The CAPKO database
includes data on the capsaicinoid content of various food products including chili peppers,
red pepper powder, hot sauce, kimchi, red pepper paste, salted fish, instant noodles, and
instant foods other than instant noodles. Additionally, the capsaicinoid level in red pepper
powder, a major condiment of spicy food and a primary source of capsaicinoids in the
Korean diet, was categorized into five levels to reflect the differences in their pungency
depending on the composition of the pepper cultivar [27]. Afterward, the estimated capsai-
cinoid intake level was evaluated to determine its potential effects on weight reduction and
gastric distress compared with previous results from the literature. Concretely, a literature
search was conducted to identify clinical studies that examined the effect of capsaicin, cap-
saicinoids, or chili on body weight, body composition, energy metabolism, obesity, gastric
distress, or gastrointestinal cancers. Crossover, randomized controlled, or case-control stud-
ies that examined energy expenditure, lipid oxidation, anthropometric measures, gastric
symptoms, or gastric cancer as outcomes of interest were included. Studies were excludedNutrients 2021, 13, 2461 3 of 16
if they were conducted only in children or included other interventions (e.g., exercise, other
bioactive compounds) in addition to chili pepper or other capsaicin sources. Studies were
also excluded if they did not provide data for capsaicin or capsaicinoid levels.
2. Materials and Methods
2.1. Study Design
This study was a cross-sectional analysis of the datasets obtained from the KNHANES
in 2014–2018. This nationwide survey conducted by the Korea Center for Disease Control
and Prevention collects information on the socioeconomic status, health-related behaviors,
quality of life, anthropometric measures, and biochemical and clinical profiles of partici-
pants every year to assess the health and nutritional status of Koreans [28]. Each year’s
survey included approximately 10,000 individuals aged one and older based on multi-stage
clustered sampling to represent the entire Korean population. During the survey, food
intake information was obtained using a 24-h recall (24 HR) interview [28].
2.2. Estimation of Capsaicinoid Intake
The combined 24 HR KNHANES datasets from 2014 to 2018 were examined to identify
capsaicinoid-containing foods in the Korean diet. The capsaicinoid consumption level
was calculated as previously described [29] based on food consumption data in the 24HR
datasets and the CAPKO database [27]. Capsaicin and dihydrocapsaicin are the major
capsaicinoids in chili peppers [1,2]. Although dihydrocapsaicin may have similar bio-
logical effects as capsaicin [15,16], most clinical studies have focused on capsaicin as the
active compound in chili peppers. Therefore, existing datasets typically provide only the
capsaicin dose rather than that of capsaicinoids. Capsaicin level was calculated based on
the approximate proportion of capsaicin (two-thirds of capsaicinoids) for capsaicinoid
level estimated in this study, to compare the capsaicin consumption levels reported in the
literature [27].
2.3. Statistical Analyses
Data preparation and statistical analyses were conducted using the SAS software
(version 9.4, SAS Institute Inc., Cary, NC, USA). The KNHANES datasets obtained from
2014 to 2018 were consolidated prior to analysis. A multi-stage sampling design was
implemented, which consisted of combining the datasets, estimating the consumption level,
and evaluating the statistical significance. Statistical analyses were performed after dividing
the participants based on their capsaicinoid consumption level into very low capsaicinoid
(VLC), low capsaicinoid (LC), moderate capsaicinoid (MC), high capsaicinoid (HC), and
very high capsaicinoid (VHC) intake subgroups. Chi-squared tests were performed to
evaluate the proportions of these capsaicinoid-intake subgroups in the study cohort and
to compare the proportions of the consumed capsaicinoid sources (e.g., chili peppers,
red pepper powder, red pepper paste) in the five capsaicinoid intake subgroups within
each age and sex group. Multiple comparisons with Bonferroni correction were made
to examine the differences in total energy intake and body mass index (BMI) among the
capsaicinoid intake subgroups in each age and sex group. Multiple comparisons for total
energy intake and BMI were also conducted with age adjustment for age groups lower
than 20 years. Student’s t-test was performed to determine the differences in fat and sugar
intake between the VHC and other capsaicinoid intake subgroups in participants aged 20
and older. p-values below 0.05 were considered significant.
3. Results
3.1. Estimation of Capsaicinoid Intake in the Korean Diet
Red pepper powder is processed by drying and pulverizing Korean red chili peppers.
This is a major condiment in Korean cuisine that is also largely used for the preparation of
other capsaicinoid-containing foods such as kimchi, red pepper paste, and salted fish. The
mean consumption of red pepper powder and fresh chili pepper was 4.93 and 3.55 g/day,Nutrients 2021, 13, 2461 4 of 16
respectively. Together, these two capsaicinoid sources account for approximately 5.5 g/day
on a dry weight basis (data not shown). The capsaicinoid content in red pepper powder
can vary depending on the red chili pepper varieties used to process the powder. To reflect
the different pungency levels of commercially available red pepper powders, capsaicinoid
content was estimated over five levels [27]. Red pepper powder with medium hotness is
commonly consumed. However, extremely hot powder is also frequently purchased by
consumers. Therefore, the capsaicinoid contents of red pepper powders with medium-hot
and extremely hot intensity were used to estimate the mean intake and the maximum
intake levels, respectively. When the capsaicinoid content of red pepper powder with
medium-hot intensity (59.1 mg/100 g) was used to estimate capsaicinoid intake, the mean
intake level was 3.25 mg/day and the mean intake per body weight was 0.052 mg/kg
body weight (bw)/day (Table 1). In contrast, when the estimations were based on the
capsaicinoid content of extremely hot red pepper powder (153.8 mg/100 g), the maximum
daily intake was 118.01 mg and the maximum intake per body weight was 1.933 mg/kg
bw/day (Table 1).
Table 1. Mean capsaicinoid intake and mean intake per body weight in different age groups in males and females.
Intake (mg/day) (1) Intake Per Body Weight (mg/kg/day) (1)
Age
Sex Mean ± SE Max Mean ± SE Max
Group
0–9 0.83 ± 0.03 16.19 0.036 ± 0.001 0.578
10–19 2.95 ± 0.14 47.19 0.050 ± 0.002 0.682
20–29 3.75 ± 0.17 48.30 0.052 ± 0.003 0.759
30–39 4.55 ± 0.12 28.56 0.061 ± 0.002 0.473
Male 3.94 ± 0.05 0.058 ± 0.001
40–49 4.80 ± 0.12 48.17 0.065 ± 0.002 0.641
50–59 4.73 ± 0.12 44.12 0.069 ± 0.002 0.748
60–69 4.02 ± 0.08 39.28 0.060 ± 0.001 0.600
3.25 ± 0.03 0.052 ± 0.000
≥70 3.19 ± 0.10 37.21 0.050 ± 0.002 0.770
(7.91 ± 0.07, (0.127 ± 0.001,
0–9 0.74 ± 0.03 14.24 118.01) (2) 0.033 ± 0.001 0.412 1.933) (2)
10–19 1.91 ± 0.06 14.19 0.039 ± 0.001 0.378
20–29 2.50 ± 0.08 28.48 0.045 ± 0.001 0.483
30–39 2.73 ± 0.06 30.58 0.048 ± 0.001 0.499
Female 2.49 ± 0.03 0.046 ± 0.000
40–49 3.09 ± 0.07 31.00 0.054 ± 0.001 0.454
50–59 2.95 ± 0.06 36.53 0.052 ± 0.001 0.473
60–69 2.71 ± 0.06 46.41 0.047 ± 0.001 0.802
≥70 2.06 ± 0.08 24.71 0.037 ± 0.002 0.472
(1)Estimates based on the capsaicinoid content of red pepper powder with medium-hot intensity (59.1 mg/100 g); (2) Estimates based on
the capsaicinoid content of red pepper powder with extremely hot intensity (153.8 mg/100 g). Mean ± SE: mean intake, Max: maximum
daily intake.
The average capsaicinoid consumption level was higher in males (3.94 mg/day) than
females (2.49 mg/day), with female consumption levels being 63% of that in males (Table 1).
However, this difference decreased when body weight was accounted for, with females
(0.046 mg/kg bw/day) reaching 79% of the consumption level of males (0.058 mg/kg
bw/day). In both males and females, mean intake per body weight was higher among
those in their 40s (males: 0.065 mg/kg bw/day; females: 0.054 mg/kg bw/day) and 50s
(males: 0.069 mg/kg bw/day; females: 0.052 mg/kg bw/day). Individuals aged 0–9 years
had the lowest consumption levels (males: 0.036 mg/kg bw/day; females: 0.033 mg/kg
bw/day) (Table 1). The maximum capsaicinoid consumption amounts in each sex and age
group ranged from 8 to 17 times the mean intake per body weight in the same sex and age
group (Table 1).
3.2. Characteristics of the High Capsaicinoid Intake Subgroup
Capsaicinoid intake levels exhibited a right-skewed distribution (i.e., the values were
clustered around the left tail of the distribution). Depending on the level of capsaicinoidNutrients 2021, 13, 2461 5 of 16
intake, participants were divided into five groups (VLC, LC, MC, HC, and VHC). The 25th
(1 mg), 50th (3 mg), and 75th (5 mg) percentiles and a start point (12 mg) of extreme values
in a long tail on the right side of the distribution were used as cut points. The average
capsaicinoid intakes in the VLC (>1 mg), LC (1–3 mg), MC (3–5 mg), HC (5–12 mg), and
VHC (≥12 mg) intake subgroups were 0.47, 1.93, 3.87, 7.06, and 17.32 mg/day, respectively
(Table 2). The majority of Koreans (78%) consumed more than 1 mg capsaicinoid/day
in the survey. The HC and VHC intake subgroups more frequently included males than
females. In terms of age groups, the majority of male and female children (>70%) aged less
than 10 years old were grouped in the VLC intake subgroup (Table 2). Male participants
accounted for 20–30% of the LC, MC, and HC intake subgroups, whereas this proportion de-
creased to 16.3% in the VLC group and only 3.0% in the VHC intake subgroup. Individuals
in the 10–20 year and ≥70 year age groups were more frequently included in the LC intake
subgroup (approximately 40%). Female participants were more frequently included in the
VLC (28.6%) and LC (41.1%) intake subgroups than males, while the HC and VHC intake
subgroups contained only 10.3% and 0.9% of the overall female population, respectively.
Except for the youngest female age group, where a majority (74.2%) was grouped in the
VLC intake subgroup, the proportions of the capsaicinoid intake subgroups remained
similar among females regardless of age groups (Table 2).
Table 2. Percentage (%) of participants in the five subgroups divided by their capsaicinoid consumption levels in different
age groups in males and females.
Capsaicinoid Intake
VLC LC MC HC VHC
Subgroup (1)
Consumption level
12
(mg/day)
Mean ± SE (mg/day) 0.47 ± 0.00 1.93 ± 0.01 3.87 ± 0.01 7.06 ± 0.03 17.32 ± 0.43
Weighted number of 1,334,884,679
808,218,532 (22.1) 785,864,767 (21.5) 652,230,874 (17.8) 74,075,078 (2.0)
participants (percentage, %) (36.5)
Male (%) 16.3 32.4 23.6 24.6 3.0
Age 0–9 72.3 22.8 4.1 0.7 0.1
Age 10–19 25.1 40.5 19.4 13.1 1.9
Age 20–29 16.7 35.7 21.5 23.6 2.5
Age 30–39 10.3 31.1 24.0 30.6 4.0
Age 40–49 7.0 28.4 28.9 31.3 4.4
Age 50–59 6.4 30.1 27.5 31.5 4.5
Age 60–69 9.6 33.9 27.9 26.9 1.7
Age ≥ 70 14.8 43.5 25.0 15.2 1.4
Female (%) 28.6 41.1 19.1 10.3 0.9
Age 0–9 74.2 22.9 2.5 0.3 0.0
Age 10–19 35.6 44.8 13.9 5.6 0.2
Age 20–29 29.4 39.5 20.3 9.9 0.8
Age 30–39 23.2 41.4 22.3 12.4 0.7
Age 40–49 16.8 43.7 23.0 14.9 1.6
Age 50–59 18.2 43.4 24.5 12.5 1.3
Age 60–69 22.9 43.4 21.3 11.7 0.8
Age ≥ 70 35.7 43.7 12.8 7.1 0.6
(1)
Study participants were divided into five subgroups depending on their level of capsaicinoid intake: very low capsaicinoid (VLC), low
capsaicinoid (LC), moderate capsaicinoid (MC), high capsaicinoid (HC), and very high capsaicinoid (VHC) intake.
Based on the proportion of the capsaicinoid intake subgroups, the probable intake
level was estimated to be 1–5 mg of capsaicinoids (0.67–3.33 mg capsaicin) per day, which
coincided with the consumption levels for the LC and MC intake subgroups (Table 3).
Further, the upper level of capsaicinoid intake was estimated to be 12.15–29.16 mg of
capsaicinoids (8.10–19.44 mg capsaicin), which coincided with the consumption level for
the HC intake subgroup (Table 3). However, it was assumed that individuals in the HC
subgroup favor spicy foods and therefore likely consume extremely hot red pepper powderNutrients 2021, 13, 2461 6 of 16
rather than medium-hot powder. Thus, the values were derived by multiplying the upper
and lower consumption levels for HC by the ratio of the mean intake (7.91 mg) estimated
with the capsaicinoid content of extremely hot red pepper powder to the mean intake
(3.25 mg) estimated with the capsaicinoid content of medium-hot red pepper powder
(Table 1).
Table 3. Estimation of the probable capsaicinoid and capsaicin intake levels and upper intake levels.
Probable Intake Level (1) Upper Intake Level (2) Maximum Intake (3)
Capsaicinoid consumption level
1–5 12.15–29.16 118.01
(mg/day/person)
Capsaicin consumption level (4)
0.67–3.33 8.10–19.44 78.67
(mg/day/person)
Percentage (%) 58 18
(1)Consumption range for the low (LC) and moderate (MC) capsaicinoid intake subgroups. (2) The values were calculated by multiplying
the consumption range for the high capsaicinoid (HC) intake subgroup with the ratio of the mean intake level (7.91 mg) estimated with the
capsaicinoid content of extremely hot red pepper powder to the mean intake level (3.25 mg) estimated with the capsaicinoid content of
medium-hot red pepper powder. (3) Maximum intake level when capsaicinoid intake level was estimated with the capsaicinoid content of
extremely hot red pepper powder. (4) Capsaicin levels were estimated as two-thirds of the capsaicinoid levels.
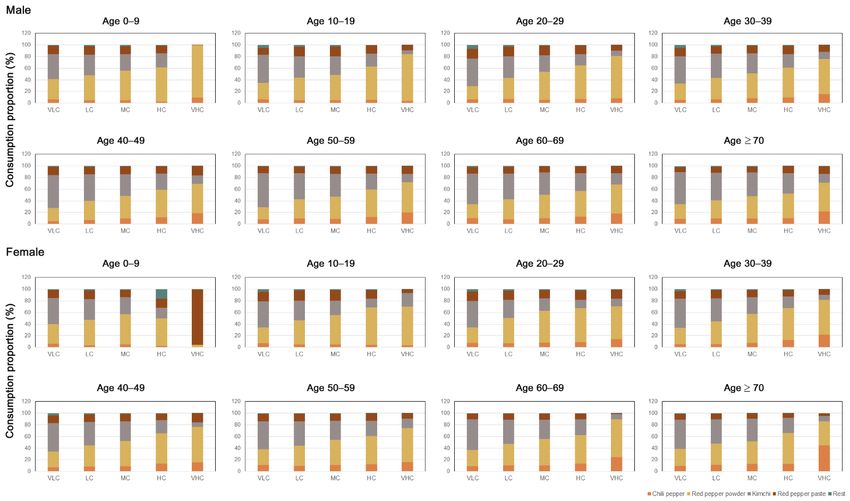
The major sources of capsaicinoids were chili pepper, red pepper powder, kimchi,
and red pepper paste (Figure 1). Other capsaicinoid sources included hot sauce, salted
fish, instant noodles, and other convenience foods (e.g., spicy canned tuna and kimchi
dumplings). However, the amount of capsaicinoid consumed via these food sources was
very low, accounting for less than 1% of the total intake (Figure 1). From a population-wide
perspective, red pepper powder was the most highly consumed (45%), followed by kimchi
(30%), red pepper paste (13%), and chili peppers (10%) (data not shown). However, the
consumption proportion of each capsaicinoid source varied depending on the capsaicinoid
intake subgroup, age group, and sex. Except for females aged less than 10 in the VHC
group, among whom red pepper paste accounted for approximately 96% of capsaicinoid
consumption (Figure 1), red pepper powder was the main contributor to capsaicinoid
consumption in the VHC intake subgroup. In males, the proportion of red pepper powder
consumption was very high in children less than 10 years of age (90%) and 10–19 year-old
participants (80%), as well as participants aged 20–29 years (72%). However, the percentage
of red pepper powder consumption decreased (50–60%) among male participants aged 30
and older, and they exhibited higher red chili pepper consumption rates (15–20%) than
the younger age groups (Nutrients 2021, 13, 2461 7 of 16
Nutrients 2021, 13, x FOR PEER REVIEW 7 of 16
Figure 1. Consumption proportion of various capsaicinoid sources in the Korean diet in the five capsaicinoid intake
Figure 1. Consumption proportion of various capsaicinoid sources in the Korean diet in the five capsaicinoid intake sub-
subgroups in each age and sex group. The study participants were divided into five subgroups depending on the level of
groups in each age and sex group. The study participants were divided into five subgroups depending on the level of
capsaicinoid intake:
capsaicinoid veryvery
intake: lowlow
capsaicinoid
capsaicinoid(VLC),
(VLC),low
lowcapsaicinoid (LC),moderate
capsaicinoid (LC), moderate capsaicinoid
capsaicinoid (MC),
(MC), high high capsaicinoid
capsaicinoid
(HC), (HC),
and very
and high capsaicinoid
very high (VHC)
capsaicinoid (VHC)intake.
intake.
Multiple
Multiplecomparisons
comparisons wereweremademadetotoexamine
examine differences
differences in total
in total energy
energy intakeintake
and and
BMI among different capsaicinoid intake subgroups. Overall, the energy intake in the
BMI among different capsaicinoid intake subgroups. Overall, the energy intake in the MC,
MC,HC, andand
HC, VHC VHC subgroups tended
subgroups to be higher
tended than those
to be higher than in those
the VLC and VLC
in the LC intake sub-intake
and LC
groups (Table 4). Therefore, the high capsaicinoid intake in the VHC
subgroups (Table 4). Therefore, the high capsaicinoid intake in the VHC group could have group could have
simply
simply beenaareflection
been reflection ofofthe
thehigher
higherfood consumption
food consumption rates of this of
rates subgroup. Total en- Total
this subgroup.
ergy intake was significantly higher in the VHC subgroup than in the other subgroups
energy intake was significantly higher in the VHC subgroup than in the other subgroups
among males in their 20s, 30s, 40s, 50s, and 60s (Table 4). Among females of the HC and
among males in their 20s, 30s, 40s, 50s, and 60s (Table 4). Among females of the HC and
VHC intake subgroups, only participants in their 40s exhibited a significantly higher total
VHC intake subgroups, only participants in their 40s exhibited a significantly higher total
energy intake than the other subgroups. Given that age affects the energy requirements in
energy intake groups
the younger than the other
(Nutrients 2021, 13, 2461 8 of 16
Table 4. Total energy intake and BMI in the five capsaicinoid intake subgroups in each age and sex group.
Capsaicinoid Intake
VLC LC MC HC VHC
Subgroup (1)
Total Energy Intake (kcal,Mean ± SE)
Age 0–9 1482 ± 17.7 a(2) 1910 ± 40.3 b 2654 ± 167.7 c 2800 ± 117.1 c 1890 ± 205.4 ab
Age 10–19 2246 ± 42.7 a 2367 ± 47.6 a 3016 ± 142.2 b 3318 ± 101.2 b 4402 ± 474.1 b
Age 20–29 2120 ± 73.4 a 2567 ± 66.1 b 2785 ± 111.1 b 3278 ± 105.7 c 4192 ± 247.5 d
Age 30–39 2400 ± 96.3 a 2408 ± 47.8 a 2853 ± 80.1 b 3193 ± 68.6 c 4179 ± 235.2 d
Male
Age 40–49 2267 ± 92.4 a 2272 ± 40.4 a 2597 ± 48.8 b 2948 ± 55.4 c 4297 ± 293.3 d
Age 50–59 2198 ± 85.6 ab 2175 ± 43.9 a 2428 ± 40.7 b 2806 ± 46.7 c 3381 ± 131.9 d
Age 60–69 1863 ± 49.5 a 2050 ± 32.5 b 2258 ± 40.1 c 2631 ± 51.3 d 3237 ± 219.5 d
Age ≥ 70 1685 ± 39.0 a 1878 ± 30.6 b 2112 ± 35.2 c 2368 ± 70.9 d 2740 ± 369.9 bcd
Age 0–9 1333 ± 15.7 a 1713 ± 38.8 b 1982 ± 87.0 c 2196 ± 403.1 abc 2060 ± 0.0 c
Age 10–19 1824 ± 36.2 a 1950 ± 33.7 a 2257 ± 78.6 b 2658 ± 165.2 b 3646 ± 565.8 b
Age 20–29 1688 ± 37.9 a 1966 ± 53.9 b 2399 ± 125.5 c 2623 ± 130.4 c 3819 ± 597.2 c
Age 30–39 1692 ± 32.8 a 1854 ± 26.6 b 2046 ± 36.9 c 2236 ± 53.6 d 2641 ± 222.7 cd
Female
Age 40–49 1550 ± 38.9 a 1749 ± 24.3 b 1987 ± 40.5 c 2252 ± 45.5 d 2626 ± 172.5 d
Age 50–59 1581 ± 48.7 a 1699 ± 20.3 a 1929 ± 38.8 b 2232 ± 55.9 c 2364 ± 204.6 bc
Age 60–69 1495 ± 29.3 a 1666 ± 21.9 b 1945 ± 45.6 c 2254 ± 67.3 d 2097 ± 188.4 bcd
Age ≥ 70 1326 ± 24.4 a 1493 ± 24.0 b 1745 ± 41.6 c 2047 ± 119.1 cd 2467 ± 168.0 d
BMI (kg/m2 , Mean ± SE)
Age 0–9 16.1 ± 0.07 a * 16.9 ± 0.16 a * 18.0 ± 0.53 a * 18.8 ± 1.60 a * 16.2 ± 0.58 a *
Age 10–19 20.9 ± 0.19 a * 21.3 ± 0.19 a * 21.2 ± 0.30 a * 22.5 ± 0.31 a * 22.1 ± 0.78 a *
Age 20–29 24.2 ± 0.26 a 24.2 ± 0.27 a 24.0 ± 0.28 a 24.9 ± 0.37 a 23.2 ± 0.78 a
Age 30–39 25.0 ± 0.24 a 25.2 ± 0.20 a 25.0 ± 0.20 a 25.1 ± 0.18 a 25.4 ± 0.52 a
Male
Age 40–49 24.7 ± 0.31 a 24.6 ± 0.15 a 24.5 ± 0.17 a 25.1 ± 0.17 a 24.9 ± 0.41 a
Age 50–59 24.0 ± 0.28 a 24.3 ± 0.13 a 24.7 ± 0.17 a 24.7 ± 0.15 a 25.0 ± 0.37 a
Age 60–69 24.1 ± 0.22 a 24.2 ± 0.15 a 24.1 ± 0.14 a 24.4 ± 0.15 a 24.8 ± 0.45 a
Age ≥ 70 23.4 ± 0.20 a 23.7 ± 0.14 a 23.6 ± 0.21 a 23.9 ± 0.23 a 23.9 ± 0.46 a
Age 0–9 16.6 ± 0.15 a 17.3 ± 0.24 a 17.6 ± 0.45 a 15.8 ± 0.57 a 21.3 ± 0.00 a
Age 10–19 20.2 ± 0.16 a * 20.3 ± 0.18 a * 21.2 ± 0.44 a * 21.0 ± 0.53 a * 16.9 ± 0.55 a *
Age 20–29 21.6 ± 0.19 a 21.8 ± 0.17 a 21.6 ± 0.30 a 21.7 ± 0.40 a 21.1 ± 0.83 a
Age 30–39 22.4 ± 0.21 a 22.5 ± 0.15 a 22.6 ± 0.27 a 22.5 ± 0.27 a 24.6 ± 1.53 a
Female
Age 40–49 23.0 ± 0.16 a 23.0 ± 0.12 a 23.3 ± 0.23 ab 23.3 ± 0.23 ab 25.4 ± 0.75 b
Age 50–59 23.6 ± 0.16 a 23.6 ± 0.16 a 23.8 ± 0.14 a 23.8 ± 0.21 a 24.0 ± 0.59 a
Age 60–69 24.3 ± 0.14 a 24.2 ± 0.11 a 24.1 ± 0.19 a 25.0 ± 0.28 a 24.1 ± 0.90 a
Age ≥ 70 24.4 ± 0.14 a 24.6 ± 0.15 a 24.7 ± 0.25 a 25.0 ± 0.36 a 24.2 ± 0.89 a
(1)Study participants were divided into five subgroups depending on their level of capsaicinoid intake: very low capsaicinoid (VLC), low
capsaicinoid (LC), moderate capsaicinoid (MC), high capsaicinoid (HC), and very high capsaicinoid (VHC) intake. (2) Multiple comparisons
with Bonferroni correction were made to examine the difference in total energy intake and body mass index (BMI) among capsaicinoid
intake subgroups in each age and sex group. Analyses were also conducted with age adjustment for age groups under 20. Subgroups
sharing the same letter superscript are not significantly different (p < 0.05). The asterisks indicate changes in significant difference after age
adjustment.
Red pepper powder is often used alongside sugar and fat in food preparation. Stu-
dent’s t-test was conducted to determine whether the sugar or fat intake in the VHC intake
subgroup differed from that in the other intake subgroups in individuals aged 20 years
and over. Fat intake was significantly higher in the VHC groups compared with all other
capsaicinoid intake subgroups in males in their 20s, 30s, 40s, and 50s and females in their
20s and 40s (Table 5). Additionally, the VHC intake subgroup showed significantly higher
fat intake than the other subgroups, except for HC, in males in their 60s and females in
their 30s. Sugar intake was significantly higher in the VHC groups than in any of the VLC,
LC, and MC subgroups in males. In contrast, sugar intake in females was significantly
higher in the VHC intake subgroups than in the MC, LC, and VLC intake subgroups only
in participants in their 40s and participants aged 70 years and over (Table 5).Nutrients 2021, 13, 2461 9 of 16
Table 5. Fat and sugar intake levels in the five capsaicinoid intake subgroups in each age and sex group.
Capsaicinoid Intake
VLC LC MC HC VHC
Subgroup (1)
Fat Intake (g, Mean ± SE)
Age 20–29 59.4 ± 2.6 *(2) 68.9 ± 2.9 * 76.0 ± 4.5 * 92.4 ± 6.3 * 135.9 ± 14.3
Age 30–39 66.1 ± 3.8 * 61.6 ± 1.9 * 71.7 ± 2.7 * 80.6 ± 3.1 * 111.4 ± 11.4
Age 40–49 51.1 ± 2.4 * 52.1 ± 1.8 * 60.9 ± 2.0 * 66.4 ± 2.2 * 79.6 ± 5.7
Male
Age 50–59 48.2 ± 3.1 * 45.3 ± 1.9 * 48.6 ± 1.4 * 59.2 ± 1.9 * 81.8 ± 7.7
Age 60–69 33.8 ± 2.6 * 36.2 ± 1.0 * 40.2 ± 1.4 * 46.7 ± 1.6 72.0 ± 14.7
Age ≥ 70 26.9 ± 1.3 30.2 ± 1.0 34.2 ± 1.5 38.7 ± 2.3 62.7 ± 21.6
Age 20–29 49.2 ± 1.8 * 55.7 ± 2.3 * 67.8 ± 5.0 * 72.4 ± 5.9 * 143.7 ± 31.5
Age 30–39 45.5 ± 1.4 * 47.1 ± 1.1 * 50.4 ± 1.6 * 56.3 ± 1.8 85.4 ± 15.5
Age 40–49 38.2 ± 1.5 * 41.0 ± 0.9 * 46.6 ± 1.6 * 58.2 ± 2.4 * 82.3 ± 11.3
Female
Age 50–59 36.0 ± 2.0 35.7 ± 0.8 38.1 ± 1.0 45.4 ± 1.6 49.7 ± 8.6
Age 60–69 27.5 ± 0.9 30.4 ± 0.8 35.3 ± 1.2 44.0 ± 2.3 44.2 ± 9.1
Age ≥ 70 19.6 ± 0.7 23.3 ± 1.0 28.4 ± 1.4 32.7 ± 3.1 35.1 ± 9.1
Sugar intake (g, Mean ± SE)
Age 20–29 67.5 ± 5.4 * 72.8 ± 3.8 * 83.6 ± 8.6 88.5 ± 4.9 117.1 ± 17.6
Age 30–39 81.5 ± 5.9 69.2 ± 3.0 * 72.6 ± 3.6 * 83.6 ± 3.9 114.6 ± 21.1
Age 40–49 60.5 ± 3.9 * 64.0 ± 2.7 * 67.1 ± 2.9 * 71.7 ± 2.7 * 124.9 ± 15.0
Male
Age 50–59 70.1 ± 6.5 62.1 ± 2.5 * 65.7 ± 2.7 * 70.6 ± 2.6 * 88.3 ± 7.2
Age 60–69 56.4 ± 3.9 * 58.0 ± 2.1 * 63.3 ± 2.4 * 76.1 ± 4.0 117.2 ± 26.5
Age ≥ 70 44.6 ± 3.1 * 47.1 ± 2.1 * 63.3 ± 3.6 63.9 ± 4.1 79.8 ± 14.5
Age 20–29 59.6 ± 3.1 61.3 ± 2.8 79.1 ± 5.9 80.2 ± 8.1 94.1 ± 17.6
Age 30–39 57.1 ± 2.0 59.4 ± 2.0 61.5 ± 2.8 67.2 ± 3.4 73.1 ± 10.9
Age 40–49 58.3 ± 3.0 * 57.6 ± 1.7 * 62.0 ± 2.4 * 72.5 ± 3.8 81.3 ± 6.3
Female
Age 50–59 60.5 ± 2.2 64.3 ± 2.0 69.1 ± 2.6 81.5 ± 5.1 57.0 ± 8.2
Age 60–69 54.7 ± 2.4 56.3 ± 1.9 73.0 ± 5.7 70.5 ± 4.0 107.1 ± 44.8
Age ≥ 70 45.6 ± 2.3 * 46.8 ± 2.3 * 49.0 ± 3.7 * 79.8 ± 15.1 76.6 ± 7.4
(1)
Study participants were divided into five subgroups depending on the level of capsaicinoid intake: very low capsaicinoid (VLC), low
capsaicinoid (LC), moderate capsaicinoid (MC), high capsaicinoid (HC), and very high capsaicinoid (VHC) intake. (2) Student’s t-test was
performed to determine the differences in fat and sugar intake between VHC and other capsaicinoid intake subgroups in male and female
participants aged 20 or older. The asterisks indicate significant differences compared to the VHC intake subgroup (p < 0.05).
4. Discussion
Capsaicinoid consumption has been linked to contradicting health effects such as
cancer prevention, cancer promotion, weight reduction and gastric distress. Therefore,
the health effects of dietary capsaicin might be largely determined by the exposure levels.
Chili peppers are an essential ingredient in the Korean diet, which can lead to relatively
high capsaicinoid consumption in the Korean population. This study utilized a previously
developed database of capsaicinoid contents in foods commonly consumed in Korea
(CAPKO) and the 24HR datasets obtained from the KNHANES, a nationwide survey
program, to assess the dietary capsaicinoid exposure. Afterward, capsaicinoid intake levels
were evaluated to determine its potential effects on weight control or gastric distress.
The average daily chili pepper consumption (combined consumption level of fresh
chili pepper and red pepper powder) among the Korean population was estimated to
be approximately 5.5 g (dry weight basis) in this study. In comparison, in an estimation
based on production reports, chili pepper consumption per capita was estimated to be
approximately 3 kg in South Korea in 2019, which is equivalent to approximately 8 g
per day [30]. This difference may be attributed to food waste losses or loss during food
preparation, which were not considered in estimates based on food-production data. A
study also reported that the mean intake of red peppers was 4.6 g/day when three 24HR
were conducted in 100 female university students [31], which was similar to the chili pepper
consumption level estimated in this study; females in their 20s consumed approximatelyNutrients 2021, 13, 2461 10 of 16
4.2 g of chili peppers per day (77% capsaicinoid consumption relative to mean population
capsaicinoid consumption) (Table 1).
The mean capsaicinoid intake was estimated to be 3.25 mg/day (2.17 mg capsaicin/day)
(Table 1). Urinary metabolites of capsaicin were previously identified using HPLC in an
attempt to utilize them as biomarkers to estimate capsaicin exposure [32]. However, there
were individual variations in urinary metabolite levels, which were likely due to differences
in capsaicin absorption and biotransformation [32], making it difficult to estimate dietary
capsaicin levels based on urinary metabolite analysis. This study is the first estimation of
capsaicinoid intake level in the Korean population. The mean capsaicinoid intake can be
achieved by consuming approximately 300 g (three servings) of kimchi (a staple in Korean
cuisine) in a day. This amount is also equivalent to 70 g of fresh Korean chili peppers (three
fresh peppers) or 50 g (three tablespoons) of red pepper paste [27]. The majority of Koreans
consume more than 1 mg of capsaicinoids per day (Table 2). The probable capsaicinoid con-
sumption level was estimated to be 1–5 mg/day (0.67–3.33 mg capsaicin/day), whereas the
upper consumption level was estimated to be 12–29 mg capsaicinoid/day (8.10–19.44 mg
capsaicin/day) (Table 3). Therefore, Koreans consume more capsaicin than people in the
US and Europe, where the maximum capsaicin intake was estimated to be approximately
1.5 mg/day, but less than the levels consumed in Thailand and Mexico, where capsaicin
consumption was estimated to be 25–200 mg/day [33]. However, a small proportion of
Koreans (Nutrients 2021, 13, 2461 11 of 16
study participants might have increased but these changes were not yet reflected in their
BMI values. Furthermore, capsaicin intake might have helped manage body weight and
body composition, thereby making an increase in BMI less apparent relative to the high
energy consumption, as discussed below.
Capsaicin consumption may increase lipid oxidation and energy expenditure, and
this may be related to capsaicin-induced thermogenesis. In rats, intravenous capsaicin
injection increased thermogenesis, which was accompanied by a dose-dependent increase
in catecholamine secretion [20]. Additionally, both catecholamine concentration and en-
ergy expenditure increased in non-obese healthy young men 30 min after consuming a
meal containing 10 g of red pepper [38]. Further, this capsaicin-induced catecholamine
secretion was abolished by administering adrenergic blockers such as propranolol [38].
Thus, the findings of previous studies suggest that capsaicin can increase thermogenesis
via stimulation of the SNS in both humans and rodents. In clinical studies, a relatively
high dose of capsaicin (6–30 mg/day) for a short-term (Nutrients 2021, 13, 2461 12 of 16
supplementation with 33 mg capsaicin/day for 4 weeks did not affect anthropometric
measurements in obese individuals [42]. Additionally, the administration of a higher dose
(135 mg daily capsaicin) for a 3-month weight-maintenance period following weight re-
duction did not suppress weight regain, even though capsaicin supplementation increased
lipid oxidation and energy expenditure [11]. Another study called into question the rigor
with which the covariates were controlled. For example, 4 mg of capsaicinoids for 3 months
has been shown to only significantly reduce the percent body fat change and fat mass after
post-hoc analysis in which the baseline values of body fat percentage, fat mass, and protein,
fat, and carbohydrate intake were considered as covariates due to the involvement of mul-
tiple factors in body composition changes [43]. These observations are highly relevant to
the present study, as the majority of Koreans consume 1–5 mg of capsaicinoids per day, and
therefore it is not uncommon for Koreans to consume 4 mg of capsaicinoids per day. More-
over, as demonstrated in the present study, individuals that consumed high amounts of
capsaicinoids also tended to consume higher amounts of food (Tables 4 and 5). In long-term
studies, food consumption may be difficult to control over long periods although capsaicin
ingestion could be controlled because it was administered as capsules [11,13,42]. Therefore,
it is important to consider food intake as a covariate, particularly in long-term studies.
The observed effect of capsaicinoids on body fat could be a combination of the long-term
effects of capsaicin on food intake, energy expenditure, and lipid oxidation, even though
the SNS-stimulating effects of capsaicin may be reduced by repeated capsaicin exposure.
Additionally, consuming capsaicin-containing meals (33 mg capsaicin/day for 4 weeks)
reduced the postprandial insulin level by potentially increasing insulin sensitivity [10].
Notably, the decrease in postprandial insulin level after a capsaicin diet was more apparent
with increasing BMI (≥26.3). Consistent with these findings, chili consumption has also
been shown to decrease postprandial insulin levels in obese individuals [44]. TRPV1 has
been shown to mediate glucose-induced insulin secretion, and TRPV1−/− mice have been
shown to be more insulin-resistant than wild-type mice [45]. Therefore, the activation
of TRPV1 after capsaicin intake may increase insulin sensitivity. However, the potential
effect of a 4-mg capsaicinoid consumption level on insulin sensitivity or energy balance
remains unclear. Further, its effect on other parameters related to metabolic mechanisms
such as thermogenesis and lipid oxidation was not reported, and therefore more studies
are required to verify the effect of capsaicinoid consumption on fat loss. Notably, only
the aforementioned study instructed the participants to consume capsaicinoids before
lunch [13,43]. In contrast, capsaicin capsules were consumed with each meal in the other
two long-term studies [11,42]. Therefore, future studies should also determine whether
taking capsaicinoids prior to a meal affects its effect on body weight or body composition.
Capsaicin is an irritant that elicits pain or a burning sensation upon contact with mu-
cosal tissues. Therefore, topical application, inhalation, and dietary exposure to capsaicin
can cause toxic effects associated with pain induction. The most common toxic effect of
capsaicin ingestion is gastric distress [46]. However, capsaicin has also been studied for its
potential therapeutic applicability in relieving gastric reflux-related symptoms due to its
hypersensitizing and pain-relieving effects [4,47]. Esophageal infusion with a tabasco sauce
suspension (0.84 mg capsaicin) increased the sensitivity to distension-induced secondary
peristalsis, although the effect of capsaicin was reduced upon repeated exposure in both
patients with gastroesophageal reflux disease (GERD) [48] and healthy volunteers [49].
Another study indicated that chili intake (chili capsules containing 1.46 mg capsaicin)
could decrease early satiety in non-erosive gastroesophageal reflux disease (NERD) pa-
tients, which can be related to an increase in postprandial gastric accommodation after
a capsaicinoid-containing meal compared to a placebo [50]. However, the same study
also reported that chili could induce abdominal burning symptoms in NERD patients
but not in healthy volunteers [50]. Additionally, capsaicin (5 mg) did not affect either
gastric emptying or dyspepsia, but it increased postprandial abdominal pain in patients
with heartburn [47]. In healthy individuals, 3 g of cascabel chili (2.64 mg capsaicin) but
not ancho chili (1.46 mg capsaicin) significantly increased the number of reflux episodesNutrients 2021, 13, 2461 13 of 16
and the percentage of time in which the pH in the esophagus is below 4 [51]. Therefore,
studies have indicated that even low doses of capsaicin (Nutrients 2021, 13, 2461 14 of 16
underlying mechanisms of capsaicinoid-induced metabolic regulation must be further
elucidated. Further, the consumption of other dietary components such as fat and sugar
must also be controlled to achieve a robust assessment of the beneficial effects of capsaicin
in weight loss and management.
Funding: This research received no external funding.
Institutional Review Board Statement: Ethical review and approval were waived for this study,
due to utilization of publicly available datasets and no available information to recognize study
participants.
Informed Consent Statement: Informed consent statement is not applicable for this study due to
the use of the data obtained from the study conducted by Korea Disease Control and Prevention
Agency (KDCA).
Data Availability Statement: Data are available from the official website of KDCA; https://knhanes.
kdca.go.kr/knhanes/ (accessed on 18 July 2021).
Conflicts of Interest: The author has no conflicts of interest to declare.
References
1. Barbero, G.F.; Liazid, A.; Azaroual, L.; Palma, M.; Barroso, C.G. Capsaicinoid Contents in Peppers and Pepper-Related Spicy
Foods. Int. J. Food Prop. 2016, 19, 485–493. [CrossRef]
2. Pena-Alvarez, A.; Ramirez-Maya, E.; Alvarado-Suarez, L.A. Analysis of capsaicin and dihydrocapsaicin in peppers and pepper
sauces by solid phase microextraction-gas chromatography-mass spectrometry. J. Chromatogr. A 2009, 1216, 2843–2847. [CrossRef]
3. Yang, F.; Zheng, J. Understand spiciness: Mechanism of TRPV1 channel activation by capsaicin. Protein Cell 2017, 8, 169–177.
[CrossRef] [PubMed]
4. Liu, T.T.; Yi, C.H.; Lei, W.Y.; Hung, X.S.; Yu, H.C.; Chen, C.L. Influence of repeated infusion of capsaicin-contained red pepper
sauce on esophageal secondary peristalsis in humans. Neurogastroenterol. Motil. 2014, 26, 1487–1493. [CrossRef] [PubMed]
5. Watanabe, T.; Kawada, T.; Iwai, K. Effect of capsaicin pretreatment on capsaicin-induced catecholamine secretion from the adrenal
medulla in rats. Proc. Soc. Exp. Biol. Med. 1988, 187, 370–374. [CrossRef] [PubMed]
6. Bujak, J.K.; Kosmala, D.; Szopa, I.M.; Majchrzak, K.; Bednarczyk, P. Inflammation, Cancer and Immunity-Implication of TRPV1
Channel. Front. Oncol. 2019, 9, 1087. [CrossRef] [PubMed]
7. Braga Ferreira, L.G.; Faria, J.V.; Dos Santos, J.P.S.; Faria, R.X. Capsaicin: TRPV1-independent mechanisms and novel therapeutic
possibilities. Eur. J. Pharm. 2020, 887, 173356. [CrossRef]
8. Lee, E.; Jung, D.Y.; Kim, J.H.; Patel, P.R.; Hu, X.D.; Lee, Y.; Azuma, Y.; Wang, H.F.; Tsitsilianos, N.; Shafiq, U.; et al. Transient
receptor potential vanilloid type-1 channel regulates diet-induced obesity, insulin resistance, and leptin resistance. Faseb. J. 2015,
29, 3182–3192. [CrossRef]
9. Panchal, S.K.; Bliss, E.; Brown, L. Capsaicin in Metabolic Syndrome. Nutrients 2018, 10, 630. [CrossRef]
10. Ahuja, K.D.; Robertson, I.K.; Geraghty, D.P.; Ball, M.J. Effects of chili consumption on postprandial glucose, insulin, and energy
metabolism. Am. J. Clin. Nutr. 2006, 84, 63–69. [CrossRef]
11. Lejeune, M.P.; Kovacs, E.M.; Westerterp-Plantenga, M.S. Effect of capsaicin on substrate oxidation and weight maintenance after
modest body-weight loss in human subjects. Br. J. Nutr. 2003, 90, 651–659. [CrossRef]
12. Ludy, M.J.; Moore, G.E.; Mattes, R.D. The effects of capsaicin and capsiate on energy balance: Critical review and meta-analyses
of studies in humans. Chem. Senses. 2012, 37, 103–121. [CrossRef]
13. Urbina, S.L.; Roberts, M.D.; Kephart, W.C.; Villa, K.B.; Santos, E.N.; Olivencia, A.M.; Bennett, H.M.; Lara, M.D.; Foster, C.A.;
Purpura, M.; et al. Effects of twelve weeks of capsaicinoid supplementation on body composition, appetite and self-reported
caloric intake in overweight individuals. Appetite 2017, 113, 264–273. [CrossRef]
14. Feketa, V.V.; Balasubramanian, A.; Flores, C.M.; Player, M.R.; Marrelli, S.P. Shivering and tachycardic responses to external
cooling in mice are substantially suppressed by TRPV1 activation but not by TRPM8 inhibition. Am. J. Physiol. Reg. Integr. Comp.
Physiol. 2013, 305, R1040–R1050. [CrossRef] [PubMed]
15. Ahuja, K.D.; Kunde, D.A.; Ball, M.J.; Geraghty, D.P. Effects of capsaicin, dihydrocapsaicin, and curcumin on copper-induced
oxidation of human serum lipids. J. Agric. Food Chem. 2006, 54, 6436–6439. [CrossRef] [PubMed]
16. Negulesco, J.A.; Noel, S.A.; Newman, H.A.; Naber, E.C.; Bhat, H.B.; Witiak, D.T. Effects of pure capsaicinoids (capsaicin and
dihydrocapsaicin) on plasma lipid and lipoprotein concentrations of turkey poults. Atherosclerosis 1987, 64, 85–90. [CrossRef]
17. Christie, S.; Wittert, G.A.; Li, H.; Page, A.J. Involvement of TRPV1 Channels in Energy Homeostasis. Front. Endocrinol. 2018, 9,
420. [CrossRef] [PubMed]
18. Sun, F.; Xiong, S.; Zhu, Z. Dietary Capsaicin Protects Cardiometabolic Organs from Dysfunction. Nutrients 2016, 8, 174. [CrossRef]
19. Yoshioka, M.; St-Pierre, S.; Suzuki, M.; Tremblay, A. Effects of red pepper added to high-fat and high-carbohydrate meals on
energy metabolism and substrate utilization in Japanese women. Br. J. Nutr. 1998, 80, 503–510. [CrossRef] [PubMed]Nutrients 2021, 13, 2461 15 of 16
20. Watanabe, T.; Kawada, T.; Kurosawa, M.; Sato, A.; Iwai, K. Adrenal sympathetic efferent nerve and catecholamine secretion
excitation caused by capsaicin in rats. Am. J. Physiol. 1988, 255, E23–E27. [CrossRef] [PubMed]
21. Matsumoto, T.; Miyawaki, C.; Ue, H.; Yuasa, T.; Miyatsuji, A.; Moritani, T. Effects of capsaicin-containing yellow curry sauce on
sympathetic nervous system activity and diet-induced thermogenesis in lean and obese young women. J. Nutr. Sci. Vitam. 2000,
46, 309–315. [CrossRef]
22. Satyanarayana, M.N. Capsaicin and gastric ulcers. Crit. Rev. Food Sci. Nutr. 2006, 46, 275–328. [CrossRef] [PubMed]
23. Sareban, M.; Zugel, D.; Koehler, K.; Hartveg, P.; Zugel, M.; Schumann, U.; Steinacker, J.M.; Treff, G. Carbohydrate Intake in Form
of Gel Is Associated With Increased Gastrointestinal Distress but Not With Performance Differences Compared With Liquid
Carbohydrate Ingestion During Simulated Long-Distance Triathlon. Int. J. Sport Nutr. Exerc. 2016, 26, 114–122. [CrossRef]
[PubMed]
24. Lopez-Carrillo, L.; Hernandez Avila, M.; Dubrow, R. Chili pepper consumption and gastric cancer in Mexico: A case-control
study. Am. J. Epidemiol. 1994, 139, 263–271. [CrossRef]
25. Georgescu, S.R.; Sarbu, M.I.; Matei, C.; Ilie, M.A.; Caruntu, C.; Constantin, C.; Neagu, M.; Tampa, M. Capsaicin: Friend or Foe in
Skin Cancer and Other Related Malignancies? Nutrients 2017, 9, 1365. [CrossRef]
26. Pabalan, N.; Jarjanazi, H.; Ozcelik, H. The impact of capsaicin intake on risk of developing gastric cancers: A meta-analysis. J.
Gastrointest. Cancer 2014, 45, 334–341. [CrossRef]
27. Cho, H.; Kwon, Y. Development of a database of capsaicinoid contents in foods commonly consumed in Korea. Food Sci. Nutr.
2020, 8, 4611–4624. [CrossRef] [PubMed]
28. Kweon, S.; Kim, Y.; Jang, M.J.; Kim, Y.; Kim, K.; Choi, S.; Chun, C.; Khang, Y.H.; Oh, K. Data resource profile: The Korea National
Health and Nutrition Examination Survey (KNHANES). Int. J. Epidemiol. 2014, 43, 69–77. [CrossRef]
29. Kwon, Y. Estimation of curcumin intake in Korea based on the Korea National Health and Nutrition Examination Survey
(2008–2012). Nutr. Res. Pract. 2014, 8, 589–594. [CrossRef]
30. National Institute of Horticultural and Herbal Science Major Horticulture Statistics. Available online: https://www.nihhs.go.kr/
farmer/statistics/statistics.do?t_cd=0202 (accessed on 3 April 2021).
31. Kim, S.Y.; Park, G.M. Relationship between red pepper intake, capsaicin threshold, nutrient intake, and anthropometric measure-
ments in young korean women. Korean J. Nutr. 2005, 38, 76–81.
32. Choo, Y.S.; Kwon, H.J. Capsaicin intake estimated by urinary metabolites as biomarkers. Korean J. Food Sci. Technol. 2001, 66,
784–788.
33. Scientific Committee on Food Opinion of the Scientific Committee on Food on Capsaicin; European Commission Health & Consumer
Protection Directorate-General: Brussel, Belgium, 2002.
34. Tremblay, A.; Arguin, H.; Panahi, S. Capsaicinoids: A spicy solution to the management of obesity? Int. J. Obes. 2016, 40,
1198–1204. [CrossRef]
35. Yoshioka, M.; Doucet, E.; Drapeau, V.; Dionne, I.; Tremblay, A. Combined effects of red pepper and caffeine consumption on 24 h
energy balance in subjects given free access to foods. Br. J. Nutr. 2001, 85, 203–211. [CrossRef]
36. Ludy, M.J.; Mattes, R.D. The effects of hedonically acceptable red pepper doses on thermogenesis and appetite. Physiol. Behav.
2011, 102, 251–258. [CrossRef] [PubMed]
37. Sun, D.J.Y.; Lv, J.; Chen, W.; Li, S.X.; Guo, Y.; Bian, Z.; Yu, C.Q.; Zhou, H.Y.; Tan, Y.L.; Chen, J.S.; et al. Spicy food consumption is
associated with adiposity measures among half a million Chinese people: The China Kadoorie Biobank study. Bmc. Public Health
2014, 14, 1–10. [CrossRef]
38. Yoshioka, M.; Lim, K.; Kikuzato, S.; Kiyonaga, A.; Tanaka, H.; Shindo, M.; Suzuki, M. Effects of red-pepper diet on the energy
metabolism in men. J. Nutr. Sci. Vitam. 1995, 41, 647–656. [CrossRef] [PubMed]
39. Janssens, P.L.; Hursel, R.; Martens, E.A.; Westerterp-Plantenga, M.S. Acute effects of capsaicin on energy expenditure and fat
oxidation in negative energy balance. PLoS ONE 2013, 8, e67786. [CrossRef]
40. Schwarz, N.A.; Spillane, M.; La Bounty, P.; Grandjean, P.W.; Leutholtz, B.; Willoughby, D.S. Capsaicin and evodiamine ingestion
does not augment energy expenditure and fat oxidation at rest or after moderately-intense exercise. Nutr. Res. 2013, 33, 1034–1042.
[CrossRef] [PubMed]
41. Smeets, A.J.; Westerterp-Plantenga, M.S. The acute effects of a lunch containing capsaicin on energy and substrate utilisation,
hormones, and satiety. Eur. J. Nutr. 2009, 48, 229–234. [CrossRef]
42. Ahuja, K.D.; Robertson, I.K.; Geraghty, D.P.; Ball, M.J. The effect of 4-week chilli supplementation on metabolic and arterial
function in humans. Eur. J. Clin. Nutr. 2007, 61, 326–333. [CrossRef]
43. Rogers, J.; Urbina, S.L.; Taylor, L.W.; Wilborn, C.D.; Purpura, M.; Jager, R.; Juturu, V. Capsaicinoids supplementation decreases
percent body fat and fat mass: Adjustment using covariates in a post hoc analysis. BMC Obes. 2018, 5, 22. [CrossRef]
44. Kroff, J.; Hume, D.J.; Pienaar, P.; Tucker, R.; Lambert, E.V.; Rae, D.E. The metabolic effects of a commercially available chicken
peri-peri (African bird’s eye chilli) meal in overweight individuals. Brit. J. Nutr. 2017, 117, 635–644. [CrossRef]
45. Zhong, B.H.; Ma, S.T.; Wang, D.H. TRPV1 Mediates Glucose-induced Insulin Secretion Through Releasing Neuropeptides. Vivo
2019, 33, 1431–1437. [CrossRef] [PubMed]
46. Graham, D.Y.; Smith, J.L.; Opekun, A.R. Spicy food and the stomach. Evaluation by videoendoscopy. JAMA 1988, 260, 3473–3475.
[CrossRef]Nutrients 2021, 13, 2461 16 of 16
47. Rodriguez-Stanley, S.; Collings, K.L.; Robinson, M.; Owen, W.; Miner, P.B., Jr. The effects of capsaicin on reflux, gastric emptying
and dyspepsia. Aliment. Pharm. 2000, 14, 129–134. [CrossRef] [PubMed]
48. Yi, C.H.; Lei, W.Y.; Hung, J.S.; Liu, T.T.; Chen, C.L.; Pace, F. Influence of capsaicin infusion on secondary peristalsis in patients
with gastroesophageal reflux disease. World J. Gastroenterol. 2016, 22, 10045–10052. [CrossRef] [PubMed]
49. Chen, C.L.; Liu, T.T.; Yi, C.H.; Orr, W.C. Effects of capsaicin-containing red pepper sauce suspension on esophageal secondary
peristalsis in humans. Neurogastroenterol. Motil. 2010, 22, 1177-e313. [CrossRef] [PubMed]
50. Patcharatrakul, T.; Kriengkirakul, C.; Chaiwatanarat, T.; Gonlachanvit, S. Acute Effects of Red Chili, a Natural Capsaicin Receptor
Agonist, on Gastric Accommodation and Upper Gastrointestinal Symptoms in Healthy Volunteers and Gastroesophageal Reflux
Disease Patients. Nutrients 2020, 12, 3740. [CrossRef] [PubMed]
51. Milke, P.; Diaz, A.; Valdovinos, M.A.; Moran, S. Gastroesophageal reflux in healthy subjects induced by two different species of
chilli (Capsicum annum). Dig. Dis. 2006, 24, 184–188. [CrossRef]
52. (BfR), G.F.I.f.R.A. Too Hot Isn’t Healthy-Foods with Very High Capsaicin Concentrations Can Damage Health; German Federal Institute
for Risk Assessment: Berlin, Germany, 2011.
53. Lopez-Carrillo, L.; Lopez-Cervantes, M.; Robles-Diaz, G.; Ramirez-Espitia, A.; Mohar-Betancourt, A.; Meneses-Garcia, A.;
Lopez-Vidal, Y.; Blair, A. Capsaicin consumption, Helicobacter pylori positivity and gastric cancer in Mexico. Int. J. Cancer 2003,
106, 277–282. [CrossRef]
54. Buiatti, E.; Palli, D.; Decarli, A.; Amadori, D.; Avellini, C.; Bianchi, S.; Biserni, R.; Cipriani, F.; Cocco, P.; Giacosa, A.; et al. A
case-control study of gastric cancer and diet in Italy. Int. J. Cancer 1989, 44, 611–616. [CrossRef] [PubMed]
55. Buiatti, E.; Palli, D.; Bianchi, S.; Decarli, A.; Amadori, D.; Avellini, C.; Cipriani, F.; Cocco, P.; Giacosa, A.; Lorenzini, L.; et al.
A case-control study of gastric cancer and diet in Italy. III. Risk patterns by histologic type. Int. J. Cancer 1991, 48, 369–374.
[CrossRef] [PubMed]
56. Kim, H.J.; Chang, W.K.; Kim, M.K.; Lee, S.S.; Choi, B.Y. Dietary factors and gastric cancer in Korea: A case-control study. Int. J.
Cancer 2002, 97, 531–535. [CrossRef] [PubMed]You can also read