ENHANCING CANADA'S CLIMATE COMMITMENTS: BUILDING ON THE PAN-CANADIAN FRAMEWORK
←
→
Page content transcription
If your browser does not render page correctly, please read the page content below
ENHANCING CANADA’S CLIMATE
COMMITMENTS: BUILDING ON THE PAN-
CANADIAN FRAMEWORK
BY JEFFREY RISSMAN, ROBBIE ORVIS, BRIANNE RIEHL, BENJAMIN ISRAËL, BORA PLUMPTRE ● MARCH
2018
Note: This report was written using Canada EPS version 1.3.2, which has been subsequently updated. Visit
https://policysolutions.pembina.org/ to explore results using the most up-to-date version of the model.
Version history records can be accessed here.
To help achieve Canada’s greenhouse gas reduction goals, the Canadian government proposed the Pan-
Canadian Framework (PCF), an ambitious set of policies to reduce carbon pollution. The PCF includes a
price on carbon emissions, policies to improve vehicle efficiency and vehicle electrification, reducing
methane and refrigerant emissions from industry, and more.
The Pembina Institute and Energy Innovation collaborated to create the Canada Energy Policy Simulator,
a versatile, free and open-source computer model evaluating the impacts of 50 policies on pollutant
emissions, cash flows, human lives saved, and more. Our analysis finds that even if the PCF is fully
implemented, 2030 emissions will exceed Canada’s goal by 161 million metric tons (MMT), a gap 3.7
times larger than the 44 MMT shortfall predicted by Canada’s government. Extending and strengthening
PCF policies would allow Canada to come much closer to its target, save money, and save human lives.

THE PAN-CANADIAN FRAMEWORK
As part of the Paris Climate Accord adopted in 2015, Canada committed to reduce its greenhouse gas
emissions 30 percent below 2005 levels by 2030. To help achieve Canada’s greenhouse gas reduction
goals, the Canadian government proposed the Pan-Canadian Framework, an ambitious set of policies to
reduce greenhouse gas emissions while strengthening the economy and promoting climate change
resilience. The PCF includes a price on carbon emissions, policies to improve vehicle efficiency and
vehicle electrification, reduction of methane and refrigerant (F-gas) emissions from industry, and more.
Although the PCF is a step in the right direction, it will be insufficient to meet Canada’s commitment to
the Paris agreement without further increases to the Framework’s post-2022 level of ambition. In 2017,
the Canadian government estimated the PCF will fall short by roughly 44 MMT of carbon dioxide
equivalent (CO2e) in 2030. The government suggests the gap can be filled with measures including public
transit investment, research & development (R&D), and carbon storage such as reforestation.

THE CANADA ENERGY POLICY SIMULATOR
Between the PCF and other measures, Canada could utilize dozens of policies to reduce emissions. Many
of these policies would interact with one-another, so a policy package would produce different effects in
                                                                                                           2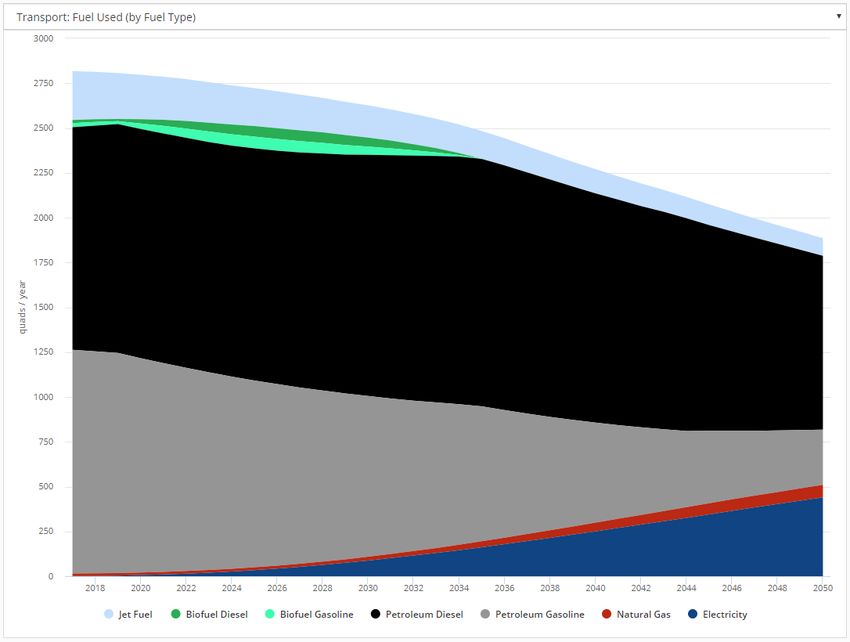
aggregate than simply adding its individual parts.
Canada has need of a free, publicly-available computer model to evaluate policy impacts and allow NGOs
and the public to understand the effects of policy proposals and craft recommendations for government.
Much analysis in Canada has been done with proprietary programs: For example, the government’s PCF
emissions reductions projections were made with computer tools and data that were never made public,
making it impossible to verify the assumptions, methodology, or accuracy of the government’s findings.
Canadian energy policy NGO Pembina Institute partnered with U.S. policy firm Energy Innovation to
develop the Canada Energy Policy Simulator (EPS), a state-of-the-art computer model for understanding
policy impacts. The simulator projects policy effects on emissions of 12 different pollutants, financial
costs and savings, human lives saved, power plants, electric vehicles, and more.
The tool has been peer reviewed by staff at three U.S. national laboratories and several top research
universities, and versions of the EPS exist for several other countries, covering 46 percent of global
emissions. One version, made in partnership with China’s central government, was used by China’s
government to help identify emissions-reducing policies to include in China’s 13th Five-Year Plan. The
Canada EPS brings free, cutting-edge policy analysis capabilities to everyone in Canada.

POLICY SCENARIOS FOR CANADA
Three scenarios were created in the Canada EPS:
•   The Business as Usual (BAU) scenario represents the future trajectory of greenhouse gas emissions
    based on input data from early 2016, including Canada’s Energy Future 2016, the latest data that
    exclude the effects of the PCF policies.
•   The PCF scenario represents the emissions trajectory to be expected when including the policies
    already announced as part of the PCF, including carbon pricing, methane and refrigerant (F-gas)
    emissions reductions from industry, phasing out coal by 2030, the federal clean fuel standard, and
    others. The PCF scenario includes no assumed improvement beyond what has already been
    announced. For example, the “Carbon Tax” policy increases from $10/tonne in 2018 to $50/tonne in
    2022, then holds constant at $50/tonne thereafter.
•   The PCF Extended to Mid-Century scenario increases the PCF’s ambition by assuming that PCF policies
    do not stagnate at their announced end dates. Rather, they strengthen at a constant rate through
    2050 (or until all potential is realized, whichever comes first). For example, the “Carbon Tax” policy
    increases at the same rate of $10/tonne per year from $10/tonne in 2018 to $330/tonne in 2050.
Figure 1 shows Canada’s projected CO2e emissions under each of these scenarios, along with two goals
Canada has announced. Under the Paris Climate Accord, Canada committed to reduce greenhouse gas
emissions 30 percent below 2005 levels by 2030. And in its Long-Term Low Greenhouse Gas Strategy
submitted to the U.N. Framework Convention on Climate Change in November 2016, Canada outlined
four deep decarbonization scenarios, which achieved greenhouse gas reductions of 80 to 90 percent
below 2005 levels by 2050.

                                                                                                        3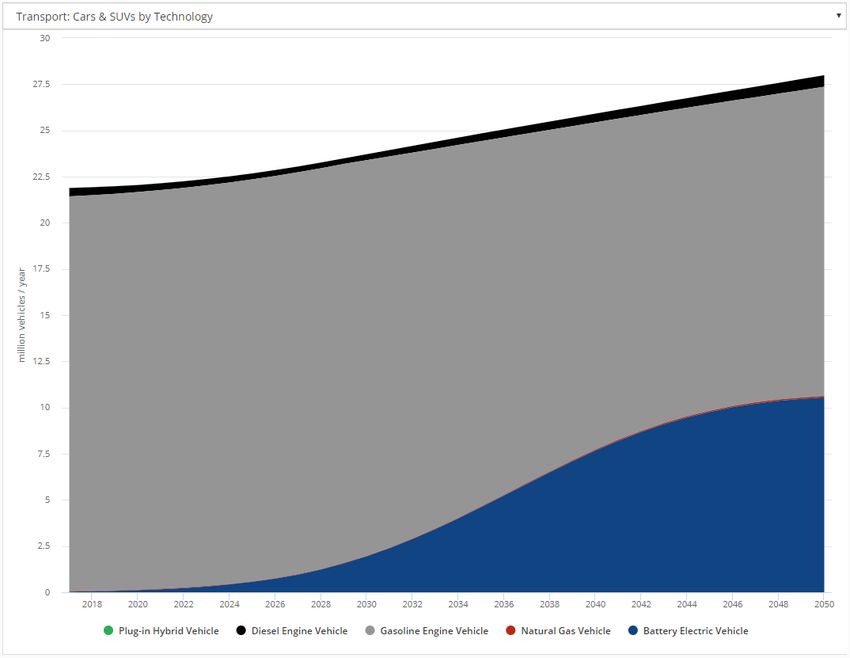
Figure 1: Canada’s greenhouse gas emissions under each policy scenario 1

CANADA’S BUSINESS-AS-USUAL PROJECTIONS
In Canada’s BAU future, most CO2e emissions are projected to come from industry, as shown in Figure 2.
Only about 45 percent of industry sector emissions come from energy use; the remainder are process
emissions (any non-combustion source of greenhouse gas emissions, such as methane leaks from natural
gas and petroleum systems, CO2 from carbonate rock released during cement production, chemicals that
leak from refrigerators and air conditioners, etc.).
Figure 2 shows that transportation is the second highest-emitting sector. Buildings and electricity are
similar in magnitude, and land use is responsible for a small amount of net sequestration of carbon each
year.

1
 The 2030 target in Figure 1 (506 MMT) slightly differs from its value in Canada’s submission to the UN Framework
Commission on Climate Change (523 MMT). This is because the Canada Energy Policy Simulator uses updated global
warming potentials for non-CO2 greenhouse gases from the Fifth Assessment Report from the International Panel on
Climate Change, and the simulator includes certain types of emissions and sequestration – from bunker fuels, land
use change, biomass fuels, etc. – that were not included or were handled differently in the government’s analysis.
The target in Figure 1 is identical to the government’s target after accounting for these methodological differences.
                                                                                                                  4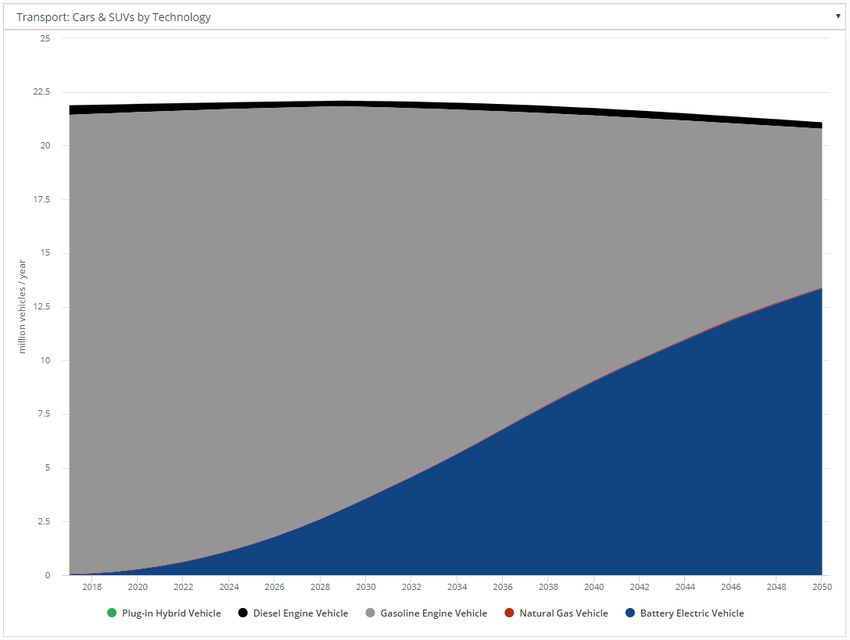
Figure 2: Canada’s BAU greenhouse gas emissions by sector

Canada is unusual among countries in the extent to which national electricity needs are met with
hydroelectric power. Figure 3 shows projected electricity generation will remain dominated by
hydropower through 2050, with a slowly increasing role for natural gas and renewables, and a slow
decline in coal. Due to Canada’s heavy reliance on hydropower, the electricity sector is already heavily
decarbonized at a national level and cannot significantly contribute to emissions reductions by itself.
However, certain provincial electricity systems are still highly carbon-intensive and can continue to
decarbonize through a coal phase-out.

                                                                                                           5
Figure 3: Canada’s BAU electricity generation by type
In the transportation sector, electric vehicles (EVs) are projected to gain in market share through 2050,
but without policies to support EV deployment, the penetration rate for light-duty passenger vehicles is
only expected to reach 38 percent in 2050, as shown in Figure 4.
6Figure 4: Canada’s BAU light-duty passenger vehicle fleet by technology
Due to the large industry and transportation sector contributions to Canada’s greenhouse gas emissions,
its targets can only be achieved with an outsized contribution of abatement from these two sectors.
THE PCF SCENARIO
The PCF scenario includes a dozen policies, including a national carbon tax, clean fuel standard (for
industry, transportation, and buildings), policies to boost electric vehicle sales, building energy efficiency
standards, methane capture in industry, and eliminating existing fossil fuel subsidies. The Canada EPS can
calculate the contribution of individual policies within a policy package to the overall abatement achieved
by that package and display the policies as colored wedges. Figure 5 shows abatement from the PCF
package broken out by policy. The upper edge of the colored area is the BAU projection, while the lower
edge is the projection under the PCF.
7Figure 5: Emissions abatement under the PCF broken out by policy
As shown in Figure 5, PCF scenario emissions are higher than Canada’s goal by 161 MMT. This gap is 3.7
times larger than the 44 MMT shortfall predicted by Canada’s government. Stronger policy, or additional
policies, will be necessary to achieve Canada’s commitments under the Paris Climate Accord.
The most effective policies within the PCF for reducing emissions by 2030 are the carbon tax and
methane capture and destruction. Together, these two policies are responsible for 73 percent of total
abatement in 2030. By 2050, energy-efficient building standards also become very important. (Due to
the long lifetime and slow turn-over of buildings, the benefits of improved building codes often take many
years to be realized.)
Policies can also be displayed as a cost curve (Figure 6). In this case, each policy is represented as a
rectangle. The rectangle width is the average annual abatement caused by that policy through 2050. The
rectangle height is the policy’s cost-effectiveness, in dollars per tonne CO2e abated. Rectangles below the
X-axis have negative costs (save money), while rectangles above the X-axis cost money.
The most cost-effective emissions abatement policies are transportation demand management (policies
to encourage walking, biking, public transit, etc.), energy-efficient building codes, an EV sales mandate,
and early retirement of coal power plants. Building codes, methane capture and destruction, and the
carbon tax all provide a good blend of high pollution abatement and low or negative costs.
8Figure 6: Abatement cost curve through 2050 for policies under the PCF
THE PCF EXTENDED TO MID-CENTURY SCENARIO
The PCF Extended to Mid-Century scenario uses the same dozen policies as the PCF scenario but
strengthens their values, as described above. Although all policies are strengthened relative to the PCF,
the carbon tax is increased by a particularly large amount. Under the PCF, the carbon tax reaches $50 per
tonne in 2022 and holds constant thereafter, while in PCF Extended, the carbon tax continues to increase
at $10 per year until it reaches $330 per tonne in 2050. The result is a policy package in which most
abatement is provided by the carbon tax (Figure 7).
9Figure 7: Emissions abatement under the PCF Extended scenario broken out by policy
As was the case for the PCF, the PCF Extended scenario’s most cost-effective policies are transportation
demand management, energy-efficient building codes, vehicle electrification or an EV sales mandate, and
early coal power plant retirements. The carbon tax, which does most of the work when it comes to
pollution abatement, has an overall negative financial cost to society (Figure 8). In other words, a carbon
tax provides overall economic savings or benefits to society.
10Figure 8: Abatement cost curve through 2050 for policies under the PCF Extended scenario
The PCF Extended scenario is very effective at increasing electric vehicle penetration, even as it reduces
overall demand for travel in light-duty on-road passenger vehicles, as shown in Figure 9. By 2050, this
scenario projects fewer than 22 million cars on the roads (compared to 28 million in the BAU case), and
60 percent of them will be battery EVs (compared to 38 percent in the BAU case).
11Figure 9: Canada’s light-duty passenger vehicle fleet by technology under the PCF Extended scenario
SAVINGS AND COST COMPARISONS
The PCF and PCF Extended scenarios save money over the longer term, providing a clear illustration of
the compatibility of climate change goals and economic development. Figure 10 shows the change in
capital and operational expenditures, relative to BAU, under each of the two scenarios. Both packages
exhibit the pattern of costs in early years (as the policies cause people and businesses to invest in new
technologies, efficiency upgrades, and so forth) and savings in later years (once the cumulative fuel
savings outweigh the costs of the capital upgrades).
Figure 10 does not take output-based allocations or other uses of the carbon tax revenues into account;
carbon taxes paid are treated as pure expenditures. (See Figure 11 for the alternative approach.) Even
given this unfavorable treatment, annual savings balance out costs in the PCF policy package by 2037 and
in the PCF Extended package by 2031. By 2050, the PCF policy package is saving about $25 billion per
year, and the PCF Extended package is saving about $95 billion per year.
12Figure 10: Changes in Capital and Operational Expenditures under the PCF and PCF Extended scenarios (with no
revenue use assumption)
Figure 11 illustrates the same cost data as Figure 10, but it assumes that the carbon tax revenues are
returned to society (through output-based allocations, direct payments, reduction of other taxes, and so
forth). The PCF Extended package, which is dominated by its high carbon tax, now saves money from day
one. The PCF package’s annual savings now balance its costs by 2032, instead of 2037 (from Figure 10).
By 2050, the PCF package saves $45 billion per year, and the PCF Extended package saves more than
$150 billion per year.
13Figure 11: Changes in Capital and Operational Expenditures under the PCF and PCF Extended scenarios (with
revenue-neutral carbon tax)
The Canada EPS can estimate the number of human lives saved (technically, the reduction in the death
rate) due to reductions in particulate matter emissions. Figure 12 shows that under the PCF package,
Canada will have 2,700 fewer deaths per year, relative to the BAU case. The PCF Extended package will
reduce annual deaths by 4,600 in 2050.2
2
The drop in the curves in Figure 12 around years 2026-2029 corresponds to a period of significant retirements of
hard coal plants under the BAU scenario. Those coal plants were retired earlier under the PCF and PCF Extended
scenarios, so the BAU retirements reduce the difference between the BAU scenario versus the PCF and PCF
Extended scenarios in those years.
14Figure 12: Human lives saved under the PCF and PCF Extended scenarios (counting only particulate-driven mortality)
HITTING CANADA’S MID-CENTURY DEEP DECARBONIZATION GOAL
Canada’s mid-century goal is to reduce emissions by 80-90 percent relative to 2005 levels. Even the PCF
Extended scenario, the strongest of the modeled scenarios, falls far short of this goal. The Canada EPS
can help provide a guide to where policy should focus in order to further reduce emissions and achieve
the ambitious mid-century target.
Figure 13 shows emissions under the PCF Extended scenario by source type: energy (combustion),
process emissions, and land use. Energy-related emissions are greatly reduced under the PCF Extended
scenario. The decline in process emissions is much more modest and additional efforts to reduce process
emissions will be necessary. The PCF Extended scenario already includes the elimination of methane
leakage from natural gas and petroleum systems and the complete phase-out of F-gases. Further process
emissions reductions may require innovative techniques (for example, developing carbon-neutral
cement, or reducing methane emissions from livestock and soils in agriculture). Additionally, industry
would likely benefit from use of carbon capture and sequestration (CCS) to store process CO2 emissions
that are otherwise difficult to eliminate.
15Figure 13: Canada’s greenhouse gas emissions by type under the PCF Extended scenario
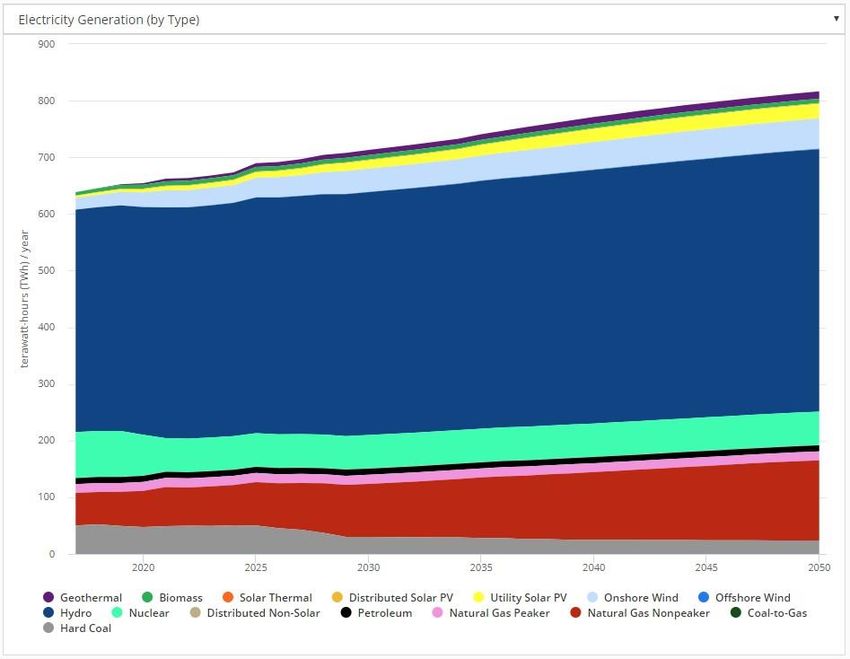
The transportation sector is the largest contributor of energy-related emissions in the PCF Extended
scenario, responsible for 103 MMT (60 percent) of all energy-related emissions in 2050. The
transportation sector is not easy to fully decarbonize. Even under the PCF Extended scenario, which
includes a large increase in EV market share, the majority of transportation sector fuel use comes from
fossil fuels- petroleum gasoline, petroleum diesel, and jet fuel (Figure 14). Canada will need to reduce
petroleum fuel consumption in trucks, rail, and shipping in order to eliminate the largest remaining
segment of energy-related emissions and approach its mid-century goal. Possibilities include
electrification (particularly for rail and some types of trucks), hydrogen derived from electrolysis, or
biofuels that are carbon-neutral on a lifecycle basis.
16Figure 14: Transportation sector fuel use by fuel type under the PCF Extended scenario CONCLUSION Canada should be commended for creating an ambitious policy package – the PCF – which will greatly reduce greenhouse gas emissions relative to a BAU future. However, the PCF as it currently stands will fall short of achieving Canada’s international commitment under the Paris Climate Accord. The shortfall is likely to be roughly 3.7 times larger than the 44 MMT gap estimated by the government. An extension and strengthening of the PCF policies comes close to hitting the 2030 target, but this still falls short of Canada’s mid-century decarbonization goal. Additional attention to reducing process emissions in industry and to decarbonizing the transport sector- especially trucking, rail, and shipping- will be necessary, on top of the PCF Extended policies, to approach the 2050 target. The PCF policy package will save $25 to $45 billion per year by 2050, and the PCF Extended policy package will save $95 to $150 billion per year by 2050, depending on use of carbon tax revenues. Under the PCF package, by 2050, there will be 2,700 fewer deaths per year in Canada, while the PCF Extended package will reduce annual deaths by 4,600. Canada is off to a great start, and opportunities exist to make deeper emissions cuts within the framework of existing policy through promised policy reviews under the PCF in 2020 and 2022. However, with more ambitious policy, Canada can achieve still better environmental, economic, and public health outcomes.
You can also read