Energy Vision A clean energy future for Australia - Transgrid
←
→
Page content transcription
If your browser does not render page correctly, please read the page content below
Energy Vision A clean energy future for Australia
Foreword         Executive summary   Drivers of change     Future energy scenarios       Key trends    Decarbonisation, jobs & costs   Our Vision   Power system implications   Appendix

Contents
Foreword3                                                Our vision                                        33
Executive summary                              4         Which scenarios provide clear long-term
                                                          benefits for Australians?                         35
About Transgrid                                8
                                                          Deep decarbonisation                             36
Drivers of change                              9
Six forces shaping the future of Australia’s              Clean energy superpower                           41
energy system                                  10        Power system implications                        45
Technological advancement                      11        A changing generation mix                        46
The decarbonisation imperative                 12        Varying storage depths                           48
Future energy scenarios                        14        Exponential demand for storage                    47
Scenario comparisons                           15        The role of dispatchable generation              50
Key trends                                     17        Geographically dispersed energy generation        51
Unstoppable transition to renewables           18        An expanded transmission backbone                 59
Early coal retirement is increasingly likely   19        An increasingly variable energy system            61
Rise of the prosumer                           20        The importance of highly coordinated
Surging demand for electricity                 23        distributed resources                             62
Decarbonisation, jobs & costs 24                         The changing patterns of maximum demand          63
Decarbonisation25                                        Declining minimum demands                        64
Electricity sector jobs                        26        Maintaining system security                      65
Electricity prices                             29        Appendix67
                                                          1.1 Our partners 68
                                                          1.2 Summary of assumptions                       69
                                                          1.3 Generation capacity                           70

                                                                                                                                                                                                      Energy Vision
                                                          1.4 Renewable energy zone utilisation             71
                                                          References72

                                                                                                                                                                                                      |
                                                                                                                                                                                                         2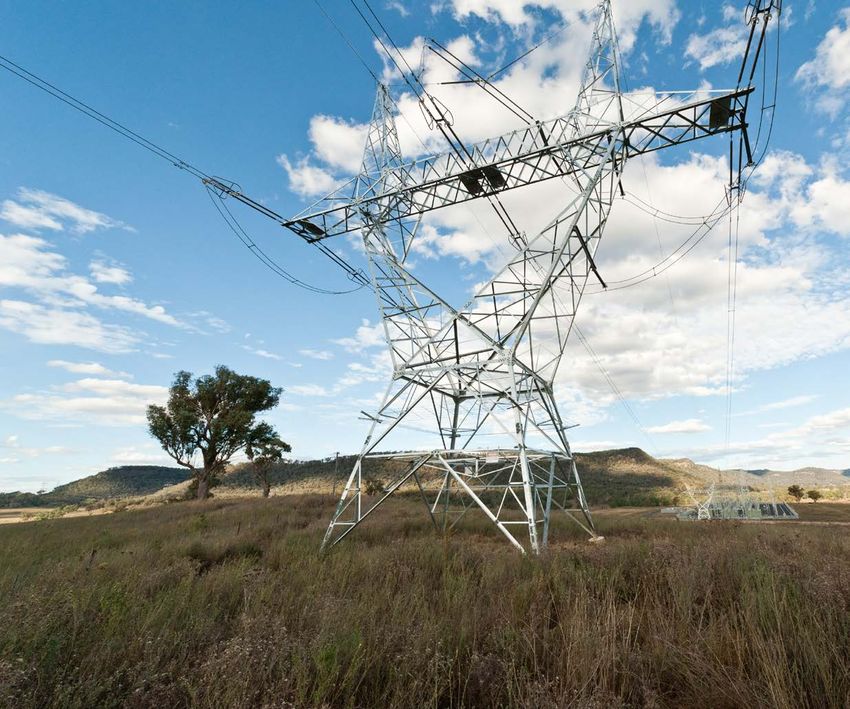
Foreword          Executive summary             Drivers of change       Future energy scenarios          Key trends      Decarbonisation, jobs & costs          Our Vision          Power system implications   Appendix

Foreword

As the world responds to climate change and the cost of renewables plunges,
the transition from a fossil fuel to renewable energy based power system is
unstoppable. During this energy transformation, Australia’s patterns of electricity
supply and demand will change dramatically.

Transgrid is working with a broad range of stakeholders            This Energy Vision explores six possible futures for our       Our modelling shows that this future is achievable. But to
to plan for this future energy landscape, including State          energy system over the coming 30 years to 2050. The            realise this potential, the pace of change needs to rapidly
and Federal Governments, the Australian Energy Market              scenarios range from a future based on current trends, to      accelerate. There is no time to waste.
Operator (AEMO) and transmission and distribution                  a backwards-looking sharp slump in Australia’s economic
                                                                                                                                  This Energy Vision sets out the least cost evolution of the
network service providers.                                         growth, to more optimistic scenarios in which Australia hits
                                                                                                                                  energy system under a range of possible future scenarios
                                                                   the Paris Agreement’s aspirational 1.5°C decarbonisation
Transmission will be central to Australia’s successful                                                                            and presents an evidence-based vision for a future that
                                                                   target and becomes a global, clean energy superpower.
transition to a clean energy future. Decarbonisation,                                                                             provides clear long-term benefits for Australians.
electrification and new green industries will require a            Each scenario is underpinned by detailed modelling to
                                                                                                                                  We trust these insights will support energy system
significant expansion of renewable generation, storage and         assess the implications and opportunities of emerging
                                                                                                                                  stakeholders in formulating the policies, reforms and
associated transmission infrastructure. We need to achieve         technologies, trends and policies on the development
                                                                                                                                  investments required to enable the rapid and orderly
the biggest energy transformation of our lifetime without          and operation of Australia’s energy system. We have also
                                                                                                                                  decarbonisation of our energy system and to build
sacrificing the grid security and reliability to which we have     assessed the implications of each scenario on Australia’s
                                                                                                                                  Australia the energy system we need to thrive in a clean
become accustomed.                                                 decarbonisation trajectory, the creation of electricity
                                                                                                                                  energy future.
                                                                   sector jobs and the impact on market and consumer
To better understand what our energy future could look
                                                                   electricity prices.                                            Jerry Maycock
like, Transgrid has partnered with independent experts,
                                                                                                                                  Chair of Transgrid
CSIRO, ClimateWorks Australia and The Brattle Group                Our analysis indicates that the transition towards a clean
                                                                                                                                  October 2021
to model the implications of a range of scenarios on the           energy future can create immense opportunity for Australia
evolution of our energy system. This detailed scenario             if we set ourselves on the optimal course – a course that
modelling guides our long-term planning, helping to                will support not just decarbonisation, but also job creation

                                                                                                                                                                                                                                       Energy Vision
ensure our network is robust, resilient and flexible to future     and economic growth.
challenges and opportunities.

                                                                                                                                                                                                                                       |
                                                                                                                                                                                                                                          3
Foreword         Executive summary           Drivers of change                 Future energy scenarios        Key trends   Decarbonisation, jobs & costs       Our Vision   Power system implications       Appendix

Executive summary
Australia’s energy system is undergoing a once in a-lifetime                                               In partnership with independent experts, CSIRO, ClimateWorks
transformation. This Energy Vision provides evidence‑based,                                                Australia and The Brattle Group, we have developed and modelled
data‑driven insights into what that transformation could look like                                         six possible futures for Australia’s energy system to 2050.
over the next 30 years. By planning for a diverse range of future
scenarios, we can ensure our energy system is robust, resilient and
flexible, as we navigate the challenges and opportunities ahead.

Six scenarios for the future
Figure 1: Comparing scenarios against their level of decarbonisation, decentralisation and the underlying electricity consumption in 2050 (represented by the size of the bubble)
                                                               Highly decentralised

     Current trends                                                                                                                                                                                      Prosumer power
                                                                                                                         Prosumer
     Ageing coal power stations are replaced with                                                                        power                                                                           Consumer choices and technology advancement drive
     competitively priced large and small‑scale renewables                                                                                                                                               a very high penetration of well-coordinated distributed
     and storage                                                                                        States go                                                                                        energy resources into the system
                                                                                                        it alone

     States go it alone                                                                                                                                                                                  Deep decarbonisation
                                                                                                               De‑industrialisation
     A breakdown of National Electricity Market (NEM)                                                          death spiral                   Deep decarbonisation                                       Market forces, international and domestic politics and
     regulations sees a siloed approach from the states,                                                                                                                                                 consumer expectations drive a huge reduction in carbon
     which establish their own policies and local energy                              Current                                                                                                            emissions across all sectors of our economy. Australia
     solutions. A regulatory impasse prevents new interstate                          trends                                                                                                             commits to limit global warming to 1.5°C, in line with the
     transmission developments from proceeding                                                                                                                                                           aspirations of the Paris Agreement
                                                                                                                    Clean energy

                                                                                                                                                                                                                                                                      Energy Vision
     De-industrialisation death spiral                                                                               superpower                                                                          Clean energy superpower
     A global economic downturn causes Australia’s                                                                                                                                                       Australia leverages its abundant renewable energy
     economic growth to slump, particularly impacting                                                                                                                                                    resources and mineral ores to become a global clean
     the industrial sector                                                                                                                                            Strong decarbonisation             energy superpower, exporting green hydrogen and

                                                                                                                                                                                                                                                                      |
                                                                                                                                                                                                         metals to the world
                                                                                                                                                                                                                                                                         4
Foreword             Executive summary                 Drivers of change         Future energy scenarios               Key trends           Decarbonisation, jobs & costs          Our Vision         Power system implications          Appendix

Executive summary

Seven key insights
Our analysis has identified seven key insights for the future of Australia’s energy system.

   The transition to renewables is unstoppable                                   The power system will play a central role in                                  The transmission system is a key enabler of
                                                                                 achieving economy-wide decarbonisation                                        Australia’s energy transformation                                    “A decarbonised power sector, dominated
   – The findings are clear – the transition towards a clean
     energy future is unstoppable.                                               – The electricity system will play a central role in supporting               – Surging demand for electricity, an influx of geographically         by renewable sources, is at the core of
   – In all scenarios examined, renewable energy supplies the                      Australia’s decarbonisation, underpinned by a rapid                           diverse renewable energy generation and an increasingly             the transition to a sustainable energy
     majority of the NEM’s electricity needs by 2050. In five out                  transition to renewable energy and the electrification of                     important role for energy storage will reshape our                  future”
     of the six scenarios, renewable energy supplies more than                     road transport, industry and buildings.                                       energy system, requiring a significant expansion of the
                                                                                                                                                                                                                                      IRENA, 2018, Global Energy Transformation: A roadmap to 2050
     70% of the NEM’s annual energy needs by 2035 and more                       – If the vast majority of Australia’s vehicle fleet is electrified, as          transmission network.
     than 90% by 2050.                                                             in Deep decarbonisation, almost 100TWh/year of energy                       – The role of the transmission system remains crucial in
   – The economic viability of Australia’s coal generators is                      demand could be added to the NEM by 2050, equivalent to                       all scenarios, moving 73-95% of all electricity consumed
     being challenged by the influx of renewables. Our analysis                    half of the NEM’s current annual demand. In this scenario,                    in the NEM in 2050 from largescale generators to
                                                                                   the electrification of industry and buildings is projected to                 distributors and large customers, even in scenarios with           “Spreading the use of electricity into
     indicates that, by 2030, with decarbonisation objectives
     aligned to a 1.5°C temperature trajectory, as much as                         add another 40TWh/year by 2050.                                               exceptionally high rooftop solar uptake.                            more parts of the economy is the single
     18GW of coal capacity could be withdrawn from the NEM                       – Electricity generation currently accounts for 33% of                        – New interstate transmission interconnection will be critical        largest contributor to reaching net‑zero
     – 13GW more than currently anticipated 1.                                     Australia’s greenhouse gas emissions a. Under our business                    to maintain the sharing of low-cost, secure and reliable            emissions”
   – The likely early retirement of coal generators highlights                     as usual Current trends trajectory, the NEM’s electricity                     electricity between states, providing $20 billion in savings
                                                                                                                                                                                                                                     International Energy Agency, 2020, Energy Technology
     the critical need for an orderly, planned and just transition                 system is projected to reduce its emissions 93% by 2050,                      to the energy system by 2050.
                                                                                                                                                                                                                                     Perspectives
     from coal, ensuring the energy system remains reliable,                       while the remainder of the economy only sees a 7%                           – Modelling suggests that 25GW of new inter-regional
     secure and affordable.                                                        reduction in emissions.                                                       transmission is required NEM-wide by 2050 in Current
                                                                                 – To facilitate the Deep decarbonisation of Australia’s                         trends and 47GW in Deep decarbonisation, to support
                                                                                   economy, the electricity system is fully decarbonised by                      the least cost evolution of our energy system.
                                                                                   2035. The remainder of the economy achieves an 87%
                                                                                   reduction in emissions by 2050.
                                                                                 – In our business as usual Current trends scenario, we

                                                                                                                                                                                                                                                                                                     Energy Vision
                                                                                   project 108GW of largescale wind, solar photovoltaics (PV)
                                                                                   and rooftop solar capacity is required in the NEM by 2050.
                                                                                   This increases to 159GW in Deep decarbonisation, and
1. Based on announced retirement dates for coal generators, or at the end of       417GW in Clean energy superpower.
   their technical life, as recorded by AEMO.

                                                                                                                                                                                                                                                                                                     |
                                                                                                                                                                                                                                                                                                        5
Foreword          Executive summary            Drivers of change       Future energy scenarios            Key trends         Decarbonisation, jobs & costs          Our Vision         Power system implications        Appendix

Executive summary

Seven key insights

  Distributed energy technologies and increasingly                    Australia has a unique opportunity to harness                          Becoming a clean energy leader provides clear                           A new suite of technologies, services and
  sophisticated consumers will play a key role in                     its abundant renewable energy resources to                             long‑term benefits for Australians                                      products will be required to maintain safe,
  Australia’s future energy system                                    become a global, clean energy leader                                   – Efforts to support domestic and global decarbonisation will           reliable and secure power system operations
  – Rooftop solar capacity is projected to surge in the coming        – Australia’s abundant renewable energy resources, large                 supercharge our economy, drive local job creation and lower           as the energy system transforms
    decades, increasing 3-9 times in the NEM, possibly to as            landmass, significant mineral ores and good access to                  energy costs for Australians.                                         – Maintaining power system security will become
    high as 82GW by 2050.                                               Asian markets could set us up to become a Clean energy               – A Deep decarbonisation of the Australian economy supports               increasingly complex as the energy system
  – Distributed batteries in Virtual Power Plants and                   superpower, exporting zero-emissions green hydrogen,                   41,000 electricity sector jobs across the NEM this decade, 45%          transforms.
    electric vehicles with Vehicle-to-Grid technology could             metals, and other products and services to the world.                  more than in our business as usual future (Current trends).           – Demand response, largescale storage, aggregated
    provide 30% of the NEM’s storage requirements in                  – As the cost of producing hydrogen from electrolysis                  – A Clean energy superpower future supports 68,000 electricity            behind-the-meter batteries, flexible hydrogen
    Deep decarbonisation and up to 80% in Prosumer power.               falls, our modelling projects that renewable electricity               sector jobs on average from 2030-50, more than twice the level          electrolysis, and electric vehicles with Vehicle-to-Grid
                                                                        becomes the dominant energy source for Australian                      of jobs projected in Current trends.                                    technology are likely to become increasingly critical
  – The electricity sector must evolve to meet changing
    consumer expectations and leverage new distributed                  hydrogen production, representing 94% of total hydrogen              – Modelling suggests a significant proportion of new renewable            to help balance our energy system.
                                                                        production in 2050.                                                    energy and downstream hydrogen and green steel production             – Modelling projects that 18GW of dispatchable storage
    energy resource capabilities to support the ongoing
                                                                                                                                               jobs will be created in regional areas in Clean energy
    stability of the electricity system.                              – With appropriate support, the levelised cost of green                                                                                          capacity is required by 2050 in Current trends, and
                                                                                                                                               superpower, many in similar locations to where existing coal
                                                                        hydrogen is projected to fall below $2/kg in the early 2030s,          industries are located, such as the Hunter Valley in NSW.               33GW in Deep decarbonisation.
                                                                        reaching $1/kg by 2050 at major hydrogen producing                                                                                           – Grid forming inverters are projected to play a crucial
                                                                        locations on the south and east coast of Australia.                  – Our modelling shows these regions can be at the forefront of
                                                                                                                                               Australia’s clean energy future. In an orderly transition of the        role in supporting energy security as synchronous
                                                                      – Our modelling projects that QLD dominates the                          energy system, no cohort of workers should be left behind.              generators are withdrawn.
                                                                        production and export of hydrogen and green steel from                 Communities should be provided every opportunity to harness           – Our modelling suggests that inertia and system
                                                                        the 2030s, followed by NSW and WA in the 2040s.                        the full potential of new export industries. Proper planning and        strength ancillary services will represent between
                                                                      – By 2050, North Queensland and the Hunter Valley in NSW                 investment in reskilling and upskilling is required.                    1-3% of total system costs.
                                                                        are projected to produce and export the largest quantities           – A Clean energy superpower future would deliver the lowest             – Australia is already experiencing the effects of climate
                                                                        of hydrogen and green steel in Australia.                              cost of electricity, 12% lower than Current trends over the
                                                                                                                                                                                                                       change. Building a more resilient energy system is a
                                                                                                                                               period 2021-50.
                                                                      – Demand for electricity could surge in a Clean energy                                                                                           critical task for the coming decades.
                                                                        superpower future, increasing the NEM’s electricity                  – The decarbonisation of the Australian economy can deliver
  Efforts to support domestic                                           requirements six times by 2050.                                        lower energy expenditure for residential consumers. Those with
  and global decarbonisation will                                                                                                              a single electric vehicle could be at least $900/year better off

                                                                                                                                                                                                                                                                                  Energy Vision
                                                                                                                                               under a Deep decarbonisation scenario, when considering
  supercharge our economy, drive                                                                                                               expenditure on electricity, rooftop solar, batteries and
  local job creation and lower                                                                                                                 electric vehicles.
  energy costs for Australians.

                                                                                                                                                                                                                                                                                  |
                                                                                                                                                                                                                                                                                     6
Foreword          Executive summary             Drivers of change   Future energy scenarios   Key trends   Decarbonisation, jobs & costs   Our Vision   Power system implications   Appendix

Executive summary

Our vision for Australia’s
energy system
To guide Australia’s energy transition, we
need a clear vision for the future that we can
collectively strive towards.

  Our vision is for Australia to become a global
  clean energy leader, benefitting communities,
  the economy and the environment.

  This vision is centred on three themes: a
  decarbonised economy, a transformed economy
  (with new export sectors) and a resilient
  and affordable energy system.
  – We see optimal advantage for Australia represented
    through a combination of Deep decarbonisation
    (medium-term) and Clean energy superpower (long-
    term). These two scenarios bring together the economic
    and climate benefits captured through proactively
    embracing the energy transition and Australia’s natural
    advantages to become a renewable powerhouse.
  – Our analysis indicates that the transition towards a
    clean energy future can create immense opportunity for

                                                                                                                                                                                                          Energy Vision
    Australia – if we set ourselves on the optimal course. As
    a nation, we have the choice of how we respond to this
    transition, not whether it happens at all.

                                                                                                                                                                                                          |
                                                                                                                                                                                                              7
Foreword Executive summary Drivers of change Future energy scenarios Key trends Decarbonisation, jobs & costs Our Vision Power system implications Appendix
Executive summary
About Transgrid
TransGrid operates and manages the high voltage electricity transmission
network in NSW and the ACT. We offer a range of infrastructure and
telecommunications services to meet the growing needs and expectations
of our customers. Our network connects NSW to Queensland and Victoria,
and forms the backbone of the National Energy Market (NEM).
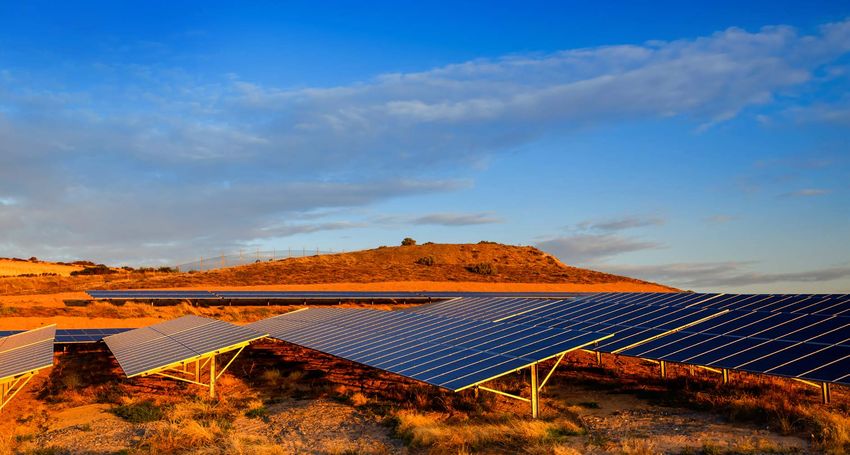
Our network transports electricity from multiple generation
sources, such as wind, solar, hydro, gas and coal power This Energy Vision is underpinned by detailed
plants, to large directly connected industrial customers scenario modelling. Transgrid partnered with
and the distribution networks that deliver it to homes and independent experts, CSIRO, ClimateWorks
businesses. Comprising 119 substations and 13,204 kilometers Australia and The Brattle Group, to model the
of transmission lines and cables and five interconnections to implications of a range of futures for Australia’s
QLD and VIC, the network is instrumental to the electricity
energy system out to 2050.
system and economy and facilitates energy trading between
Australia’s largest states. The Brattle Group facilitated the development
The National Electricity Market (NEM) is currently undergoing of our future energy scenarios. CSIRO and
a period of transition as the generation mix changes to ClimateWorks Australia undertook quantitative Contact details
include more renewables and technology, allowing greater market and system modelling on each scenario.
For all enquiries regarding the Energy Vision
participation from customers in the energy market. We are
and for making written submissions,
working with our customers and stakeholders across the
energy supply chain and decision-making bodies to ensure contact: energyvision@transgrid.com.au
we make a better power system for Australians. © TransGrid 2021.
All rights reserved.
NSW Electricity Networks Operations Pty
Limited (ACN 609 169 959), as trustee for
Energy Vision
NSW Electricity Networks Operations Trust
(ABN 70 250 995 390). Registered business
name is TransGrid (ABN 70 250 995 390).
www.transgrid.com.au
|
8
Foreword    Executive summary   Drivers of change   Future energy scenarios   Key trends   Decarbonisation, jobs & costs   Our Vision   Power system implications   Appendix

Drivers of change
Australia’s energy system is undergoing a
once‑in‑a‑lifetime transformation. Globally, the
way energy is generated, stored, distributed and
consumed is changing at an unprecedented pace.
Six forces are shaping the future of Australia’s
energy system, underpinned by rapid technological
advancements and government actions to
decarbonise their economies.

                                                                                                                                                                                       Energy Vision
                                                                                                                                                                                       |
                                                                                                                                                                                          9
Foreword             Executive summary                Drivers of change              Future energy scenarios                Key trends             Decarbonisation, jobs & costs           Our Vision         Power system implications         Appendix

Drivers of change

Six forces shaping the future of Australia’s energy system
The evolution of Australia’s energy system will be influenced by six forces
– shaped by technological, economic, social and political trends.

   Technology advancement                                The decarbonisation imperative                         Consumer preferences and                             Demand for electricity                           Energy market rules and                    Community expectations
   – Disruptive technological                            – Global emissions reductions are                      decentralisation                                     – Long-term economic conditions                  regulations                                – There are increasing community
     advancement is occurring                              not on track to meet the Paris                       – Consumers are expressing a desire                    are uncertain, including the                   – Rules and regulations built for            expectations to reduce our
     across the energy supply                              Agreement’s 1.5°C aspiration or                        to be more in control of their                       ongoing viability of energy-                     Australia’s legacy energy system           impacts on the environment
     chain, from renewable energy                          2°C goal. A rapid transformation                       energy supply and use, enabled by                    intensive industries in Australia                are in a state of flux. Australia’s      – Disruptions and benefits of
     and storage technologies to                           is required                                            distributed energy resources                       – There is scope for a substantial                 Energy Security Board has been             Australia’s energy transition will
     distributed energy resources and                    – While current progress is                            – Consumers are likely to have                         growth in distributed generation                 tasked with a wholesale redesign           be felt differently by different
     smart-grid capabilities. These                        insufficient, more than three-fifths                   a greater interaction with the                       and energy efficiency, which                     of the NEM by 2025                         communities
     advancements are supported                            of global CO2 emissions are under                      electricity system, through Virtual                  could reduce the demand for grid
     by digitisation, automation and                       net zero emissions targets b                           Power Plants, smart electric                         connected electricity
     artificial intelligence                                                                                      vehicle charging and Vehicle-to-                   – New demand sources are emerging,
   – A combination of innovation and                                                                              Grid technology. These ‘prosumers’                   which may significantly increase
     global deployment is driving                                                                                 will be more sophisticated and                       the demand for electricity, through
     significant cost reductions                                                                                  diverse, not simply ‘price takers’                   the electrification of road transport,
                                                                                                                  from the grid                                        buildings and industry and from
                                                                                                                                                                       electricity-intensive industries,
                                                                                                                                                                       such as green hydrogen 1 and green
                                                                                                                                                                       metal production

                                                                                                                                                                                                                                                                                                        Energy Vision
1. Green hydrogen is the production of hydrogen via electrolysis, powered by renewable energy. Green steel is the production of steel using green hydrogen and
   renewable electricity through a direct reduction process. Green metals and products refer generally to metals and products produced using renewable energy.

                                                                                                                                                                                                                                                                                                        |
                                                                                                                                                                                                                                                                                                        10
Foreword Executive summary Drivers of change Future energy scenarios Key trends Decarbonisation, jobs & costs Our Vision Power system implications Appendix
Drivers of change
Technological advancement
Disruptive technological advancement is occurring across the energy supply chain, from
renewable energy and storage technologies to distributed energy resources and smart-grid
capabilities, leading to rapid cost reductions.
Already, we can see that the transition towards renewables In parallel, everyday Australians have embraced rooftop solar Figure 2: Projections of the levelised cost of energy in Australia for new capacity 1
is unstoppable. Globally, the cost of solar PV has fallen 87% at an unprecedented pace. More than one in four Australian
$500
Levelised cost of energy (A$/MWh, real 2020 dollars)
and wind 63% since 2009, and battery storage has fallen 80% households now have solar panels on their homes h. In 2020
since 2013 c. For projects with low-cost financing that tap alone, 3GW of new capacity was added i, bringing the
high-quality resources, solar PV is now the cheapest source of total Australian residential rooftop solar capacity to more
electricity in history d. than 14GW j. 400
In Australia, the share of electricity generated from coal in Continued technological advancement and energy cost
the NEM has fallen from 78% to 65% since 2010. The share reductions are likely to further reshape the energy system.
of electricity generated from variable renewable energy has The cost of solar PV in Australia is projected to fall a further 300
increased from 2% to 21% over the same period e. 70% by 2050, 50% for wind and 60% for grid batteries k.
By the end of 2020, more than 11GW of largescale wind and
solar PV were deployed and 76 largescale wind and solar The cost of solar PV in Australia is projected 200
PV projects were under construction f. And this is just the to fall a further 70% by 2050, 50% for wind
beginning – 55GW of largescale wind, solar PV and storage and 60% for grid batteries
have been proposed for connection across the NEM g. 100
0
2014 2020 2026 2032 2038 2044 2050
Solar PV Wind Grid battery (4h) Gas (CCGT) Coal Gas (OCGT)
Energy Vision
Globally, the cost of solar PV has fallen 87% and
wind 63% since 2009, and battery storage has
fallen 80% since 2013 1. Shaded area represents the minimum and maximum cost projections, cost converted to Australian dollars with a 2020 average conversion rate of US$1 =
A$0.69. Source: BloombergNEF, 1H 2021, Levelised Cost of Energy Data Viewer.
|
11Foreword Executive summary Drivers of change Future energy scenarios Key trends Decarbonisation, jobs & costs Our Vision Power system implications Appendix
Drivers of change
The decarbonisation imperative
In 2015, as the world woke up to the catastrophic consequences of unchecked
climate change, the Paris Agreement was adopted by 197 parties, including Australia,
representing 97% of global greenhouse gas emissions l. The Paris Agreement is a
legally binding international treaty, with its goal to limit global warming to well below
2°C, preferably to 1.5°C, compared with pre‑industrial levels m.
At the same time, positive community sentiment towards
action on climate change continues to grow. The majority
“Under policies firmly in place, the world
(71%) of Australians agree that we should be world leaders in
finding solutions to climate change n.
is headed for 2.7°C of warming. Even if
countries meet their net-zero targets in
Significantly, all Australian states and territories have full, temperatures would rise 2.1°C”
made commitments to reach net zero emissions by 2050.
Australian businesses are also taking direct action, with 18% International Energy Agency, 2021, Net Zero by 2050
of organisations surveyed committed to net zero by 2050 for
some emissions o.
But, despite the Paris Agreement and mounting efforts by
governments, businesses and consumers to reduce their “Unchecked, climate change could shrink
carbon footprints, the world is not on track to avoid dangerous Australia’s GDP 6% by 2070, at a cost of
climate change. Our current trajectory will lead to catastrophic 880,000 jobs”
warming. We are at “code red for humanity” p. Deloitte Access Economics, 2020, A new choice –
Australia’s climate for growth
Deloitte Access Economics has modelled the impacts of
unchecked climate change on the Australian economy.
The analysis suggests that, by 2070, Australia’s GDP would
have shrunk by 6%, a $3.4 trillion loss in GDP (present value)
– at a cost of 880,000 jobs q.
Energy Vision
|
12Foreword Executive summary Drivers of change Future energy scenarios Key trends Decarbonisation, jobs & costs Our Vision Power system implications Appendix
Drivers of change
Climate change and the energy sector
Spotlight
Building a more resilient energy system is a critical task for the coming decades.
In February 2021, Texas’s electricity infrastructure was overwhelmed by On the other side of the world, a once in a thousand year rainfall event hit
an extreme polar vortex, triggering the largest forced power outage in China in July 2021, causing widespread flooding, death and destruction. In the
United States’ history. Freezing weather shut off natural gas supplies, froze same month, heavy floods wiped out villages, infrastructure and killed more
instruments in gas, coal and nuclear power plants and iced over wind turbines. than 200 people in Germany. And, in India, the heaviest monsoon rains in
As demand for heating soared to record levels, more than five million homes decades overflowed rivers, triggered landslides, killed more than 125 people
and businesses were left without power for nearly four days straight r. and left entire neighbourhoods submerged t.
In June 2021, a heatwave hit north-western United States and Canada, Australian land areas have already warmed by around 1.4°C since 1910u and
with temperature records being broken by as much as 5°C. The heatwave future impacts will affect all sectors of our economy, our communities and
was linked to several hundred deaths and, in some regions, caused rolling ecosystems. Water supply reliability is expected to decline in southern and
blackouts and even melted power cables and road surfaces. The event was eastern Australia, temperatures will rise, heatwaves, storms and floods will
assessed to be a once in a thousand year event, made at least 150-times more become more common and risks to infrastructure will increase v.
likely because of climate change s.
The projected increase in the number of days where temperatures will rise
above 35°C in NSW is shown in Figure 3, under a high global warming scenario.
Figure 3: Historical (1981-2010), left, and projected (2070), right, number of days above 35°C during the December to February period for a RCP8.5 scenario w
Energy Vision
|
13Foreword Executive summary Drivers of change Future energy scenarios Key trends Decarbonisation, jobs & costs Our Vision Power system implications Appendix
Future energy scenarios
Effective scenario planning requires
scenarios that span the range of
plausible future outcomes.
In partnership with independent experts, CSIRO, ClimateWorks Australia and The Brattle Group,
we have developed and modelled six possible futures for Australia’s energy system out to 2050.
The following scenarios explore the impact of different combinations of the six forces listed on
the previous page. More details on the approach can be found in Appendix 1.1.
Current trends Deep decarbonisation Prosumer power De‑industrialisation death spiral States go it alone Clean energy superpower
Ageing coal power stations are Market forces, international and Consumer choices and technology A global economic downturn causes A breakdown of NEM regulations Australia leverages its abundant
replaced with competitively priced domestic politics and consumer advancement drive a very high Australia’s economic growth to sees a siloed approach from the renewable energy resources and
large and small‑scale renewables expectations drive a huge reduction penetration of well-coordinated slump, particularly impacting the states which establish their own mineral ores to become a global
and storage in carbon emissions across all distributed energy resources into industrial sector policies and local energy solutions. clean energy superpower, exporting
sectors of our economy. Australia the energy system A regulatory impasse prevents green hydrogen and metals to
– Economic growth, immigration and – Industrial electricity consumption
commits to limit global warming to new interstate transmission the world
energy efficiency are consistent – Extremely high uptake of rooftop in the NEM declines by 50% to
1.5°C, in line with the aspirations of developments from proceeding
with historic and projected growth solar, behind-the-meter storage 2025. Australia’s aluminum and – Australia’s hydrogen sector grows
the Paris Agreement
rates under present trends, taking and electric vehicles (many steel production facilities close – New transmission links between to produce 19.2 million tonnes (MT)
into account current projections – Australia achieves net zero equipped with Vehicle-to-Grid by 2025 states cannot be built, although of hydrogen annually by 2050. This
for the recovery from COVID-19 emission by 2035 and then net- capabilities) – Commercial electricity demand existing links remain in use is broadly consistent with the high
– Electric vehicle, rooftop solar and negative emissions beyond – Artificial intelligence and falls by 9% in the NEM before – Each state must generate and scenario from Australia’s National
behind-the-meter battery – Our electricity system is powered by automation enable the slowly growing in the 2040s balance its own electricity Hydrogen Strategy
uptake is consistent with current 100% renewable energy from 2035 coordination of consumer devices to maintain energy reliability – 61% of the hydrogen produced is
central projections – Internal combustion engine to respond to local system and – Other modelling assumptions align exported to our trading partners,
vehicles are completely phased market conditions to the Current trends scenario 22% is used to produce green steel
out by 2050, replaced primarily by – A net zero emissions economy is for export and 17% is for other
electric vehicles achieved by 2050 domestic purposes
– Hydrogen is used for some – Australian steel production increases
domestic heavy-transport and significantly (from 0.3% to 5% of
industry applications and for global steel output) and aluminum
Energy Vision
peaking electricity generation production (a five-fold growth)
– A net zero emissions economy is
achieved by 2050
|
14Foreword Executive summary Drivers of change Future energy scenarios Key trends Decarbonisation, jobs & costs Our Vision Power system implications Appendix
Future energy scenarios
Scenario comparisons
Scenarios can be compared against their level of decarbonisation, decentralisation and underlying
electricity consumption in Figure 4. Detailed scenario assumptions are presented in Appendix 1.2.
Figure 4: Comparing scenarios against the level of Australia’s decarbonisation, the decentralisation of the electricity
system and the underlying electricity consumption in the NEM in 2050 (represented by the size of the bubble)
Highly decentralised
The higher up on this chart,
Prosumer the greater the proportion of
power
behind-the-meter (rooftop solar)
generation to total generation, such
as in Prosumer power
States go
it alone
De‑industrialisation The further to the right, the
death spiral Deep decarbonisation more significant and rapid the
decarbonisation is, such as in
Current Deep decarbonisation
trends
The size of the bubble represents
Clean energy our economy’s underlying electricity
superpower consumption in 2050, irrespective
of whether the power is produced
behind- or in front-of-the meter.
Clean energy superpower has the
Strong decarbonisation greatest electricity requirements
Energy Vision
|
15Foreword Executive summary Drivers of change Future energy scenarios Key trends Decarbonisation, jobs & costs Our Vision Power system implications Appendix
Future energy scenarios
The importance of scenario planning
Spotlight
Scenario-based planning is essential to ensure a robust energy system into the future. It is particularly useful
in times of rapid change and disruption. The global growth in solar PV is a good example of why planning for
divergent and unexpected future outcomes is crucial.
Figure 5: Cumulative global solar capacity. Historical data is shown in red and central outlooks from the International Energy Agency’s
World Energy Outlook (WEO) are shown in green.
4,000
3,500
Culmulative global solar capacity (GW)
3,000
In 2009, the International Energy
2,500 Agency predicted that 96GW
of solar PV would be installed
2,000 globally by 2020.
In reality, 718GW was installed.
1,500
1,000
500
0
2000 2005 2010 2015 2020 2025 2030 2035 2040
WEO 2009 WEO 2010 WEO 2011 WEO 2012 WEO 2013 WEO 2014 WEO 2015 WEO 2016 WEO 2017
WEO 2018 WEO 2019 WEO 2020 (STEPS) Actual
Energy Vision
Source: Transgrid analysis of Carbon Brief x, from the World Energy Outlook 2020 y and previous editions
|
16Foreword Executive summary Drivers of change Future energy scenarios Key trends Decarbonisation, jobs & costs Our Vision Power system implications Appendix
Key trends
This section explores the key electricity sector trends that unfold
under our six scenarios, as modelled by CSIRO and ClimateWorks
Australia. We can already see signs of some of our future scenarios,
with many of their indicators forming clear trends that should
inform investment in the energy system.
Energy Vision
|
17Foreword Executive summary Drivers of change Future energy scenarios Key trends Decarbonisation, jobs & costs Our Vision Power system implications Appendix
Key trends
Unstoppable transition to renewables
In all future scenarios, our least-cost modelling shows that renewable energy will supply the vast
majority of Australia’s electricity production by 2050 – 94% in Current trends and 100% in Clean energy
superpower. All the evidence points to the fact that the transition from a fossil fuel to renewable energy
based power system is unstoppable.
Figure 6: Annual share of renewable energy generation to total generation in the NEM, inclusive of largescale wind
and solar PV, rooftop solar, hydro and biomass
100%
Annual renewable energy generation share (%)
90%
80%
70%
Renewable energy supplies
60% 91% of the NEM’s annual
50% electricity needs by 2030
in Deep decarbonisation,
40% and 100% by 2035
30%
In our business as usual,
20% Current trends scenario,
renewable energy is
10% projected to supply 64%
0% of the NEM’s annual
electricity needs by 2030
2020 2025 2030 2035 2040 2045 2050
and 94% by 2050
Current trends Deep decarbonisation Prosumer power
De-industrialisation death spiral States go it alone Clean energy superpower
Energy Vision
|
18Foreword Executive summary Drivers of change Future energy scenarios Key trends Decarbonisation, jobs & costs Our Vision Power system implications Appendix
Key trends
Early coal retirement is increasingly likely
The growth of renewables is challenging the economic viability of Australia’s aging coal generators. Multiple factors could accelerate the NEM’s current transition
from a coal to renewable-based power system, including:
Our analysis indicates a high likelihood of early coal withdrawal across a range of future scenarios.
– Further cost reductions and deployments of renewables and
Figure 7: Projected coal generation capacity in the NEM. Grey bars represent AEMO’s expected closure years 1 storage driving down the price of electricity, making it more
difficult for coal generators to remain profitable
25 In Current trends, – More ambitious climate change policies
De-industrialisation death 7GW of coal capacity is
– The technical failure of coal units, driven by age and increased
spiral suggests that if withdrawn from the NEM
ramping in response to variable renewable energy
a significant proportion 20 by 2030, 2GW more than
currently anticipated – A growing consumer preference for low emissions electricity
of Australia’s industrial
Coal generation capacity (GW)
demand was lost, excess The increased likelihood of early coal closures highlights the
supply would precipitate the 15 importance of an orderly and planned transition, ensuring there is
early withdrawal of some If Australia’s climate reliable, secure and affordable power as the system transitions to
coal generators ambitions were dropped firmed renewables.
and we experienced low
10 fossil fuel prices, coal
In Deep decarbonisation, life extensions may be
all coal generation
The Institute for Energy Economics and
economic, as shown in
ceases by 2032, reducing De‑industrialisation
Financial Analysis and Green Energy
5
economy‑wide emissions at death spiral Markets recently concluded that, by
the lowest cost 2025, coal plants in the NEM are likely to
0
see a 44-67% reduction in revenues, the
A rapid withdrawal of financial viability of several generators
2020 2025 2030 2035 2040 2045 2050 coal capacity is seen in
the mid-2030s in Clean
will be severely compromised and at least
AEMO's expected closure year Current trends Deep decarbonisation Prosumer power energy superpower and one generator may close
Prosumer power Edis, T., Bowyer, J., 2021, Green Energy Markets and Institute for
De-industrialisation death spiral States go it alone Clean energy superpower Energy Economics and Financial Analysis, Fast Erosion of Coal
Plant Profits in the National Electricity Market
Energy Vision
1. Expected closure years are sourced from AEMO’s 2020 Integrated System Plan Chart Data, reflecting committed retirement dates from coal
generators or at the 50th year of operation, whichever comes first. The baseline closure year for Yallourn Power Station has been updated to 2028.
Source: https://aemo.com.au/en/energy-systems/major-publications/integrated-system-plan-isp/2020-integrated-system-plan-isp.
|
19Foreword Executive summary Drivers of change Future energy scenarios Key trends Decarbonisation, jobs & costs Our Vision Power system implications Appendix
Key trends
Rise of the prosumer
In all scenarios, distributed energy technologies and increasingly sophisticated consumers will play
a key role in Australia’s future energy system.
Evolving customer expectations and a growing range of Rooftop solar and behind-the-meter storage
technologies are facilitating the democratisation of energy. Rooftop solar and behind-the-meter storage capacity is
Previously passive electricity consumers are becoming projected to surge in the coming decades, as projected in
empowered ‘prosumers’ who make their own choices about Figure 8. Prosumer power stress tests the implications of
how their energy is produced, stored and used. exceptionally high distributed energy resource penetration on
the design and operation of our energy system. By 2050, more
than 80% of Australian homes have rooftop solar 1.
Figure 8: Projected growth in rooftop solar and behind-the-meter storage in the NEM
Rooftop solar Behind-the-meter storage
90 70
Behind the meter storage capacity (GWh)
80
60
Rooftop solar capacity (GW)
70
50
60
50 40
40 30
30
20
20
10
10
0 0
2020 2025 2030 2035 2040 2045 2050 2020 2025 2030 2035 2040 2045 2050
Energy Vision
Current trends Deep decarbonisation Prosumer power
De-industrialisation death spiral Clean energy superpower & States go it alone
1. This is considered a fully saturated market, including penetrating into most rental residential homes and many business rentals.
|
20Foreword Executive summary Drivers of change Future energy scenarios Key trends Decarbonisation, jobs & costs Our Vision Power system implications Appendix
Key trends
Critical role for both behind-
Spotlight
and in front‑of-the-meter generation
Prosumer power has the highest proportion of The remaining 73% of our electricity requirements are
behind‑the‑meter generation, with rooftop solar providing met from largescale generators, delivered through the
27% of the NEM’s electricity needs by 2050. transmission backbone. It isn’t an either/or; both small and
largescale generation is required to meet Australia’s changing
electricity needs.
Figure 9: The proportion of underlying electricity consumption 1 met by rooftop solar in the NEM
30%
Portion of underlying electricity consumption
25%
supplied by rooftop solar (%)
20%
15%
10%
5%
0%
2020 2025 2030 2035 2040 2045 2050
Current trends Deep decarbonisation Prosumer power De-industrialisation death spiral
Energy Vision
States go it alone Clean energy superpower
1. Underlying electricity consumption represents the amount of electricity consumed, irrespective of whether it is supplied from behind-the-meter (e.g. rooftop
solar) or in front-of-the-meter sources.
|
21Foreword Executive summary Drivers of change Future energy scenarios Key trends Decarbonisation, jobs & costs Our Vision Power system implications Appendix
Key trends Rise of the prosumer
Under Deep decarbonisation, we project there
Electric Vehicles will be more than 3 million electric vehicles on
roads in NEM states by 2030, 14 million by 2040
and 23 million by 2050
Electric vehicles are projected to see mass-market penetration in the coming decade. While global passenger vehicle sales dropped 16% during
the COVID-19 pandemic, sales of electric vehicles jumped 47% z. This trajectory is expected to accelerate, with falling electric vehicle costs driven
by falling battery prices, dedicated electric vehicle manufacturing platforms and government support and incentives. In Europe, battery electric
vehicles are expected to reach price parity with internal combustion engine vehicles between 2025 and 2027 aa.
Australia currently lags other major economies in the growth Figure 10: Projections of electric vehicle uptake across the NEM
of electric vehicles, with electric vehicle sales accounting for
only 1.1% of all new car sales, behind the global average of 5%. 25
However, in the first half of 2021, Australia’s electric vehicle
To support the decarbonisation
sales were twice that of the whole of 2020 ab.
Number of electric vehicles (million)
of our economy, by 2050, all road
20
Across all scenarios, electric vehicle 1 uptake is projected to transport is electrified (with the
surge. Eight million electric vehicles are projected to be on exception of 50% of articulated
the road across the NEM by 2050 in Current trends. Under trucks), with 23 million electric
15
Deep decarbonisation, we project there will be more than vehicles on roads in NEM states
3 million electric vehicles by 2030 and 14 million by 2040.
By 2050, all road transport is electrified, with the exception
10
of 50% of articulated trucks. Patterns of vehicle use will also
change; for example, as autonomous vehicles are introduced
for ride sharing.
5
0
2020 2025 2030 2035 2040 2045 2050
Current trends Deep decarbonisation Prosumer power De-industrialisation death spiral
States go it alone Clean energy superpower
Energy Vision
1. Including passenger vehicles, light commercial vehicles, trucks, busses and motorcycles.
|
22Foreword Executive summary Drivers of change Future energy scenarios Key trends Decarbonisation, jobs & costs Our Vision Power system implications Appendix
Key trends
Surging demand for electricity
Surging demand for electricity in the coming decades could reshape our electricity system. Underlying electricity consumption
is projected to grow over six times to 2050 in Clean energy superpower. Electricity consumption also grows significantly in
Prosumer power and Deep decarbonisation, primarily due to the electrification of road transport and industry.
Figure 11: Projected growth in underlying electricity consumption in the NEM
(1,121TWh)
X
NEM demand doubles by 2035
Underlying electricity consumption (TWh)
400
and then triples again by 2050 in
Clean energy superpower, driven
by the production of hydrogen and
300 green steel
Even with significant efficiency
200 improvements, electrification
and hydrogen production drives
a near doubling of underlying
100 electricity consumption in Deep
decarbonisation (electrification
adds an extra 134TWh and hydrogen
0 production an extra 39TWh in 2050)
2020 2025 2030 2035 2040 2045 2050
In our business as usual
Current trends Deep decarbonisation Prosumer power
Current trends scenario, NEM
De-industrialisation death spiral States go it alone Clean energy superpower consumption grows 40% by
2050, primarily driven by vehicle
Note: Our modelling includes the economic and population impacts of COVID-19 on electricity demand, on changes in commercial electrification (48TWh additional
and industrial activity in the short term and a decline in immigration in the medium term. by 2050)
Energy Vision
|
23Foreword Executive summary Drivers of change Future energy scenarios Key trends Decarbonisation, jobs & costs Our Vision Power system implications Appendix
Decarbonisation, jobs & costs
The modelling offers clear insight into which scenarios will set Australia up to achieve net zero emissions,
while also maximising job creation and keeping energy prices affordable. Figure 12 presents the six
scenarios across these three key dimensions: decarbonisation, job creation and energy costs.
Figure 12: Comparing scenarios against their level of decarbonisation and electricity sector jobs created.
The size of the bubble represents the average cost of electricity between 2021-50
Strong electricity sector job growth
Clean energy The higher up, the greater the
superpower
jobs created. A Clean energy
superpower future would support
Deep 57,000 full-time Australian
decarbonisation electricity sector jobs on average
over the next 30 years
Current trends
The further to the right, the
States go Prosumer
it alone power more significant and rapid the
decarbonisation is, such as in
Deep decarbonisation
De‑industrialisation
death spiral
Strong decarbonisation
Energy Vision
|
24Foreword Executive summary Drivers of change Future energy scenarios Key trends Decarbonisation, jobs & costs Our Vision Power system implications Appendix
Decarbonisation, jobs & costs
Decarbonisation
Figure 13 projects the outlook for Australia’s greenhouse gas emissions across the six scenarios modelled. Our business as usual,
Current trends scenario follows a 4°C temperature rise trajectory. Only a Deep decarbonisation of the Australian economy is
consistent with the Paris Agreement’s aspirational 1.5°C trajectory.
Figure 13: Emissions projections for the Australian economy
600
500 “Choosing net zero is an economic
necessity. Holding global temperature
Australia's net emissions (Mt CO2-e)
400 4˚C trajectories
rise to 1.5°C could increase GDP by 2.6%
26-28% emissions reductions target and add 250,000 jobs to the Australian
300
economy by 2070”
200 Deloitte Access Economics, 2020, A new choice – Australia’s
climate for growth
100
2˚C trajectories
0
2020 2025 2030 2035 2040 2045 2050
-100
-200
1.5˚C trajectory
-300
Current trends Deep decarbonisation Prosumer power De-industrialisation death spiral States go it alone
Clean energy superpower Government emissions projections (2020) 1 26-28% emissions reduction target
Energy Vision
1. Business as usual, without additional emissions reduction activities. Source: Australian Government, Department of Environment and Energy, 2020, Australia’s emissions
projections 2020, https://www.industry.gov.au/data-and-publications/australias-emissions-projections-2020
|
25Foreword Executive summary Drivers of change Future energy scenarios Key trends Decarbonisation, jobs & costs Our Vision Power system implications Appendix
Decarbonisation, jobs & costs
A Clean energy superpower future supports
Electricity sector jobs 68,000 electricity sector jobs on average from
2030-50, more than twice the level of jobs
projected in Current trends
As our energy system transforms, new electricity sector jobs will be created. Many of these jobs
will be located in regional Australia, supporting the construction and operation of generation,
storage and transmission within and around renewable energy zones.
A Deep decarbonisation of Australia’s economy would Figure 14: Projections of electricity sector jobs in the NEM
require 41,000 Australian electricity sector jobs on average
Job growth is driven by the rapid Job growth is seen in the early
over the next 10 years (full time equivalent), 45% more
rollout of renewable energy to 2030s as renewables replace
than projected in Current trends. In the following two
reduce emissions intensive coal coal generators as they retire in
decades, a Clean energy superpower future would support
generation in Deep decarbonisation Prosumer power
68,000 electricity sector jobs, more than twice the level
of jobs projected in Current trends.
This analysis considers Australian jobs required to enable 100,000
Jobs surge as the growing
the production of electricity in the NEM ac. Sectors include
demand for electricity from
coal, gas, largescale wind and solar PV, grid batteries,
80,000 green hydrogen and metals
pumped hydro storage, rooftop solar and behind-the-meter
Electricity sector jobs (FTE)
production and the retirement
batteries, and the construction of new electricity transmission
of coal drives the rollout of
infrastructure. These sectors can be broken down into
60,000 renewable energy generation
construction, installation, manufacturing, operations and
in Clean energy superpower
maintenance and thermal coal and gas extraction for our
domestic electricity sector.
40,000
Note: Our analysis does not assess additional indirect and
downstream jobs created, for example in the production of
hydrogen, green steel or any other use of electricity, which are 20,000
likely to be multiples of the figures presented here.
0
2020 2025 2030 2035 2040 2045 2050
Energy Vision
Current trends Deep decarbonisation Prosumer power
De-industrialisation death spiral States go it alone Clean energy superpower
|
26Foreword Executive summary Drivers of change Future energy scenarios Key trends Decarbonisation, jobs & costs Our Vision Power system implications Appendix
Decarbonisation, jobs & costs
Electricity sector jobs
Largescale wind, solar PV and rooftop solar make up the majority of jobs in Jobs aren’t only created by the construction or installation of renewables. Operations
Deep decarbonisation, as well as pumped hydro and electricity transmission jobs in and maintenance jobs also increase steadily over time, as shown in Figure 16.
Clean energy superpower, as shown in Figure 15. Coal and gas jobs decline in both
scenarios, from a high of approximately 11,000 jobs in 2021.
Figure 15: Jobs required to support the NEM’s electricity sector in Clean energy superpower and Deep decarbonisation, Figure 16: Jobs required to support the NEM’s electricity sector in Clean energy superpower and Deep decarbonisation,
split by technology split by type of work
Fossil fuels: In 2021, approximately 11,000 jobs Operations & maintenance: In the
were required to operate and maintain coal 2040s, operations and maintenance
and gas generators and to mine thermal coal jobs represent 70% of all electricity
and extract gas for domestic power generation sector jobs in Deep decarbonisation
Deep
Deep decarbonisation
decarbonisation Clean
Clean energy
energy superpower
superpower Deep decarbonisation Clean energy superpower
100,000
100,000 100,000
100,000 100,000 100,000
(FTE)
(FTE)
jobs(FTE)
jobs(FTE)
Electricity sector jobs (FTE)
Electricity sector jobs (FTE)
80,000
80,000 80,000
80,000 80,000 80,000
sectorjobs
sectorjobs
60,000
60,000 60,000
60,000 60,000 60,000
Electricitysector
Electricitysector
40,000
40,000 40,000
40,000 40,000 40,000
Electricity
Electricity
20,000
20,000 20,000
20,000 20,000 20,000
0
0 0
0 0 0
2020
2020 2025
2025 2030
2030 2035
2035 2040
2040 2045
2045 2050
2050 2020
2020 2025
2025 2030
2030 2035
2035 2040
2040 2045
2045 2050
2050 2020 2025 2030 2035 2040 2045 2050 2020 2025 2030 2035 2040 2045 2050
Black Operations & maintenance Construction/installation Local manufacturing Fuel extraction (coal & gas)
Black coal
coal Brown
Brown coal
coal Gas
Gas (CCGT)
(CCGT) Peaking
Peaking gas
gas +
+ liquids
liquids Hydro
Hydro Biomass
Biomass Wind
Wind
Solar
Solar PV
PV Rooftop
Rooftop solar
solar Grid
Grid battery
battery Pumped
Pumped hydro
hydro Behind-the-meter battery
Behind-the-meter battery Transmission
Transmission
Energy Vision
|
27You can also read