Effects of Slope Aspect and Rainfall on Belowground Deep Fine Root Traits and Aboveground Tree Height

Page created by Janet Mitchell
 
CONTINUE READING
Effects of Slope Aspect and Rainfall on Belowground Deep Fine Root Traits and Aboveground Tree Height
ORIGINAL RESEARCH
                                                                                                                                                   published: 18 October 2021
                                                                                                                                               doi: 10.3389/fpls.2021.684468

                                              Effects of Slope Aspect and Rainfall
                                              on Belowground Deep Fine Root
                                              Traits and Aboveground Tree Height
                                              Ma Lihui 1,2, Liu Xiaoli 3*, Chai Jie4, Wang Youke 1,2 and Yang Jingui 3
                                              1
                                               Institute of Water Saving Agriculture in Arid Areas of China, Northwest A&F University, Yangling, China, 2 Institute of Soil and
                                              Water Conservation, Northwest A&F University, Yangling, China, 3 College of Water Resources and Architectural Engineering,
                                              Northwest A&F University, Yangling, China, 4Language Culture College, Northwest A&F University, Yangling, China

                                              The vertical root distribution and rooting depth are the main belowground plant functional
                                              traits used to indicate drought resistance in arid and semiarid regions. The effects of the
                                              slope aspect on the aboveground traits are visible but not the belowground deep root
                                              traits. We aimed to investigate the fine root traits of the locust tree (Robinia pseudoacacia L.)
                                              planted on southerly and northerly aspects, and the variations in the rooting depth in
                                              regions with different rainfall, as well as assessing how deep rooting, might affect the
                                              response to drought in a loess region. We selected three study sites with different rainfall
                           Edited by:         amounts, with six sampling plots at each site (three each with southerly and northerly
                         Boris Rewald,
                                              aspects). Soil core samples were collected down to the depth where no roots were
  University of Natural Resources and
         Life Sciences Vienna, Austria        present. The locust trees tended to develop deeper fine roots rather than greater heights.
                         Reviewed by:         The tree height and diameter were greater for locust trees on northerly aspects, whereas
                            Emily Palm,       trees on southerly aspects had significantly deeper rooting depths. Fine root traits (root
            University of Florence, Italy
                  Christophe Jourdan,
                                              length, root area, and root dry weight density) were higher in the southerly aspect for both
     Institut National de la Recherche        Changwu and Ansai, but lower in Suide. The ratio of the root front depth tree height
         Agronomique (INRA), France
                                              ranged from 1.04 to 3.17, which was higher on southerly than northerly aspects, and it
                  *Correspondence:
                                              increased as the rainfall decreased. Locust tree growth traits (belowground fine root and
                           Liu Xiaoli
                 404270234@qq.com             aboveground tree height) were positively correlated with the mean annual rainfall. The soil
                                              moisture content of the topsoil decreased as the rainfall decreased, but the pattern varied
                   Specialty section:
                                              in the deep layer. Our results suggest that the variations in the belowground rooting depth
         This article was submitted to
             Functional Plant Ecology,        under different slope aspects may be related to plant survival strategies. The vertical
               a section of the journal       extension of the rooting depth and tree height may be key functional traits that determine
            Frontiers in Plant Science
                                              plant growth in drought-prone regions.
          Received: 23 March 2021
      Accepted: 27 September 2021             Keywords: fine root, functional trait, root distribution, slope aspect, vertical tree extension
        Published: 18 October 2021

                            Citation:
      Lihui M, Xiaoli L, Youke W and
     Jingui Y (2021) Effects of Slope
                                              INTRODUCTION
 Aspect and Rainfall on Belowground
           Deep Fine Root Traits and
                                              Determining plant functional traits might help us to understand the responses of plants to
           Aboveground Tree Height.           environmental variations (Reich et al., 2003). Solar radiation, temperature, and soil moisture
        Front. Plant Sci. 12:684468.          are the main environmental factors that contribute to plant growth. The slope aspect is an
     doi: 10.3389/fpls.2021.684468            important topographical factor because it can change the intensity and duration of solar

Frontiers in Plant Science | www.frontiersin.org                                       1                                            October 2021 | Volume 12 | Article 684468
Effects of Slope Aspect and Rainfall on Belowground Deep Fine Root Traits and Aboveground Tree Height
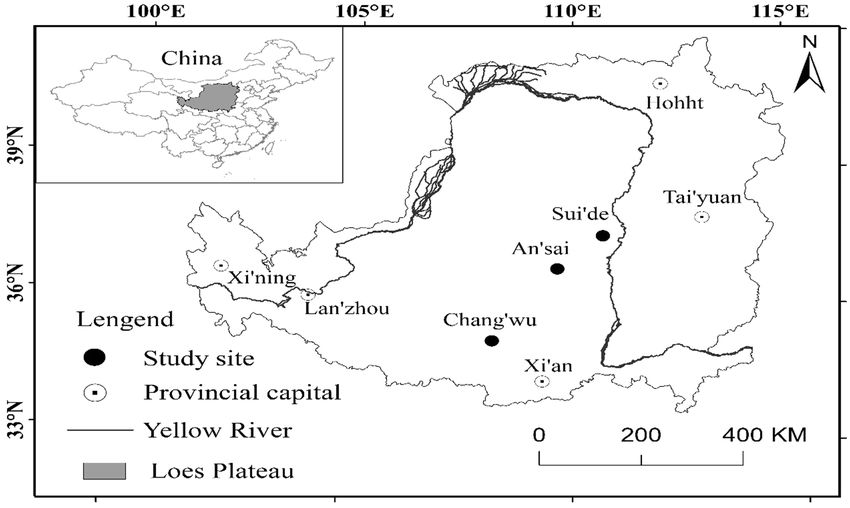
Lihui et al.                                                                                                                   Deep Fine Root Trait

radiation, thereby affecting the temperature and soil moisture           and semiarid Loess Plateau region (Guo et al., 1998). The
in local areas (Cantón et al., 2004). The contrasting effects of         locust tree is characterized by high water consumption and
northerly and southerly slopes can produce different climates,           it can readily exhaust the available soil water. However, it is
where the greater solar radiation on southerly slopes can increase       highly resistant to drought when the minimum survival
the temperature and evapotranspiration to yield more arid                requirement is maintained. Zhang et al. (2018) found that
conditions in the Northern Hemisphere (Finkel et al., 2001;              the fine root area density in locusts tree exhibited a decreasing
Gutiérrez-Jurado et al., 2013). These climatic differences can           trend from a wetter site to a drier site, and the fine roots
cause plants to develop different functional traits, especially          exhibited similar rooting patterns along a precipitation gradient
in terms of the tree height, canopy size, leaf structure, and            throughout the whole 3 m soil profile. Nicolescu et al. (2018)
branch density (Niinemets, 2006; Rozendaal et al., 2006). Finkel         showed that the locust tree was fast growing with the maximum
et al. (2001) and Nevo (2012) showed that the aboveground                tree height being reached in the first 5 years and the peak
biomass was lower in a plantation on a southerly slope, whereas          diameter in the first 10 years. The locust tree has a high
Kou et al. (2013) and Fan et al. (2012) obtained the opposite            capacity for adaptability and it can be utilized in projects
results. These differences of slope aspect and soil moisture in          that aim to convert farmland into forestland, it can severely
environmental factors could affect the aboveground                       desiccate the deep soil layer (Jia et al., 2017), thereby resulting
morphological traits of plants (Vitória et al., 2019) and they           in environmental deterioration with low productivity
might reflect the growth strategies employed by plants to resist         and efficiency.
drought (Liu and Ma, 2015). However, little information is                  In the present study, we comprehensively analyzed the vertical
available regarding the deep root traits of plants.                      extent comprising the tree height and the rooting depth for
   Fine roots (diameter < 2 mm) play important roles in the              the locust tree. We hypothesized that the rooting depth would
absorption of water and nutrients (Chahine, 1992), especially            increase as the rainfall decreased and it was deeper in northerly
the deep fine roots, which can absorb deep water in the soil             than southerly aspect according to the theory of optimal resource
to maintain plant transpiration during the dry season (Nepstad           partition which indicated that plant root could extend deeper
et al., 1994; Liu and Diamond, 2005; Oliveira et al., 2005).             layer to absorb deeper soil water to resist drought in drier
The ability of plants to access water reflects its adaptation to         areas. The main aims of this study were as: (1) to investigate
drought (Vadez, 2014). The fine root distribution and the                the deep fine root distribution for locust trees under different
rooting depth are the main belowground functional traits that            slope aspects; (2) to analyze the trends in the fine roots in
might determine the volume of soil water acquired, thereby               regions with different rainfall amounts; and (3) to assess the
characterizing the growth and survival strategies of plants in           vertical extents of the rooting depth and tree height as key
water-limited ecosystems (Collins and Bras, 2007). Akkermans             functional traits for determining plant growth. The results
et al. (2012) showed that the rooting depth was a major variable         obtained in this study provide new insights into the vertical
that controls evapotranspiration during the dry season in African        extent of the deep roots and the ratio of the belowground
forests according to soil–vegetation–atmosphere transfer models,         rooting depth relative to the aboveground tree height in areas
and it might be a direct indicator of a plant’s adaptability to          with different rainfall amounts, thereby helping us to understand
drought. However, few studies have quantified the fine root              plant growth and survival strategies.
distribution relative to rooting depth due to the difficulties of
root sampling (Wang et al., 2009; Maeght et al., 2013; Freycon
et al., 2014). In addition, studies have rarely investigated the         MATERIALS AND METHODS
deep fine root distributions under contrasting slope aspects
(Kurze et al., 2017). Previous studies mainly concentrated on            Study Sites
the differentiation of ecotypes on a large-scale aridity gradient        This study was conducted during summer between July and
(Wang and Gao, 2003; Volis, 2007; Kurze et al., 2017). According         August 2018 in the Loess Plateau region of China, where the
to the Hijioka et al. (2014), the aridity will intensify in many         deep loess layer and ground water depth are more than 50 m
regions throughout the world in the present century and the              (Ma et al., 2013; Zhu et al., 2018). Thus, this region is an
annual precipitation will decrease. Thus, deep fine root traits          excellent area for studying deep roots. In our study area,
in regions with different rainfall amounts are valuable data             we investigated three different sites in Changwu, Ansai, and
for assessing hydrobiological processes and the adaptability of          Suide counties across a distance of 337 km. In this region, the
plants to environmental variations.                                      climate is cold with four distinct seasons characterized by dry
   The Loess Plateau region of China is an ideal area for                winters and warm summers in Changwu and Ansai (Dwb),
studying the root distributions in a deep and homogeneous                and the arid conditions characterized by steppe and cold (Bsk)
soil layer because the deep loess layer is not affected by any           in Suide according to the Köppen-Geiger climate type (Peel
interference due to differences in the groundwater level. The            et al., 2007). The highest sunlight, heat, and rainfall levels
locust tree (Robinia pseudoacacia L.) is an exotic species that          mostly occur in July, August, and September, and more than
has been planted widely in China to conserve soil and water              50% of the total annual rainfall occur in these 3 months
since the 1950s due to its drought tolerance, rapid growth,              (Table 1). The locations of the sites are shown in Figure 1.
and simple propagation (Wang, 2017). The area planted with               We sampled the northerly and southerly aspects at all sites
locust trees since the 1950s exceeds 70,000 ha in the arid               with three samples from each.

Frontiers in Plant Science | www.frontiersin.org                     2                                    October 2021 | Volume 12 | Article 684468
Lihui et al.                                                                                                                                                                                                                                                                                                                                                                                                                 Deep Fine Root Trait

                                                                                                                                                                                                                                                                                                                                                                           At each site, we selected six sampling plots on the upper

                                                                                                                                                         107°48'–107°58'E,

                                                                                                                                                         108°05'–109°26'E,

                                                                                                                                        Arid with steppe 110°04'–110°41'E
                                                                                                                                        winter and warm 34°59'–35°18'N

                                                                                                                                        winter and warm 36°30'–37°19'N

                                                                                                                                                          37°16'–37°45'N
                                                                                                                Geographical
                                                                                                                                                                                                                                                                                                                                                                        slopes (10 × 10 m, with three on southerly aspects and three

                                                                                                                coordinates
                                                                                                                                                                                                                                                                                                                                                                        on northerly aspects) to quantitatively investigate the
                                                                                                                                                                                                                                                                                                                                                                        characteristics of the locust tree plantations. The sites were
                                                                                                                                                                                                                                                                                                                                                                        chosen carefully to minimize confounding environmental factors,
                                                                                                                                                                                                                                                                                                                                                                        where the altitude, inclination, and tree growth stage were
                                                                                                                                                                                                                                                                                                                                                                        similar on both aspects (three replicates). All sites were located

                                                                                                                                        summer (Dwb)
                                                                                                                                        summer (Dwb)

                                                                                                                                        and cold (Bsk)
                                                                                                                         Climate type

                                                                                                                                        Cold with dry
                                                                                                                                        Cold with dry
                                                                                                                                                                                                                                                                                                                                                                        in well-vegetated areas where the depth of the surface litter
                                                                                                                                                                                                                                                                                                                                                                        was about 1 cm in the locust tree stands. The sampling point
                                                                                                                                                                                                                                                                                                                                                                        was located on the same side of the tree along the contour
                                                                                                                                                                                                                                                                                                                                                                        line. The sampling point and two adjacent locust trees (2 m
                                                                                                            Soil wilting

                                                                                                                                                                                                                                                                                                                                                                        between the trees and 4 m between the tree rows) at a similar
                                                                                                              point

                                                                                                                                        7.46
                                                                                                                (%)

                                                                                                                                                    4.5

                                                                                                                                                                 3.7
                                                                                                                                                                                                                                                                                                                                                                        growth stage in the same row formed an isosceles triangle
                                                                                                                                                                                                                                                                                                                                                                        with a side length of 1.2 m from the tree trunk. We transformed
                                                                                                                                                                                                                                                                                                                                                                        the slope into flat ground with a shovel and fixed sampling
                                                                                                                                                                             Soil bulk density, soil field capacity, and soil wilting point were measured in 0–1 m layer. Climate was based on updated Köeppen-Geiger climate classification (Peel et al., 2007).       shelves with two wooden baseboards (1.2 m in length and 0.3 m
                                                                                                            Soil field
                                                                                                            capacity

                                                                                                                                        21.9

                                                                                                                                                    18.4

                                                                                                                                                                 15.8
                                                                                                              (%)

                                                                                                                                                                                                                                                                                                                                                                        in width), where a plumb was used to determine the level.
                                                                                                                                                                                                                                                                                                                                                                        All weeds and the litter layer were removed every 10 days at
                                                                                                                                                                                                                                                                                                                                                                        30, 20, and 10 days before sampling period within the sampling
                                                                                                                                                                                                                                                                                                                                                                        area to eliminate any interference from other plant roots.
                                                                                                            Soil bulk

                                                                                                            (g cm−3)
                                                                                                            density

                                                                                                                                                    1.28

                                                                                                                                                                 1.25

                                                                                                                                                                                                                                                                                                                                                                           The maximum rainfall infiltration depth was 2 m (Liu et al.,
                                                                                                                                        1.3

                                                                                                                                                                                                                                                                                                                                                                        2010). We defined the deep soil as the soil layer below 2 m.
                                                                                                                                                                                                                                                                                                                                                                        Liu et al. (2014) showed that the deep soil moisture content
                                                                                                                                                                                                                                                                                                                                                                        (below 2 m) remained fairly stable with almost no seasonal
                                                                                                            temperature
                                                                                                             Cumulative

                                                                                                                                                                                                                                                                                                                                                                        variation based on long-term observations in the study area.
                                                                                                              (≥ 10°C)

                                                                                                                                        3,029

                                                                                                                                                    3,121

                                                                                                                                                                 3,485

                                                                                                                                                                                                                                                                                                                                                                        Thus, we assumed that the deep soil moisture was not affected
                                                                                                                                                                                                                                                                                                                                                                        by the rainfall in the sampling period and it could represent
                                                                                                                                                                                                                                                                                                                                                                        the soil moisture regime consumed by plants over a long
                                                                                                                                                                                                                                                                                                                                                                        period. According to previous studies, the sampling period
                                                                                                            evapotranspiration
                                                                                                             Annual potential

                                                                                                                                                                                                                                                                                                                                                                        during the summer is characterized by the peak abundance
                                                                                                                                                                                                                                                                                                                                                                        of fine roots (Burke and Raynal, 1994), minimum soil water
                                                                                                                                        1029.1

                                                                                                                                                                 1280.5
                                                                                                                                                    1,127
                                                                                                                  (mm)

                                                                                                                                                                                                                                                                                                                                                                        storage (Duan et al., 2017), and the most severe drought
                                                                                                                                                                                                                                                                                                                                                                        throughout the year. Therefore, the data collected represented
                                                                                                                                                                                                                                                                                                                                                                        the responses of the fine roots to the soil water regime and
                TABLE 1 | Main natural geographical characteristic and soil properties at sampling sites.

                                                                                                                                                                                                                                                                                                                                                                        other environmental factors in the corresponding
                                                                                                                                                                                                                                                                                                                                                                        sampling period.
                                                                                                            sunshine
                                                                                                            hours (h)
                                                                                                             Annual

                                                                                                                                        2226.5

                                                                                                                                                    2395.6

                                                                                                                                                                 2615.1

                                                                                                                                                                                                                                                                                                                                                                        Stand Characteristics
                                                                                                                                                                                                                                                                                                                                                                        The locust tree stands at the three sites had similar densities
                                                                                                                Altitude

                                                                                                                                                                                                                                                                                                                                                                        (5,000 trees ha−1), with 2 m between the trees and 4 m between
                                                                                                                                        1,224

                                                                                                                                                    1,063

                                                                                                                                                                 877
                                                                                                                  (m)

                                                                                                                                                                                                                                                                                                                                                                        the tree rows, and the canopy was closed with coverage of
                                                                                                                                                                                                                                                                                                                                                                        more than 85%, except on the southerly aspect in Ansai where
                                                                                                                                                                                                                                                                                                                                                                        the coverage was 70%. The stands were all artificial forests,
                                                                                                                                                                                                                                                                                                                                                                        which were in middle age in Ansai (18 years) and mature age
                                                                                                            temperature
                                                                                                              Annual

                                                                                                                                                                                                                                                                                                                                                                        in Changwu and Suide (37 and 35 years) (Table 2); the trees
                                                                                                               (°C)

                                                                                                                                        9.1

                                                                                                                                                    8.8

                                                                                                                                                                 9.7

                                                                                                                                                                                                                                                                                                                                                                        were all at the growth period based on the regulations for
                                                                                                                                                                                                                                                                                                                                                                        the main tree species (LY/T 2908–2017, China), which define
                                                                                                                                                                                                                                                                                                                                                                        the age of locust trees as young at ≤15 years, middle at
                                                                                                                                                                                                                                                                                                                                                                        16–25 years, and mature at 31–40 years. The tree height and
                                                                                                            Annual
                                                                                                            rainfall
                                                                                                             (mm)

                                                                                                                                                                                                                                                                                                                                                                        mean diameter at breast height were determined. We measured
                                                                                                                                        580

                                                                                                                                                    500

                                                                                                                                                                 443

                                                                                                                                                                                                                                                                                                                                                                        the tree height with an optical height meter (CGQ-1, Harbin
                                                                                                                                                                                                                                                                                                                                                                        Optical Instrument Factory Co. Ltd., China) and the mean
                                                                                                                                                                                                                                                                                                                                                                        diameter with a measuring tape. First, we measured the horizontal
                                                                                                                                                                                                                                                                                                                                                                        distance between the trees and the optical height meter with
                                                                                                                                        Changwu

                                                                                                                                                                                                                                                                                                                                                                        a measuring tape. We then targeted the top of the tree through
                                                                                                                                                                 Suide
                                                                                                                                                    Ansai
                                                                                                                    Site

                                                                                                                                                                                                                                                                                                                                                                        an observation hole and determined the sight point carefully

Frontiers in Plant Science | www.frontiersin.org                                                                                                                                                                                                                                                                                                                    3                                   October 2021 | Volume 12 | Article 684468
Lihui et al.                                                                                                                Deep Fine Root Trait

  FIGURE 1 | Study sites for locust tree in loess region.

by aligning the pointer in the plumb position. We pulled the            from grass roots based on their morphology and color (Sun
trigger and the pointer was locked. Hence, tree height was              et al., 2015). Dead roots were identified based on their color
determined by the pointer scale values. The coverage represents         and flexibility, and then discarded (live roots were yellowish
the percentage of the vertical projection area of the plant             brown, whereas dead roots were dark). We found a few dead
aboveground relative to the sampling plot area, and it was              roots in the top 1.2 m soil depth and almost no decay roots
calculated using the formula for the elliptical projected area          occurred in deeper soil layer. Fine roots (diameter < 2 mm)
of the canopy: C = pXY / 4 , where X and Y denote the major             were collected and placed on transparent rectangular plastic
and minor axis lengths, respectively (Phillips and                      plates filled with water, which allowed the roots to spread and
Macmahon, 1981).                                                        float on the surface, before scanning at a resolution of 300
                                                                        dpi. The area, length, and diameter were measured for the
Fine Root Sampling and Analysis                                         fine roots with WinRHIZO (Regent Instruments Inc., Canada).
Fine roots were sampled using the soil coring method (with              The fine root length density (RLD, m m−3) was defined as
a specialized soil auger made in China called a “Luoyang                the root length per unit soil volume. D50 and D95 were used
shovel” internal diameter = 16 cm), as described previously by          to denote the soil depths above which 50% or 95% of the
Ma et al. (2013). In fact, a massive effort was done to achieve         total RLD were located, respectively. The fine root area density
such work through very deep soil excavation. Luoyang shovel             (RAD, m2 m−3) was defined as the root area per unit soil
with larger internal diameter could greatly improve the sampling        volume. The fine root dry weight density (RDWD, g m−3) was
efficiency, it took about 2.5 h for two persons to drill down           defined as the dry weight of roots per unit soil volume, which
to 8 m depth, 4 h for two persons to 12 m depth, and 8 h for            was determined after washing and cleaning, and drying for
three persons to 18 m depth. Soil samples were collected at             24 h at 65°C. Nothing was present in the deep layer except
20 cm intervals throughout the whole soil layer until no roots          for soil and roots. We found only a few roots above 1 cm in
were found in two consecutive layers. We set the “two consecutive       diameter below 3 m. The eolian soil was homogeneous among
layers” criterion for root front depth which meant that root            the six sampling points at each site in the loess region. At
front extended downward to the depth where no root occurred             present, the soil coring method is a feasible approach for
below this depth in two consecutive layers. Deep roots were             identifying deep roots by actual field sampling.
defined as roots found below 2 m. The vertical tree extension
was defined as root front depth plus tree height.                       Soil Moisture Analyses
    Roots were separated from soil particles by washing through         Soil bulk density, soil field capacity, and soil wilting point
a 0.2 mm sieve under running tap water. The root samples                were measured in 0–1 m layer in the laboratory. Soil bulk
were placed in plastic bags, tagged with identifiers, and stored        density and soil filed capacity were determined by the cutting
at 4°C until they were processed. Tree roots were distinguished         ring method. The wilting point was measured following the

Frontiers in Plant Science | www.frontiersin.org                    4                                  October 2021 | Volume 12 | Article 684468
Lihui et al.                                                                                                                                                                                                                                                                                                                                                                                                           Deep Fine Root Trait

                                                                                                                                                                                                                                                                                                                                                                 method described by Wei et al. (2004), who defined the wilting

                                                                         understory
                                                                         vegetation
                                                                                                                                                                                                                                                                                                                                                                 point as the soil water content when the soil water suction

                                                                                            Agropyron
                                                                                            Armoise

                                                                                            Armoise

                                                                                                                       PAR indicates photosynthetically active radiation. Whole vertical extension refers to the stand height plus the maximum rooting depth. Coverage represents the percentage of the vertical projection area of the plant above ground
                                                                                            Leymus
                                                                                                                                                                                                                                                                                                                                                                 was equal to 1.47 MPa.

                                                                                            Rubus

                                                                                            Moss
                                                                         Main
                                                                                                                                                                                                                                                                                                                                                                    After separating the roots, each soil core sample was dried
                                                                                                                                                                                                                                                                                                                                                                 to a constant weight at 105°C and the gravimetric soil moisture
                                                                             Coverage                                                                                                                                                                                                                                                                            content was determined using the following formula.

                                                                                            96%
                                                                                            98%
                                                                                            95%
                                                                                            70%
                                                                                            85%
                                                                                            85%
                                                                                                                                                                                                                                                                                                                                                                                         wet soil weight − dry soil weight
                                                                                                                                                                                                                                                                                                                                                                   soil moisture (%) =                                        ×100%
                                                                                                                                                                                                                                                                                                                                                                                                 wet soil weight
                                                                        extension
                                                                         vertical
                                                                         Whole

                                                                                            20.4
                                                                                            25.5
                                                                                            19.6
                                                                                            20.6
                                                                                            14.8
                                                                                            16.8
                                                                           (m)

                                                                                                                                                                                                                                                                                                                                                                    Soil organic carbon, soil total nitrogen, and soil total
                                                                                                                                                                                                                                                                                                                                                                 phosphorus concentration were measured on the southerly and
                                                                       depth of root

                                                                       stand height
                                                                       between the

                                                                                                                                                                                                                                                                                                                                                                 northerly aspect in the whole sampling soil depth in Changwu
                                                                         front and
                                                                           Ratio

                                                                                                                                                                                                                                                                                                                                                                 (unpublished data); we found that soil nutrients were concentrated
                                                                                            1.04
                                                                                            2.42
                                                                                            1.52
                                                                                            2.12
                                                                                            1.85
                                                                                            3.17

                                                                                                                                                                                                                                                                                                                                                                 on surface layer (0–40 cm) and varied little with soil depth.
                                                                                                                                                                                                                                                                                                                                                                 Soil organic carbon content was larger on northerly than
                                                                                                                       Different letters for stand height, diameter, and the depth of the root front indicate significant differences among sampling sites on different slope aspects (n = 3, p < 0.05).

                                                                                                                                                                                                                                                                                                                                                                 southerly aspect, while the total nitrogen and phosphorus
                                                                                            11.8 ± 0.21 CD

                                                                                            12.8 ± 0.14 BC
                                                                                            10.4 ± 0.33DE
                                                                         the root front
                                                                         The depth of

                                                                                             9.6 ± 0.96 E
                                                                                             14 ± 0.65 B
                                                                                             18 ± 0.78 A

                                                                                                                                                                                                                                                                                                                                                                 content kept fairly consistent on different slope aspect. Soil
                                                                              (m)

                                                                                                                                                                                                                                                                                                                                                                 organic carbon, total nitrogen, and phosphorus content were
                                                                                                                                                                                                                                                                                                                                                                 largest in Changwu, while they remained roughly similar values
                                                                                                                                                                                                                                                                                                                                                                 in Ansai and Suide (Zhang et al., 2018).
                                                                                            10.53 ± 2.70 ab

                                                                                             6.89 ± 1.89 bc
                                                                                             7.53 ± 1.51 bc
                                                                                             12.05 ± 2.78 a
                                                                                             9.4 ± 2.56 abc
                                                                         breast height

                                                                                              5.30 ± 1.41 c
                                                                          Diameter at

                                                                                                                                                                                                                                                                                                                                                                 Statistical Analysis
                                                                             (cm)

                                                                                                                                                                                                                                                                                                                                                                 A general linear model and multi-way analysis of variance
                                                                                                                                                                                                                                                                                                                                                                 were used to test the effects of the soil depth, slope aspect,
                                                                                                                                                                                                                                                                                                                                                                 site, and the interactions between the slope aspect × site, slope
                                                                                                                                                                                                                                                                                                                                                                 aspect × soil depth, site × soil depth, and slope aspect × soil
                                                                                            7.45 ± 1.57 bc

                                                                                            6.59 ± 1.77 bc
                                                                                            10.03 ± 1.73 a

                                                                                            5.20 ± 0.79 cd
                                                                                            7.75 ± 0.70 b

                                                                                            4.04 ± 0.28 d
                                                                           height (m)

                                                                                                                                                                                                                                                                                                                                                                 depth × site on the fine root diameter, RLD, RAD, and RDWD.
                                                                             Stand

                                                                                                                                                                                                                                                                                                                                                                 The slope aspect and site were treated as fixed effects, and
                                                                                                                                                                                                                                                                                                                                                                 the soil depth as a continuous variable and covariate. F-tests
                                                                                                                                                                                                                                                                                                                                                                 were conducted to assess the significance of the site, slope
                                                                         temperature

                                                                                                                                                                                                                                                                                                                                                                 aspect, and their interaction. We log-transformed the root
                                                                          Maximum

                                                                                            32.2°C
                                                                                            33.4°C
                                                                                            34.5°C
                                                                                            37.1°C
                                                                                            34.2°C
                                                                                            36.8°C
                                                                            daily

                                                                                                                                                                                                                                                                                                                                                                 biomass values to satisfy the requirements for homoscedasticity
                                                                                                                                                                                                                                                                                                                                                                 and normality. All analyses were conducted with SPSS 11.0
                                                                                                                                                                                                                                                                                                                                                                 (SPSS Inc., Chicago, Illinois, United States). Duncan’s test was
                                                                                                                                                                                                                                                                                                                                                                 used to determine significant differences (p < 0.05).
                                                                         cumulative PAR
                                                                          (mol m−2 s−1)
                                                                            Annual

                                                                                            10,062
                                                                                            9,320
                                                                                            9,861
                                                                                            9,440
                                                                                            9,988
                                                                                            9,510

                                                                                                                                                                                                                                                                                                                                                                 RESULTS
                                                                                                                                                                                                                                                                                                                                                                 Fine Root Traits
                                                                             Age (years)

                                                                                                                                                                                                                                                                                                                                                                 The fine roots of the locust trees exhibited similar trends,
                                                                                            37
                                                                                            37
                                                                                            18
                                                                                            18
                                                                                            35
                                                                                            35
               TABLE 2 | Main characteristics of locust tree stands.

                                                                                                                                                                                                                                                                                                                                                                 where RLD, RAD, and RDWD all decreased sharply in the
                                                                                                                                                                                                                                                                                                                                                                 top 2.6 m of the soil, varied slightly from 2.6–5 m, and then
                                                                                                                                                                                                                                                                                                                                                                 remained stable below 5 m (Figure 2). The maximum RLD
                                                                           gradient
                                                                            Slope

                                                                                                                                                                                                                                                                                                                                                                 and RAD occurred in the top 0.2 m on the northerly aspect
                                                                                            37°
                                                                                            36°
                                                                                            33°
                                                                                            31°
                                                                                            29°
                                                                                            32°

                                                                                                                                                                                                                                                                                                                                                                 in Ansai, and the maximum RDWD on the southerly aspect
                                                                                                                                                                                                                                                                                                                                                                 in Changwu. More than 50% of the total RLD was concentrated
                                                                                                                       relative to the sampling plot area.
                                                                             Slope aspect

                                                                                                                                                                                                                                                                                                                                                                 in the upper 2.2 m (except for 3.4 m on the northerly aspect
                                                                                                                                                                                                                                                                                                                                                                 in Changwu) and less than 5% below 8.6 m (Figure 3).
                                                                                            South

                                                                                            South

                                                                                            South
                                                                                            North

                                                                                            North

                                                                                            North

                                                                                                                                                                                                                                                                                                                                                                    We found that trees on southerly aspects had higher RLD,
                                                                                                                                                                                                                                                                                                                                                                 RAD, and RDWD values, except for Suide (Table 3). The total
                                                                                                                                                                                                                                                                                                                                                                 RLD, RAD, and RDWD values decreased as the rainfall decreased
                                                                                                                                                                                                                                                                                                                                                                 on southerly aspects. However, the total RAD and RDWD
                                                                             Location

                                                                                             Changwu

                                                                                                                                                                                                                                                                                                                                                                 increased on northerly aspects, while the total RLD values
                                                                                                               Suide
                                                                                                       Ansai

                                                                                                                                                                                                                                                                                                                                                                 were similar in Ansai and Suide, and greater than those in

Frontiers in Plant Science | www.frontiersin.org                                                                                                                                                                                                                                                                                                             5                                    October 2021 | Volume 12 | Article 684468
Lihui et al.                                                                                                                                         Deep Fine Root Trait

               A                                        B                                  C                                D

               E                                        F                                 G                                 H

               I                                        J                                 K                                 L

  FIGURE 2 | Changes in RAD, RDWD, RLD, and soil moisture down to the root front with soil depth. RAD is the root area density (m2 m−3), RDWD is the root dry
  weight density (g m−3), and RLD is the root length density (m m−3). Dashed lines denote the wilting point at each site. Solid and empty rectangles, circles, and
  triangles represent northerly and southerly aspects at the sites Changwu (A,B,C,D), Ansai (E,F,G,H), and Suide (I,J,K,L), respectively.

Frontiers in Plant Science | www.frontiersin.org                                   6                                            October 2021 | Volume 12 | Article 684468
Lihui et al.                                                                                                                                                          Deep Fine Root Trait

                                                                                                 Changwu. Though fine root traits (RLD, RAD, and RDWD)
                                                                                                 decreased with the rainfall amount, there were no significant
                                                                                                 differences among the three sites (Table 4). The effects of the
                                                                                                 soil depth on RLD, RAD, and RDWD were highly significant
                                                                                                 (p < 0.01). The slope aspect had significantly different effects
                                                                                                 on RLD (p < 0.01) and RAD (p < 0.05) but not on RDWD. The
                                                                                                 mean root diameter varied little and it tended to be uniform
                                                                                                 throughout the whole soil depth (Table 3).

                                                                                                 Vertical Tree Extension
                                                                                                 Our results showed that the vertical extents of the trees varied
                                                                                                 among sites and slope aspect (Figure 4; Table 2). The tree
                                                                                                 height and diameter at breast height decreased as the rainfall
                                                                                                 amount decreased, and they were also higher on northerly
                                                                                                 than southerly aspects (Table 2). The mean root front depth
                                                                                                 also decreased as the rainfall amount decreased, but it was
                                                                                                 much deeper on southerly than northerly aspects in the same
                                                                                                 site, where the difference was significant. Root front depth
                                                                                                 ranged from 9.6 m on the northerly aspect in Suide to 18 m
                                                                                                 on the southerly aspect in Changwu. The heights of the locust
                                                                                                 trees tended to be shorter than the depths of the root front.
                                                                                                 The ratio between the belowground root front depth and
                                                                                                 aboveground tree height ranged from 1.04 to 3.17, which was
                                                                                                 higher on southerly than northerly aspects, and it increased
                                                                                                 as the rainfall amount decreased. The vertical tree extension
                                                                                                 values were also larger on southerly than northerly aspects
                                                                                                 but they decreased as the rainfall amount decreased (Table 2).

                                                                                                 Soil Moisture
                                                                                                 The mean soil moisture contents in the 0–2 m layer were higher
                                                                                                 on northerly than southerly aspects at each site, which were 11.55
                                                                                                 and 7.8% in Changwu, 5.93 and 5.75% in Ansai, and 3.6 and
                                                                                                 3.15% in Suide (lower than the wilting point of 3.7%), respectively.
                                                                                                 However, the tendency of mean soil moisture contents from 2 m
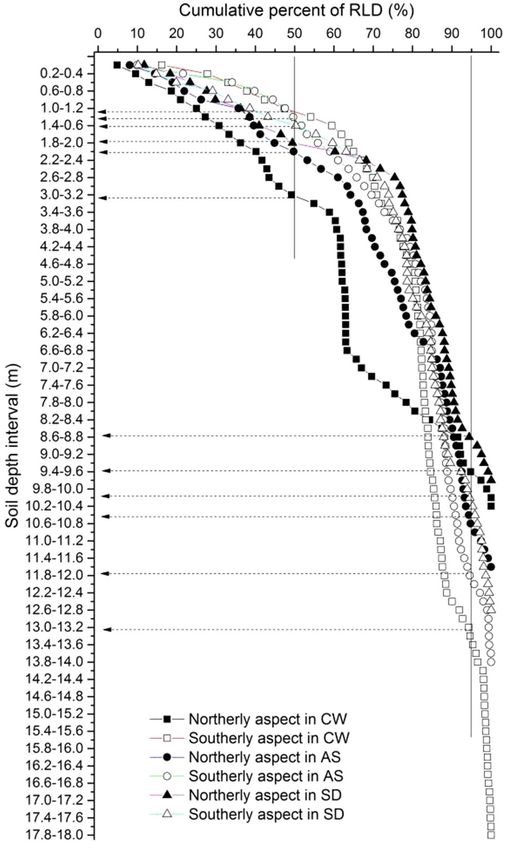
  FIGURE 3 | Cumulative percentages of fine root length density down to the
                                                                                                 to the root front depth was opposite, which were 11.32 and 14.1%
  root front with soil depth. Solid lines denote the 50 and 95% total root length                in Changwu, 5.34 and 6.65% in Ansai, and 3.57 and 3.83% in
  densities. Dashed lines are the corresponding soil depths above which 50                       Suide, respectively. We found that the mean soil moisture contents
  and 95% of the total root length densities are located. Solid and empty                        of the top soil layer were higher on northerly than southerly
  rectangles, circles, and triangles represent northerly and southerly aspects at
                                                                                                 aspects at each site and they decreased as the rainfall decreased.
  the sites Changwu, Ansai, and Suide, respectively.
                                                                                                 The soil moisture contents varied below 2 m (Figures 2D,H,L).

TABLE 3 | Main characteristics of fine roots on different slope aspects.

                                                                                 Soil layer where the
                                                                                      cumulative
                                                         Total root length                                      Total root area        Total root dry weight
Location                        Slope aspect                                     percentage of total                                                         Mean diameter (mm)
                                                          density (m m−3)                                      density (m2 m−3)           density (g m−3)
                                                                                 root length density
                                                                                  occurs (m) D50 D95

                                    North               19397.2 ± 190.2 e                 3.4 9.8                 28.3 ± 0.2 d            1032.6 ± 27.9 f              0.45 ± 0.08 a
Changwu
                                    South               62967.3 ± 611.3 a                1.4 13.6                 90.7 ± 7.8 a            2493.0 ± 69.6 a              0.43 ± 0.08 a
                                    North               29688.3 ± 277.5 c                2.2 10.8                 45.5 ± 1.2 c            1541.9 ± 41.9 d              0.47 ± 0.08 a
Ansai
                                    South               44395.9 ± 414.9 b                1.6 12.2                 62.9 ± 8.9 b            2005.9 ± 54.4 b              0.48 ± 0.08 a
                                    North               29651.1 ± 270.3 c                 2.2 8.6                 47.7 ± 0.2 c            1898.0 ± 50.7 c              0.54 ± 0.09 a
Suide
                                    South               21161.9 ± 201.5 d                1.6 10.2                 30.3 ± 5.1 d            1121.4 ± 30.7 e              0.42 ± 0.07 a

Different lowercase letters for total root length density, total root area density, total root dry weight density, and mean diameter indicate significant differences among sampling sites
on different slope aspects (n = 3, p < 0.05).

Frontiers in Plant Science | www.frontiersin.org                                             7                                                October 2021 | Volume 12 | Article 684468
Lihui et al.                                                                                                                                        Deep Fine Root Trait

TABLE 4 | F-values for the effects of site, slope aspect, and depth, and the interactions between site × slope aspect, site × depth, slope aspect × depth, and site ×
slope aspect × depth based on fine root length density (RLD, m m−3), fine root area density (RAD, m2 m−3), fine root dry weight density (RDWD. g m−3), and fine root
diameter (mm).

                                                         RLD                           RAD                        RDWD                            Diameter

Site                                             F2,372 = 0.901                F2,372 = 0.532                 F2,372 = 0.351                  F2,372 = 3.316
Slope aspect                                     F1,372 = 7.934**              F1,372 = 5.886*                F1,372 = 0.006                  F1,372 = 0.759
Depth                                            F1,372 = 92.038**             F1,372 = 92.602**              F1,372 = 102.883**              F1,372 = 2.223
Site × Slope aspect                              F2,372 = 12.060**             F2,372 = 13.987**              F2,372 = 6.441**                F2,372 = 0.649
Site × Depth                                     F2,372 = 1.134                F2,372 = 1.729                 F2,372 = 1.291                  F2,372 = 1.119
Slope aspect × Depth                             F1,372 = 0.702                F1,372 = 0.460                 F1,372 = 2.116                  F1,372 = 18.109**
Site × Slope aspect × Depth                      F2,372 = 4.912**              F2,372 = 5.758**               F2,372 = 2.013                  F2,372 = 8.009**

*Significant difference at p < 0.05; **significant difference at p < 0.0.

                                                                                            (Bloom et al., 1985). Aronson et al. (1992) also found that
                                                                                            the allocation to roots was higher in an arid population during
                                                                                            the early life stage. While this trend gradually reversed with
                                                                                            age, thereby indicating that the maturing plant allocated more
                                                                                            biomass to seed production rather than roots which might
                                                                                            reflect a strategy for maximizing reproductive production at
                                                                                            the expense of vegetative growth.
                                                                                                Pinheiro et al. (2016) found that the fine root densities
                                                                                            decreased in the topsoil but remained roughly similar at depths
                                                                                            of 0.25 and 6 m. We also found that RLD, RDWD, and RAD
                                                                                            decreased sharply in the top soil, but they remained stable
                                                                                            below 5 m (Figure 2). Schenk and Jackson (2002a) showed
  FIGURE 4 | Mean stand heights and the depth of the root front at Changwu,                 that D50 and D95 were located in the upper 0.3 m and 2 m,
  Ansai, and Suide. Vertical bars indicate standard deviations. Lowercase                   respectively. However, we found that D50 and D95 moved down
  letters indicate significant differences in stand height and uppercase letters            to greater depths, especially D95, according to the experimental
  indicate significant differences in the depth of the root front (n = 3, p < 0.05).        field measurements. The cumulative percentage RLD did not
                                                                                            differ greatly in the shallow layers between northerly and
                                                                                            southerly aspects, where the difference was mainly due to roots
DISCUSSION                                                                                  extending deeper on southerly aspects (Figure 3). Christina
                                                                                            et al. (2011) and Laclau et al. (2013) showed that less than
Deep Root Traits                                                                            5% of the fine root biomass of Eucalyptus grandis seedlings
Our results indicated that the mean RLD, RAD, and RDWD
                                                                                            was present below a depth of 8 m. We obtained similar results
decreased as the rainfall amount decreased. Locust trees on
                                                                                            where less than 5% of the fine RLD was located below 8.6 m
southerly aspects had higher root biomasses, but the opposite
                                                                                            (Figure 3). Christina (2015) reported that very low densities
was found in Suide, possibly because the lower root diameter
                                                                                            of the fine roots of E. grandis below a depth of 10 m could
and weaker growth led to smaller biomasses (Table 3) due
                                                                                            meet most of the water requirements during dry periods after
to severe soil moisture depletion lower than wilting point.
                                                                                            canopy closure. Indeed, an extremely low deep fine root density
We found that the total RLD on southerly aspects was
                                                                                            might contribute to improving tree survival in extremely arid
approximately three times higher in Changwu compared with
                                                                                            regions. We speculated that variability in the rooting depth
that in Suide (Table 3; 62967.3 m m−3 vs. 21161.9 m m−3). A
                                                                                            might be related to the survival of trees on different slope
previous study also showed that the root biomass was four
                                                                                            aspects in arid regions.
times higher in mesic populations (Kurze et al., 2017). Volis
et al. (2002) and Mendola et al. (2015) determined a similar
trend to our results for an annual grass. There may be intensified                          Soil Moisture
plant–plant competition for belowground water and nutrient                                  Plants can maintain a balance between the supply and demand
resources in mesic environments (Metz and Tielbőrger, 2016).                                of water by regulating the proportions of the aboveground
If the competition supersedes the effect of regional climate                                and belowground plant parts (Tian et al., 2014). Tian et al.
on the availability of belowground resource, i.e., less resources                           (2014) reported that the root: shoot ratio increased when
are available per individual in mesic sits, then the allocation                             Haloxylon seedlings suffered from severe water stress and a
of resources to the roots will be higher in a mesic environment                             new water balance mechanism formed, which facilitated survival
compared with an arid environment (Kurze et al., 2017).                                     under soil moisture contents below 1.5%. We found that root
However, these results were opposite to those predicted by                                  front depth and root biomass (RLD, RAD, and RDWD) decreased
optimal resource partitioning, where the investment in roots                                as rainfall amount decreased and rainfall amount was positively
was expected to be higher under lower soil water conditions                                 related to soil moisture in the whole soil layer in three sampling

Frontiers in Plant Science | www.frontiersin.org                                        8                                      October 2021 | Volume 12 | Article 684468
Lihui et al.                                                                                                                      Deep Fine Root Trait

sites. Severe soil moisture depletion up to the wilting point               reduced root in northerly aspect may reflect the strategy of
of 3.7% in Suide led to slow and stagnant growth, where the                 belowground part to maximize reproductive allocation (Kurze
locust trees tended to be smaller and older, probably because               et al., 2017). Thus, the locust trees appear to have adapted to
of the rapid growth and high consumption of soil water in                   the different water conditions caused by the different slope
the early stage, and soil moisture could not meet the water                 aspects, where they exhibited diverse survival strategies (vertical
requirements and environmental deterioration occurred                       tree extension, i.e., tree height plus rooting depth) to cope
accompanied by soil dry layer and degraded forest.                          with drought. Petrů et al. (2006) obtained similar results and
    The infiltration of rainfall is quite complex and it is primarily       found that the height of Biscutella was lower in arid populations.
influenced by factors, such as the soil texture, soil pore space,           May et al. (2013) and Šímová et al. (2015) also found that
soil surface feature, slope position, and slope gradient. Ribolzi           the rooting depth differed greatly between northerly and southerly
et al. (2011) found that the infiltration depth increased as the            aspects, where the tree height varied along a regional rainfall
slope gradient increased. However, Jiang and Huang (1984)                   gradient. However, Christina et al. (2011) showed that the
showed that the infiltration of rainfall decreased as the slope             vertical tree extents above and below ground were almost the
gradient increased due to the gradual decrease in the infiltration          same in Eucalyptus plantations in Brazil. Kurze et al. (2017)
rate and increased runoff. Thus, the soil moisture content was              suggested that the relative investment in the root: shoot ratio
higher on gentle slopes than steep slopes. In our study, we selected        was higher in mesic populations. However, we found that the
similar slope positions and soil surface feature to avoid the               ratio of the rooting depth relative to the tree height increased
influence of rainfall infiltration. The soil moisture is an important       as the rainfall amount decreased, thereby indicating that the
factor for root growth (Zhou and Shangguan, 2007). We found                 locust trees allocated more biomass to the belowground parts
that the mean soil moisture content in the 0–2 m depth was                  to cope with drought conditions.
higher on northerly than southerly aspects at each site                        Larson and Funk (2016) suggested that the rooting depth
(Figures 2D,H,L), possibly due to the greater photosynthetically            may be the key factor for differentiating the performance of
active radiation and higher evapotranspiration on southerly                 plants under drought conditions. However, few previous studies
compared with northerly aspects. Our results are consistent                 have determined the correlation between the rooting depth
with those reported by Deng and Zhang (2010), whereas Sun                   and the mean annual rainfall. Bhattachan et al. (2012) reported
et al. (2007) obtained the opposite results in the 1 m surface              that there was no obvious relationship between the rooting
layer. Wang (2017) found that the soil moisture content was                 depth and mean annual precipitation in water-limited ecosystem.
higher in the topsoil and the tree height was lower on a shady              Zhou et al. (2020) found that the potential rooting depth was
slope compared with a sunny slope, where the main factor                    negatively correlated with the mean annual rainfall across
related to tree growth was soil aeration rather than the water              Southern African savannas, and they suggested that the root
content. We concluded that the soil moisture in the topsoil                 strategies were highly diverse in more arid sites. They estimated
might have been affected by environmental factors, such as                  that the rooting depth was 4.58 m for drought-resistant Birrea
rainfall and soil transpiration, but the soil moisture content              based on an exponential decay function. However, we determined
in the deep soil may have reflected differences of long-term                deeper rooting depths by conducting full vertical excavations
rainfall in the soil and deep root characteristics, where an                and based on actual measurements. Contrary to our hypothesis,
alternating pattern was detected at different sites                         we found that the rooting depth and vertical tree extension
(Figures 2D,H,L).                                                           all decreased as the rainfall amount decreased (Figure 4).
                                                                            Yu et al. (2002) showed that annual rainfall of 550 mm was
                                                                            the boundary for the vegetation type distribution from forest
Effects of Slope Aspect on Tree Height and                                  steppe to forest vegetation. Our experimental areas had annual
Rooting Depth                                                               rainfall amounts ranging from 443 to 580 mm (Table 1). Thus,
In contrast to our hypothesis, we found that the effect of the              the difference in the annual rainfall combined with the
slope aspect was greater on the belowground plant parts than                evapotranspiration produced by the slope aspect could have
the aboveground parts (Figure 4). The locust trees had greater              affected plant growth, thereby reflecting the plant survival
rooting depths and smaller tree heights on southerly aspects                strategy. The locust trees were relatively vigorous in terms of
than northerly aspects, possibly because the southerly aspects              both their aboveground and belowground parts in the areas
could receive more solar radiation, thereby leading to greater              with more rainfall, but not in arid areas because the low rainfall
transpiration and lower relative humidity, and the available                and poor water supply led to weaker growth. We considered
soil moisture by locust trees in surface soil layer was less,               that the rooting depth could be used as a single indicator to
thus exhibited smaller tree height. As we all know, the                     represent a plant’s survival strategy, and the tree height combined
aboveground growth depended on the water taken up by the                    with the rooting depth as two criteria to understand the strategy
roots (Salmerón-Miranda et al., 2007), we found that root                   employed by a plant to adapt to drought stress.
extended deeper in southerly than northerly aspect, which                      The changes in the rooting pattern with stand age might
showed that root could absorb deeper water from deeper soil                 vary according to the root adaptation strategies relative to the
layer to sustain plant growth, while it did not indicate a lower            availability of water and nutrients. Zhang et al. (2018) obtained
water moisture content because the mean deep soil moisture                  a curve with a single peak for the roots as the trees aged, and
content was calculated from 2 m to the root front depth., The               the coefficient of the rooting distribution to stand age (β) peaked

Frontiers in Plant Science | www.frontiersin.org                        9                                    October 2021 | Volume 12 | Article 684468
Lihui et al.                                                                                                                                       Deep Fine Root Trait

in 18-year-old locust trees (β = 0.9912) with a greater rooting                        functional traits that determine plant growth in drought-affected
depth but then decreased sharply in 35-year-old stands (β = 0.9847)                    areas. We found that the rooting depth of locust trees was positively
with a shallower rooting depth. Chang et al. (2012) found that                         correlated with the mean annual rainfall, but further studies of
the rooting patterns were similar for 8- and 30-year-old locust                        the shifts in the belowground root traits (e.g., root xylem size)
stands in the Loess Plateau region. However, we could only                             and aboveground functional traits (e.g., leaf area) are needed to
investigate 18-year-old locust trees in the area sampled in Ansai.                     advance our understanding of the roles of the roots in the response
In addition, we found that the 18-year-old locust trees in Ansai                       to drought (Choat et al., 2018). Nevo (2012) suggested that
were in a vigorous growth stage, whereas the trees aged over                           differences in the slope aspect may be suitable for assessing the
35 years were in a stage of decline in Suide and Changwu                               mechanisms that allow plants to adapt to different environments
(Table 2). According to a study by Zhang et al. (2018), the                            under climate change. Considering both the aboveground and
rooting depth might have become shallower with age in Ansai,                           belowground effects will be critical for predicting future changes
and it would be greater in Changwu than Ansai at the same                              in forest ecosystem function (Collins et al., 2020). Our results
stand age. The difference between Ansai and Suide means that                           provide useful insights into how environmental factors might
it is also necessary to compare tree samples with similar ages.                        control the belowground and aboveground functional traits of plants.
    The rooting depth and biomass allocation are important
belowground functional traits (Liu and Ma, 2015). Our deep
sampling procedure was laborious and time consuming, so                                DATA AVAILABILITY STATEMENT
we only sampled three trees on each slope aspect per site. The
sample size was limited but given the valuable quantitative data                       The original contributions presented in the study are included
obtained, we consider that sampling three trees may have been                          in the article/supplementary material, and further inquiries
representative of the actual root distributions. We found only                         can be directed to the corresponding author.
a few roots with lengths of about 1 cm below 2 m in the soil
cores, and our previous study also showed that that deep root
biomass varied little with the age of the trees (Ma et al. 2013).                      AUTHOR CONTRIBUTIONS
We concluded that a few deep root observed in our study might
play an important role in improving locust tree resistance to                          ML and LX were responsible for manuscript drafting and editing.
drought and sustaining tree growth. Our sampling was an                                WY was contributed to experimental design and analysis. YJ
integration of annual growth that encompassed the water                                was contributed to field sampling and root cleaning. CJ was
availability of the year given the limited infiltration of the periodic                contributed to interprate the data of work, and revise our
rainfall events. As described above, rainfall infiltration depth                       manuscript critically. All authors contributed to the article and
was no more than 2 m (Liu et al., 2010), deep soil moisture                            approved the submitted version.
(below 2 m) would not affected by the periodic rainfall, i.e., the
wettest part of the year versus both wet and dry period, it
could reflect the effect of long-term meteorological factors on                        FUNDING
local area, rather than the short-term ones. Ma et al. (2012)
also showed that the root density decreased with the horizontal                        This study was supported by the National Science Foundation
distance from the tree trunk. Thus, the coring points selected                         of China (project number 41671510) and the Key Program
in our study in the same position relative to the tree trunk                           of Research and Development in Shaanxi Province (project
might have avoided differences in the horizontal root distribution.                    number 2020NY-155).
The specific sampling positions might have influenced the shallow
root distribution more than that of the deep roots. Therefore,
comparing the deep root distribution at the same horizontal                            ACKNOWLEDGMENTS
sampling position in different sites was a suitable approach.
    The rooting depth is recognized as a key trait that underlies                      We would like to thank the instrument shared platform of
the resistance or resilience of trees under drought events (Nardini                    Food Science and Engineering College of NWAFU for assistance
and Valentino, 2016). Our findings suggest that the vertical                           with the freeze dryer and impendance analysis. We are grateful
extension of the rooting depth and tree height might be key                            to Duncan Jackson for correcting the English language.

                                                                                       Bhattachan, A., Tatlhego, M., Dintwe, K., O’Donnell, F., Caylor, K. K., et al.
REFERENCES                                                                                (2012). Evaluating ecohydrological theories of woody root distribution in
Akkermans, T., Lauwaet, D., Demuzere, M., Vogel, G., Nouvellon, Y., Ardö, J.,             the Kalahari. PLoS One 7:e33996. doi: 10.1371/journal.pone.0033996
   et al. (2012). Validation and comparison of two soil-vegetation-atmosphere          Bloom, A. J., Chapin, F. S. C., and Mooney, H. A. (1985). Resource limitation
   transfer models for tropical Africa. J. Geophys. Res. Biogeosci. 117, 1–15.            in plants - an economic analogy. Annu. Rev. Ecol. Syst. 16, 363–392. doi:
   doi: 10.1029/2011JG001802                                                              10.1146/annurev.es.16.110185.002051
Aronson, J., Kigel, J., Shmida, A., and Klein, J. (1992). Adaptive phenology of        Burke, M. K., and Raynal, D. J. (1994). Fine root growth phenology, production,
   desert and Mediterranean populations of annual plants grown with and                   and turnover in a northern hardwood forest ecosystem. Plant Soil 162,
   without water stress. Oecologia 89, 17–26. doi: 10.1007/BF00319010                     135–146. doi: 10.1007/BF01416099

Frontiers in Plant Science | www.frontiersin.org                                  10                                          October 2021 | Volume 12 | Article 684468
Lihui et al.                                                                                                                                                   Deep Fine Root Trait

Cantón, Y., Del Barrio, G., Solé-Benet, A., and Lázaro, R. (2004). Topographic                  hilly-gullied loess plateau. J. Northwest. Univ. 28, 12–18. doi: 10.3969/j.
    controls on the spatial distribution of ground cover in the Tabernas badlands               issn.1001-7461.2013.01.03
    of SE Spain. Catena 55, 341–365. doi: 10.1016/S0341-8162(03)00108-5                      Kurze, S., Bareither, N., and Metz, J. (2017). Phenology, roots and reproductive
Chahine, M. T. (1992). The hydrological cycle and its influence of climate.                     allocation, but not the LHS scheme, shape ecotypes along an aridity gradient.
    Nature 359, 373–380. doi: 10.1038/359373a0                                                  Perspect. Plant. Ecol. Evol. Syst. 29, 20–29. doi: 10.1016/j.ppees.2017.09.004
Chang, R. Y., Fu, B. J., Liu, G. H., Yao, X. L., and Wang, S. (2012). Effects                Laclau, J. P., da Silva, E. A., Rodrigues Lambais, G., Bernoux, M., le Maire, G.,
    of soil physicochemical properties and stand age on fine root biomass and                   Stape, J. L., et al. (2013). Dynamics of soil exploration by fine roots down
    vertical distribution of plantation forests in the loess Platear of China. Ecol.            to a depth of 10 m throughout the entire rotation in Eucalyptus grandis
    Res. 27, 827–836. doi: 10.1007/s11284-012-0958-0                                            plantations. Front. Plant Sci. 4:243. doi: 10.3389/fpls.2013.00243
Choat, B., Brodribb, T. J., Brodersen, C. R., Duursma, R. A., Lopez, R., and                 Larson, J. E., and Funk, J. L. (2016). Seedling root responses to soil moisture
    Medlyn, B. E. (2018). Triggers of tree mortality under drought. Nature 558,                 and the identification of a belowground trait spectrum across three growth
    531–539. doi: 10.1038/s41586-018-0240-x                                                     forms. New Phytol. 210, 827–838. doi: 10.1111/nph.13829
Christina, M (2015) Modeling the Water-Carbon Cycles at Tree Scale in Eucalyptus             Liu, J., and Diamond, J. (2005). China’s environment in a globalizing world.
    Plantations under Contrasting Water and Nutrient Constraints. France:                       Nature 435:1179. doi: 10.1038/4351179a
    SupAgro Montpellier.                                                                     Liu, X. J., and Ma, K. P. (2015). Plant functional traits-concepts, applications
Christina, M., Laclau, J. P., Gonçalves, J. L. M., Jourdan, C., Nouvellon, Y.,                  and future directions. Scientia. Sinica. Vitae. 45, 325–339. doi: 10.1360/
    and Bouillet, J. P. (2011). Almost symmetrical vertical growth rates above                  N052014-00244
    and below ground in one of the world's most productive forests. Ecosphere                Liu, X. L., Ma, L. H., Yang, R. H., Wu, P. T., and Wang, Y. K. (2014). Deep
    2, 1–10. doi: 10.1890/ES10-00158.1                                                          soil water depletion characteristic of jujube plantation in loess semiarid
Collins, D. B. G., and Bras, R. L. (2007). Plant rooting strategies in water-                   region. Trans. Chin. Soc. Agric. Mach. 45, 139–145. doi: 10.6041/ j.
    limited ecosystems. Water Resour. Res. 43:W06407. doi: 10.1029/2006WR005541                 issn.1000-1298.2014.12.021
Collins, C. G., Spasojevic, M. J., Alados, C. L., Aronson, E. L., Benavides, J. C.,          Liu, W., Zhang, X. C., Dang, T., Ouyang, Z., Li, Z., Wang, J., et al. (2010).
    Cannone, N., et al. (2020). Belowground impacts of alpine woody encroachment                Soil water dynamics and deep soil recharge in a record wet year in the
    are determined by plant traits, local climate and soil conditions. Glob. Chang.             southern loess plateau of China. Agric. Water Manag. 97, 1133–1138. doi:
    Biol. 26, 7112–7127. doi: 10.1111/gcb.15340                                                 10.1016/j.agwat.2010.01.001
Deng, L., and Zhang, W. H. (2010). Natural development pattern of Robinia                    Ma, L. H., Liu, X. L., Wang, Y. K., and Wu, P. T. (2013). Effects of drip
    pseudoacacia plantations in loess hilly region. Sci. Silvae Sin. 46, 15–22.                 irrigation on deep root distribution, rooting depth, and soil water profile
    doi: 10.11707/j.1001-7488.20101203                                                          of jujube in a semiarid region. Plant Soil 373, 995–1006. doi: 10.1007/
Duan, L., Huang, M., Li, Z., Zhang, Z., and Zhang, L. (2017). Estimation of                     s11104-013-1880-0
    spatial mean soil water storage using temporal stability at the hillslope scale          Ma, L. H., Wu, P. T., and Wang, Y. K. (2012). Spatial distribution of roots in
    in black locust (Robinia pseudoacacia) stands. Catena 156, 51–61. doi:                      a dense jujube plantation in the semiarid hilly region of the Chinese loess
    10.1016/j.catena.2017.03.023                                                                plateau. Plant Soil 354, 57–68. doi: 10.1007/s11104-011-1041-2
Fan, Y. Q., Zhou, G. M., Shi, Y. J., Dong, D. J., and Zhou, Y. F. (2012).                    Maeght, J. L., Rewald, B., and Pierret, A. (2013). How to study deep roots—
    Relationship of slope aspect and positon on biomass and carbon storage                      and why it matters. Front. Plant Sci. 4:299. doi: 10.3389/fpls.2013.00299
    in a Phyllostachys edulis stand. J. Zhejiang. Agric. Univ. 29, 321–327. doi:             May, F., Giladi, I., Ristow, M., Ziv, Y., and Jeltsch, F. (2013). Plant functional
    10.11833/j.issn.2095-0756.2012.03.001                                                       traits and community assembly along interacting gradients of productivity
Finkel, M., Fragman, O., and Nevo, E. (2001). Biodiversity and interslope                       and fragmentation. Perspect. Plant. Ecol. Evol. Syst. 15, 304–318. doi: 10.1016/j.
    divergence of vascular plants caused by sharp microclimatic differences at                  ppees.2013.08.002
    “evolution canyon II”, lower Nahal Keziv, upper Galilee. Israel. Isr. J Plant            Mendola, M. L., Baer, S. G., Johnson, L. C., and Maricle, B. R. (2015). The
    Sci 49, 285–296. doi: 10.1560/H8TG-HL9L-2D2P-TAGJ                                           role of ecotypic variation and the environment on biomass and nitrogen
Freycon, V., Wonkam, C., Fayolle, A., Laclau, J.-P., Lucot, E., Jourdan, C., et al.             in a dominant prairie grass. Ecology 96, 2433–2445. doi: 10.1890/14-1492.1
    (2014). Tree roots can penetrate deeply in African semi-deciduous rain                   Metz, J., and Tielbőrger, K. (2016). Spatial and temporal aridity gradients provide
    forests: evidence from two common soil types. J. Trop. Ecol. 31, 13–23.                     poor proxies for plant-plant interactions under climate change: a large-scale
    doi: 10.1017/S0266467414000595                                                              experiment. Funct. Ecol. 30, 20–29. doi: 10.1111/1365-2435.12599
Guo, X. P., Zhu, J. Z., Yu, X. X., and Luo, J. (1998). The preliminary discussion            Nardini, A., Valentino, C., Borgo, A. D., Savi, T., Stenni, B., Bertoncin, P.,
    of reforming the low-yield locust in loess plateau. Res. Soil. Water. Conserv.              et al. (2016). Rooting depth, water relations and non-structural carbohydrate
    5, 77–82.                                                                                   dynamics in three woody angiosperms differentially affected by an extreme
Gutiérrez-Jurado, H. A., Vivoni, E. R., Cikoski, C., Harrison, J. B. J., Bras, R. L.,           summer drought. Plant. Cell. Environ. 39, 618–627. doi: 10.1111/pce.12646
    and Istanbulluoglu, E. (2013). On the observed ecohydrologic dynamics of                 Nepstad, D. C., de Carvalho, C. R., Davidson, E. A., Jipp, P. H., Lefebvre, P. A.,
    a semiarid basin with aspect-delimited ecosystems. Water Resour. Res. 49,                   Negreiros, G. H., et al. (1994). The role of deep roots in the hydrological
    8263–8284. doi: 10.1002/2013WR014364                                                        and carbon cycles of Amazonian forests and pastures. Nature 372, 666–669.
Hijioka, Y., E. Lin, J. J., Pereira, R. T., Corlett, X, Cui, G. E., Insarov, R. D.,             doi: 10.1038/372666a0
    Lasco, E., Lindgren, A. S. (2014). Asia. In: Climate Change 2014: Impacts,               Nevo, E. (2012). “evolution canyon,” a potential microscale monitor of global
    Adaptation, and Vulnerability. Part B: Regional Aspects. Contribution of                    warming across life. Proc. Natl. Acad. Sci. U. S. A. 109, 2960–2965. doi:
    Working Group II to the Fifth Assessment Report of the Intergovernmental                    10.1073/pnas.1120633109
    Panel on Climate Change. [Barros, V.R., Field, C.B. (eds.)]. Cambridge                   Nicolescu, V. N., Hernea, C., Bakti, B., Keser, Z., Antal, B., and Rédei, K.
    University Press, Cambridge, United Kingdom and New York, NY, USA, pp.                      (2018). Black locust (Robinia pseudoacacia L.) as a multi-purpose tree species
    1327–1370.                                                                                  in Hungary and Romania: a review. J. For. Res. 29, 1449–1463. doi: 10.1007/
IPCC, Stocker, T., Qin, D., Plattner, G. K., Tignor, M., Allen, S. K., et al.                   s11676-018-0626-5
    (2013). The physical science basis. Contrib. Work. Group I. Fifth. Assess.               Niinemets, U. (2006). The controversy over traits conferring shade-tolerance
    Rep. Intergovernmental. Panel. Clim. Change 996.                                            in trees: ontogenetic changes revisited. J. Ecol. 94, 464–470. doi: 10.1111/j.
Jia, X. X., Shao, M. A., Zhu, Y. J., and Luo, Y. (2017). Soil moisture decline                  1365-2745.2006.01093.x
    due to afforestation across the loess plateau, China. J. Hydrol. 546, 113–122.           Oliveira, R. S., Bezerra, L., Davidson, E. A., Pinto, F., Klink, C. A., Nepstad, D. C.,
    doi: 10.1016/j.jhydrol.2017.01.011                                                          et al. (2005). Deep root function in soil water dynamics in cerrado savannas
Jiang, D. S., and Huang, G. J. (1984). Simulation test of the influence of slope                of Central Brazil. Funct. Ecol. 19, 574–581. doi: 10.1111/j.1365-2435.
    gradient on rainfall infiltration. Bull. Soil. Water. Conserv. 4, 10–13. doi:               2005.01003.x
    10.13961/j.cnki.stbctb.1984.04.003                                                       Peel, M. C., Filayson, B. L., and McMahon, T. A. (2007). Updated world map
Kou, M., Jiao, J. Y., Du, H. D., WANG, Z. J., Wang, Q. L., and Su, Y. (2013).                   of the Köppen-Geiger climate classification. Hydrol. Earth Syst. Sci. 11,
    Species diversity and biomass of herbosa at different site conditions in the                1633–1644. doi: 10.5194/hess-11-1633-2007

Frontiers in Plant Science | www.frontiersin.org                                        11                                              October 2021 | Volume 12 | Article 684468
Lihui et al.                                                                                                                                                     Deep Fine Root Trait

Petrů, M., Tielbörger, K., Belkin, R., Sternberg, M., and Jeltsch, F. (2006). Life            Volis, S., Mendlinger, S., and Ward, D. (2002). Differentiation in populations
   historyvariation in an annual plant under two opposing environmental                          of Hordeum spontaneum Koch along a gradient of environmental productivity
   constraints along an aridity gradient. Ecography 29, 66–74. doi: 10.1111/j.2005.              and predictability: plasticity in response to water and nutrient stress. Biol.
   0906-7590.04310.x                                                                             J. Linn. Soc. 75, 301–312. doi: 10.1111/j.1095-8312.2002.tb02071.x
Phillips, D. L., and Macmahon, J. A. (1981). Competition and spacing patterns                 Wang, Q. H. (2017). Effects of aspect and soil texture on growth of Robinia
   in desert shrubs. J. Ecol. 69, 97–115. doi: 10.2307/2259818                                   pseudoacacia. Prot. Sci. Technol., 6, 28–30. doi: 10.5846/stxb201309092241
Pinheiro, R. C., De Deus, J. C., Nouvellon, Y., Campoe, O. C., Stape, J. L.,                  Wang, R., and Gao, Q. (2003). Climate-driven changes in shoot density and
   Aló, L. L., et al. (2016). A fast exploration of very deep soil layers by                     shoot biomass in Leymus chinensis (Poaceae) on the north-East China
   eucalyptus seedlings and clones in Brazil. For. Ecol. Manag. 366, 143–152.                    transect (NECT). Glob. Ecol. Biogeogr. 12, 249–259. doi: 10.1046/j.1466-
   doi: 10.1016/j.foreco.2016.02.012                                                             822X.2003.00027.x
Reich, P. B., Wright, I. J., Cavender-Bares, J., Craine, M., Oleksyn, J., Westoby, M.,        Wang, Z. Q., Liu, B. Y., Liu, G., and Zhang, Y. X. (2009). Soil water depletion
   et al. (2003). The evolution of plant functional variation: traits, spectra,                  depth by planted vegetation on the loess plateau. Sci. China. Ser D 52,
   and strategies. Int. J. Plant Sci. 164, S143–S164. doi: 10.1086/374368                        835–842. doi: 10.1007/S11430-009-0087-y
Ribolzi, O., Patin, J., Bresson, L. M., Latsachack, K. O., Mouche, E.,                        Wei, Y. C., Liu, Z. X., and Kang, L. L. (2004). Derivation and verification of
   Sengtaheuanghoung, O., et al. (2011). Impact of slope gradient on soil                        soil hydrodynamic parameters in cinnamon soil. J. Hydraul. Eng. 3, 81–85.
   surface features and infiltration on steep slopes in northern Laos. Geomorphology             doi: 10.13243/j.cnki.slxb.2004.03.014
   127, 53–63. doi: 10.1016/j.geomorph.2010.12.004                                            Yu, W.D., Min, Q. W., and Li, G. (2002). The features of precipitation in the
Rozendaal, D. M. A., Hurtado, V. H., and Poorter, L. (2006). Plasticity in leaf                  loess plateau and its possible impacts on vegetation distribution. Res. Sci.
   traits of 38 tropical tree species in response to light; relationships with                   6, 55–60. doi: 1007-7588( 2002) 06 -0055-06
   light demand and adult stature. Funct. Ecol. 20, 207–216. doi: 10.1111/j.1365-             Zhang, Z. D., Huang, M. B., and Zhang, Y. K. (2018). Vertical distribution of
   2435.2006.01105.x                                                                             fine-root area in relation to stand age and environmental factors in black
Salmerón-Miranda, F., Båth, H., Eckersten, H., Forkman, J., and Wivstad, M.                      locust (Robinia pseudoacacia) forests of the Chinese loess plateau. Can. J.
   (2007). Aboveground nitrogen in relation to estimated total plant uptake                      For. Res. 48, 1148–1158. doi: 10.1139/cjfr-2018-0149
   in maize and bean. Nutr. Cycl. Agroecosyst. 79, 125–139. doi: 10.1007/s10705-              Zhou, Z. C., and Shangguan, Z. P. (2007). Vertical distribution of fine roots
   007-9102-x                                                                                    in relation to soil factors in Pinus tabulaeformis Carr. Forest of the loess
Schenk, H. J., and Jackson, R. B. (2002a). The global biogeography of roots.                     plateau of China. Plant Soil 291, 119–129. doi: 10.1007/s11104-006-9179-z
   Ecol. Monogr. 72, 311–328. doi: 10.1890/0012-9615(2002)072[0311:TGBOR]2                    Zhou, Y., Wigley, B. J., Case, M. F., Coetsee, C., and Staver, A. C. (2020).
   .0.CO;2                                                                                       Rooting depth as a key woody functional trait in savannas. New Phytol.
Šímová, I., Violle, C., Kraft, N. J. B., Storch, D., Svenning, J.-C., Boyle, B.,                 227, 1350–1361. doi: 10.1111/nph.16613
   et al. (2015). Shifts in trait means and variances in north American tree                  Zhu, Y. J., Jia, X., and Shao, M. (2018). Loess thickness variations Across the
   assemblages: species richness patterns are loosely related to the functional                  loess plateau of China. Surv. Geophys. 39, 715–727. doi: 10.1007/
   space. Ecography 38, 649–658. doi: 10.1111/ecog.00867                                         s10712-018-9462-6
Sun, T., Dong, L. L., Mao, Z. J., and Li, Y. Y. (2015). Fine root dynamics of
   trees and understorey vegetation in a chronosequence of Betula platyphylla                 Conflict of Interest: The authors declare that the research was conducted in
   stands. For. Ecol. Manag. 346, 1–9. doi: 10.1016/j.foreco.2015.02.035                      the absence of any commercial or financial relationships that could be construed
Sun, Y. L., Wang, H. Y., and Liu, X. P. (2007). Soil water of artifical Robinia               as a potential conflict of interest.
   pseudoacacia L. on loess plateau. J. Qingdao. Univ. (Nat. Sci. Ed) 24, 123–126.
   doi: 10.01-3717(2007)02-0123-04                                                            Publisher’s Note: All claims expressed in this article are solely those of the
Tian, Y., Tashpolat, T., Li, Y., Tang, L. S., and Fan, L. L. (2014). The survival             authors and do not necessarily represent those of their affiliated organizations,
   and above/below ground growth of Haloxylon ammodendron seedling. Acta                      or those of the publisher, the editors and the reviewers. Any product that may
   Ecol. Sin. 34, 2012–2019. doi: 10.5846/stxb201309092241                                    be evaluated in this article, or claim that may be made by its manufacturer, is
Vadez, V. (2014). Root hydraulics: the forgotten side of roots in drought                     not guaranteed or endorsed by the publisher.
   adaptation. Field. Crops. Res. 165, 15–24. doi: 10.1016/j.fcr.2014.03.017
Vitória, A. P., Alves, L. F., and Santiago, L. S. (2019). Atlantic forest                     Copyright © 2021 Lihui, Xiaoli, Jie, Youke and Jingui. This is an open-access article
   and leaf traits: an overview. Trees 33, 1535–1547. doi: 10.1007/                           distributed under the terms of the Creative Commons Attribution License (CC BY).
   s00468-019-01864-z                                                                         The use, distribution or reproduction in other forums is permitted, provided the original
Volis, S. (2007). Correlated patterns of variation in phenology and seed production           author(s) and the copyright owner(s) are credited and that the original publication
   in populations of two annual grasses along an aridity gradient. Evol. Ecol.                in this journal is cited, in accordance with accepted academic practice. No use,
   21, 381–393. doi: 10.1007/s10682-006-9108-x                                                distribution or reproduction is permitted which does not comply with these terms.

Frontiers in Plant Science | www.frontiersin.org                                         12                                               October 2021 | Volume 12 | Article 684468
You can also read