Effects of internal and external velocity on the perceived direction of the double-drift illusion
←
→
Page content transcription
If your browser does not render page correctly, please read the page content below
Journal of Vision (2021) 21(8):2, 1–9                                                                                                                             1

          Effects of internal and external velocity on the perceived
          direction of the double-drift illusion
                                                                                       Department of Psychological and Brain Sciences,
          Nathan H. Heller                                                                     Dartmouth College, Hanover, NH, USA

                                                                                       Department of Psychological and Brain Sciences,
          Nisha Patel*                                                                         Dartmouth College, Hanover, NH, USA

                                                                                       Department of Psychological and Brain Sciences,
          Victoria M. Faustin*                                                                 Dartmouth College, Hanover, NH, USA

                                                                                       Department of Psychological and Brain Sciences,
                                                                                               Dartmouth College, Hanover, NH, USA
                                                                                          Department of Psychology, Glendon College,
          Patrick Cavanagh                                                                   CVR York University, Toronto, ON, Canada

                                                                                       Department of Psychological and Brain Sciences,
          Peter U. Tse                                                                         Dartmouth College, Hanover, NH, USA

          In the double-drift illusion, the combination of the                                     motion shifts an object’s perceived position, as in the
          internal and external motion vectors produces large                                      flash-lag, the flash-grab, and the flash-drag illusions
          misperceptions of both position and direction of                                         (Cavanagh & Anstis, 2013; Eagleman & Sejinowski,
          motion. Here, we investigate the role that speed plays in                                2007; Whitney, 2002); in other cases, it also changes
          determining how these two sources of motion are                                          the perceived motion speed or direction (Dunker,
          combined to produce the double-drift illusion. To                                        1929; Kwon, Tadin, & Knill, 2015; Wallach, Bacon, &
          address this question, we measure the size of the                                        Schulman, 1978).
          illusion at seven internal speeds combined with six                                         The double-drift illusion (Lisi & Cavanagh, 2015;
          external speeds. We find that the illusion increases with                                 also called “the curveball illusion,” Kwon et al., 2015;
          increasing internal speed and decreases with increasing                                  Shapiro, Lu, Huang, Knight, & Ennis, 2010; and
          external speed. We model this by combining the                                           “infinite regress illusion,” Tse & Hsieh, 2006) is a
          external and internal vectors to produce the resulting,
                                                                                                   dramatic example of this second class of MIPS. Here,
          illusory direction (Tse & Hsieh, 2006). The relative effect
          of the two vectors is specified by a constant K in this                                   two motion signals from a single object are combined
          model and the data reveal that K decreases linearly as                                   to produce a misperception of where the object is
          external speed increases. This critical role of external                                 and where it appears to be going. The first motion
          speed in modulating the vector combination uncovers                                      signal, referred to here as the “external drift,” is the
          new details about how the visual system combines                                         displacement of the object itself across the screen. The
          different sources of motion information to produce a                                      second motion signal, referred to here as the “internal
          global motion percept.                                                                   drift,” is created by a translating internal texture
                                                                                                   confined within the object’s boundary. The two motion
                                                                                                   vectors combine to produce large misperceptions of
            Introduction                                                                           position and direction. The magnitude of this illusory
                                                                                                   effect is usually described in terms of its change in
            Illusory motion-induced position shifts (MIPS)                                         direction, the angle by which the external drift is rotated
          occur when the presence of one or more motion signals                                    away from the object’s physical direction (Cavanagh &
          causes a divergence between the physical position of an                                  Tse, 2019; Lisi & Cavanagh, 2015; Massendari, Lisi,
          object (i.e. where it is on the display) and its perceived                               Collins, & Cavanagh, 2018; see Figure 1A; Tse & Hsieh,
          position (i.e. where it appears to be). In some cases, the                               2006).

          Citation: Heller, N. H., Patel, N., Faustin, V. M., Cavanagh, P., & Tse, P. U. (2021). Effects of internal and external velocity on the
          perceived direction of the double-drift illusion. Journal of Vision, 21(8):2, 1–9, https://doi.org/10.1167/jov.21.8.2.
          https://doi.org/10.1167/jov.21.8.2                Received November 22, 2020; published August 2, 2021                     ISSN 1534-7362 Copyright 2021 The Authors

                            This work is
Downloaded from jov.arvojournals.org  onlicensed under a Creative Commons Attribution-NonCommercial-NoDerivatives 4.0 International License.
                                           08/03/2021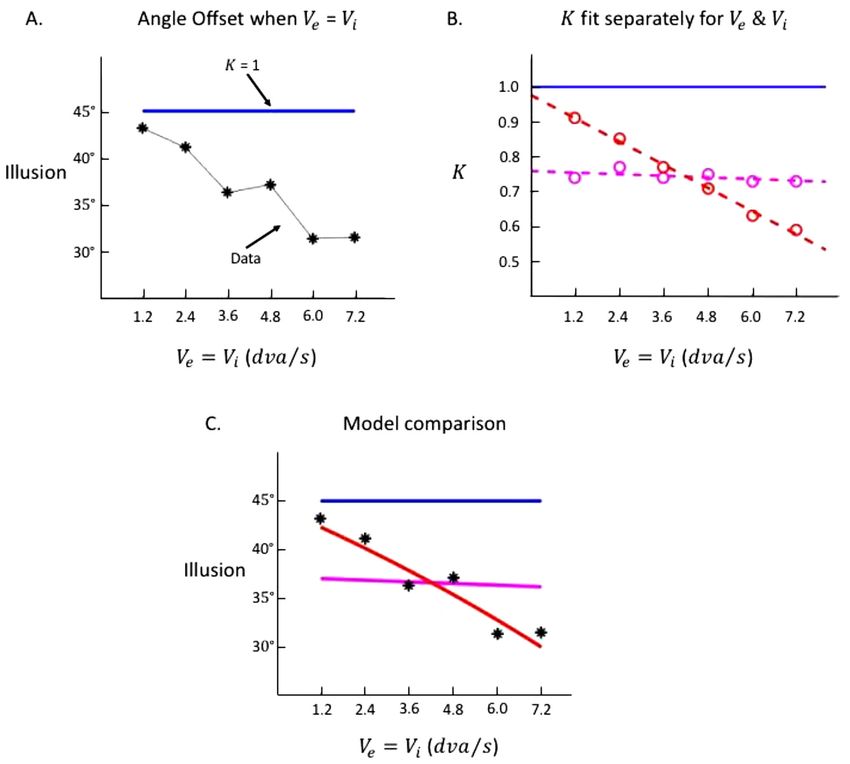
Journal of Vision (2021) 21(8):2, 1–9                         Heller et al.                                                             2

         Figure 1. (A) Schematic of the double-drift stimulus with external velocity vector at 0 degrees (thick blue arrow), internal velocity
         vector at 90 degrees (thin blue arrow), and perceived direction at 45 degrees (green dashed arrow). (B) Schematic of the response
         phase with the red cursor and a response direction (red dashed arrow) that corresponds to the perceived direction. The difference
         between the external direction and the response direction was used to obtain the angle offset θ , which measures the magnitude of
         the double-drift illusion.

            These significant displacements from an object’s true                   There have been several past efforts to model the
         motion and position make the double-drift illusion                      integration of the internal and external motion vectors.
         a powerful tool for addressing questions about the                      The results obtained in both Tse and Hsieh (2006)
         emergence of perception from bottom-up signals. For                     and Cavanagh and Tse (2019) were best fit using a
         example, it has been shown that the computation                         simple vector combination model. Shapiro et al. (2010)
         underlying the double-drift illusion must take place in                 performed a motion energy analysis of the stimulus and
         quadrantic regions of visual cortex (i.e. later than V1;                observed that primarily first-order motion information
         Liu, Tse, & Cavanagh, 2018) and after smooth pursuit                    was consistent with the internal direction and that
         eye movement signals have been discounted (Cavanagh                     second-order motion information was consistent with
         & Tse, 2019). Although these and other studies (Hui,                    the external direction. They concluded that motion
         Wang, Zhang, Tse, & Cavanagh, 2020; Liu, Yu, Tse,                       information from the first and second-order systems
         & Cavanagh, 2019; Özkan, Tse, & Cavanagh, 2020)                         is segregated when the stimulus is viewed in the
         demonstrate progress regarding the question where in                    fovea, but that they are integrated when viewed in the
         the brain the crucial computations occur, it remains to                 periphery.
         be determined how these computations are performed.                        More recently, Kwon et al. (2015) developed an object
         The present study focuses on one such question: how                     tracking account of the illusion. Their model optimally
         do the internal and external motion signals combine to                  integrates two sources of information about the state
         produce the illusion?                                                   of the tracked object: (1) measured information from
            This question has been addressed before. In 2019,                    sensory signals, and (2) predicted information from an
         Cavanagh and Tse manipulated the external speeds                        internal model of motion. When positional information
         of the Gabor and showed that the illusion strength                      is uncertain, then the measured information from
         decreases smoothly as external speed increases. In an                   the internal motion propagates into the predicted
         earlier study of this effect, which they referred to as                 information about the external velocity and position.
         the “curveball” illusion, Shapiro et al. (2010) showed                  In this way, the internal and external velocities are
         that the magnitude of the illusion increased as the                     mixed, causing the estimated position (i.e. the perceived
         internal speed increased. Earlier still, when Tse and                   position) to deviate from the actual position. The
         Hsieh (2006) first studied this effect under the name of                object tracking model accounts for several interesting
         the “infinite regress” illusion, they showed that the size              properties of this illusion, including the roles of the
         of the illusion decreased with increasing external speed                object’s boundary and eccentricity, and reveals a type
         and that it increased with increasing internal speed.                   of “motion silencing” for the internal motion. However,
         However, the range of external and internal speeds they                 the model has not been tested over a range of internal
         investigated did not overlap, preventing an evaluation                  and external speeds.
         of the contributions of the two motion signals over                        Here, we measure the size of the illusion at seven
         comparable ranges.                                                      internal speeds that overlap with six external speeds.

Downloaded from jov.arvojournals.org on 08/03/2021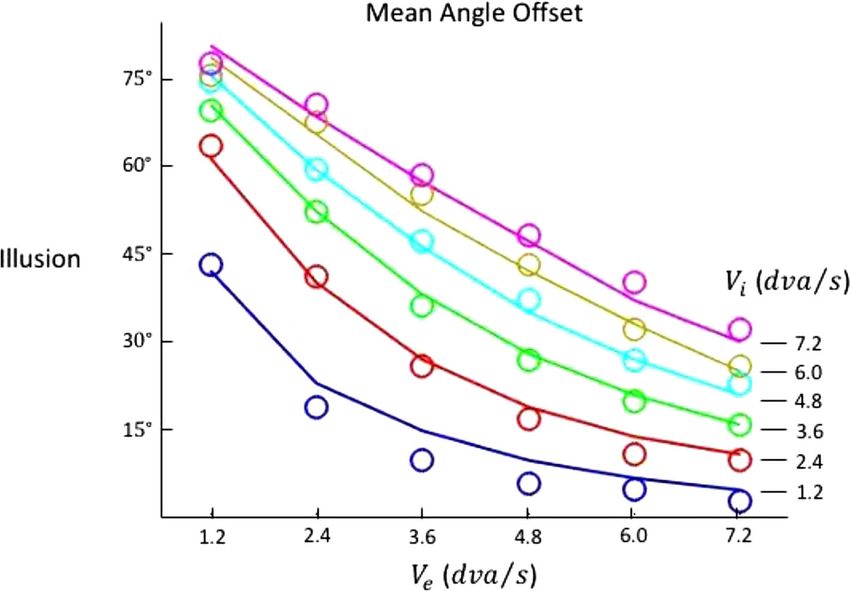
Journal of Vision (2021) 21(8):2, 1–9                     Heller et al.                                                       3

         Our data confirm the trend observed by Tse and Hsieh                For example, if the direction of the external motion
         (2006) that the illusion increases with increasing internal         was 0 degrees, then the internal motion was 90 degrees.
         speed and decreases with increasing external speed.                 To achieve this effect, the orientation of the Gabor
         In addition, our results demonstrate an interaction                 was always aligned with the external direction. An
         between the two motion signals that has not previously              additional control condition was included, in which
         been reported: specifically, the external speed mediates            the six external speeds were combined with an internal
         how the two motion vectors are combined. We then                    speed of 0 dva/s, and the angle of the luminance grating
         discuss a vector combination model that best accounts               within the envelope of the Gabor was randomized. In
         for our results.                                                    each trial, the Gabor was presented for 500 ms.

                                                                             Procedure and design
          Methods
                                                                                Participants completed four separate sessions of
         Participants                                                        this experiment, in which a single session consisted
                                                                             of 360 double-drift trials (36 internal/external speed
            Six adults (2 men and 4 women; mean age =                        combinations × 10 external directions) combined
         31 years, SD = 13.8) with normal or corrected to                    with 60 control trials (6 external speeds × 10 external
         normal vision took part in this experiment. Three                   directions), for a total of 42 speed combinations. Thus,
         of the participants were experienced psychophysical                 a single session consisted of 420 trials, resulting in 1280
         observers, and are authors on this paper, whereas the               trials per subject over the course of the experiment. All
         other three participants had no previous experience                 trials, and consequently speed, direction, and control
         with psychophysics experiments and were naïve to the                conditions, were randomly intermixed within a single
         purpose of this study.                                              session.
                                                                                At the start of a trial, a Gabor appeared in the center
                                                                             of the screen and completed its motion trajectory
         Stimuli and apparatus                                               (see Figure 1A). Participants were instructed to
                                                                             maintain their gaze on the black fixation point during
            Due to the unusual circumstances during which these              this time, as well as thereafter. After 500 ms, a red
         data were collected, caused by the novel coronavirus                response ring (spanning 16 dva in diameter) and a red
         epidemic in the year 2020, viewing conditions were more             cursor dot (spanning 1 dva in diameter) appeared in
         variable than is usual for this type of experiment. The             the center of the screen (see Figure 1B). While fixating,
         experiment was run with MatLab and PsychToolbox                     participants were instructed to left-click the mouse and
         (Brainard, 1997) software on three different units                  drag the cursor along the path that they perceived the
         of the same laptop type (13-inch MacBooks), with                    Gabor to have moved. After left-clicking, the cursor
         monitors all set at 60 Hz frame rate. Although lighting             turned from red to green indicating to the participant
         conditions varied for each participant, chin rests were             that their response had started. When the green cursor
         used to stabilize head motion and viewing distance was              intersected with the red response ring, the response ring
         measured to be 57 cm.                                               briefly turned green before disappearing, indicating to
            A black fixation point with a diameter of 0.6 dva                the participant that their response had been recorded
         was placed in the bottom left corner of the screen, 7               and a new trial would begin shortly.
         dva below and 9 dva to the left of the screen’s center.
         The stimulus consisted of a Gabor patch with a sigma
         of 0.8 dva and a spatial frequency of 1 cycle/dva, and
         was presented against a grey background that matched                  Results
         the mean luminance of the Gabor. To produce the
         double-drift illusion, a Gabor started at the center of                For every trial, a value for the offset angle θ was
         the screen, which was located 11.4 dva peripheral to                recorded that could range from 0 degrees, to either
         fixation. The envelope of the Gabor moved in one of                 −180 degrees or +180 degrees. A response with θ =
         10 directions (0 degrees = horizontally, 36 degrees,                0 degrees corresponds to a report exactly consistent
         72 degrees, 108 degrees, 144 degrees, 180 degrees, 216              with the true external direction, whereas responses
         degrees, 252 degrees, 288 degrees, and 324 degrees) at              between 0 degrees and +180 degrees, correspond to
         one of six external speeds (1.2 dva/s, 2.4 dva/s, 3.6 dva/s,        reports that are shifted counterclockwise to the true
         4.8 dva/s, 6.0 dva/s, and 7.2 dva/s) paired with one of             external direction, and responses between 0 degrees
         six internal speeds (same values as the external speeds,            and −180 degrees correspond to reports that are
         for 36 combinations), which moved in the orthogonal                 shifted clockwise to the true external direction. For
         direction counterclockwise from the external motion.                each session and for each of the 42 internal/external

Downloaded from jov.arvojournals.org on 08/03/2021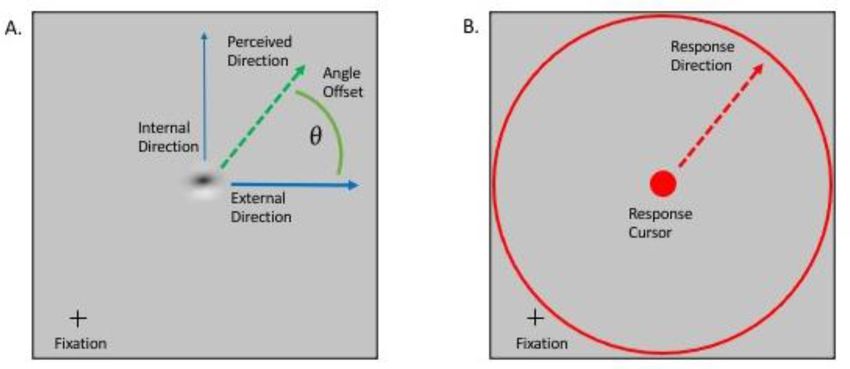
Journal of Vision (2021) 21(8):2, 1–9                          Heller et al.                                                          4

         Figure 2. Each black curve corresponds to a VonMises distribution fit to an individual subject’s responses for one of the 42 trial types,
         averaged across four sessions. Each row corresponds to a single internal speed and each column corresponds to a single external
         speed. Within each box, the x axis ranges from -100 degrees to +100 degrees, indicating in degrees how responses deviated from the
         physical path of the Gabor. In the first row, which corresponds to the control with no internal motion, all response distributions are
         centered near 0 degrees (red dotted line), indicating that they did not deviate from the physical path. Response distributions that are
         shifted in the positive direction correspond to conditions that induced a double-drift illusion.

         speed combinations tested during that session, a                         value of these 36 distributions (i.e. the mean angle
         separate VonMises distribution was fit to the values of                  offset) constitutes a measure of the magnitude of the
         θ corresponding to that condition for each participant                   double-drift illusion for each subject, for each of the
         individually. For example, during their first session,                   double-drift combinations of internal and external
         a participant responded to 10 trials (i.e. 10 possible                   motion speeds (see Figure 3)
         external directions) in which the internal speed was 0                      Figure 3 is an average of mean angle offset (i.e. central
         dva/s and the external speed was 1.2 dva/s. A VonMises                   value of the corresponding VonMises distribution)
         distribution was fit to those 10 values, and after each                  across participants for each condition. Each plotted
         of the four sessions was completed, the four VonMises                    line corresponds to one internal speed. As external
         distributions for that participant and condition were                    speed increases, the illusion size (i.e. the magnitude
         averaged together. These averaged distributions, for                     of θ ) decreases. Furthermore, for the data for each
         each subject and for each condition, are plotted                         external speed individually, the illusion size increases
         in Figure 2.                                                             as the internal speed increases. Additionally, there is a
            The first row of plots in Figure 2 correspond to the                  strong interaction between the effects of the internal
         six control conditions in which the internal speed was 0                 and external speeds: at the highest internal speeds, the
         dva/s. For this row of plots, each participant’s response                relation between the illusion strength and the external
         distribution is centered on 0 degrees, indicating that                   speed is approximately linear. However, at slower
         they perceived the Gabor to move along a path                            internal speeds, the relation is nonlinear.
         consistent with the true external direction. For every                      To test the effects of motion speed on the size of
         other row of plots (i.e. the 36 double-drift conditions),                the double-drift illusion, a two-way within-subjects
         each participant’s response distribution appears shifted                 ANOVA was conducted with internal speed and external
         (to varying degrees) in the positive direction, indicating               speed as the two six-level factors (the control condition
         that they perceived the Gabor to move along a path                       was not included). The main effects for internal speed
         biased by the internal motion direction. The mean                        (F[5,180] = 157.1, p < 0.001, η2p = 0.81) and external

Downloaded from jov.arvojournals.org on 08/03/2021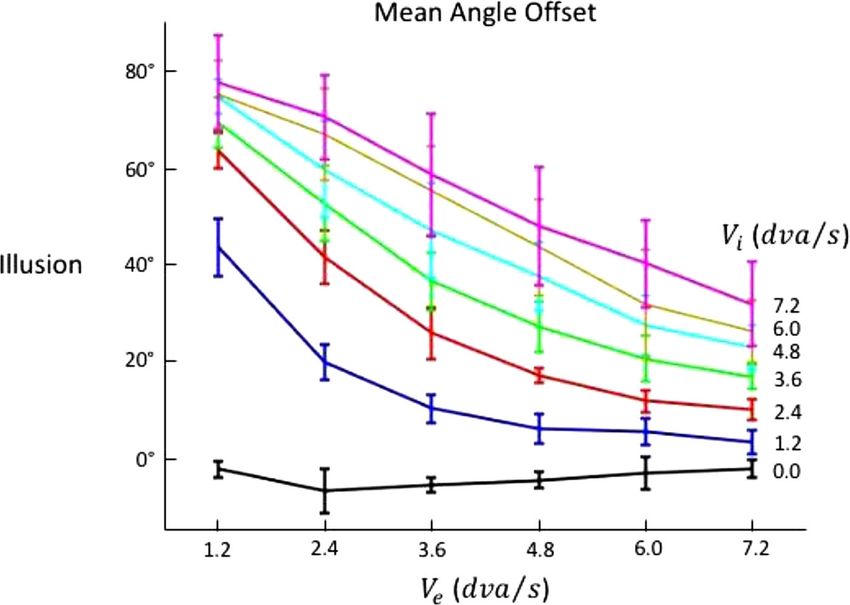
Journal of Vision (2021) 21(8):2, 1–9 Heller et al. 5
Figure 3. Perceived angle offset averaged across participants (n = 6) for each of the 42 internal and external speed combinations. The
y-axis is the magnitude of the illusion measured in number of degrees (θ ) that the perceived trajectory is offset from the physical
trajectory. Each line corresponds to a single internal speed (Vi ), as indicated by the number located at the right end of each line,
plotted against external speed (Ve ) on the x-axis. Error bars represent the standard error of the mean across participants.
speed (F[5,180] = 249.0, p < 0.001, η2p = 0.87) were All six tests where significant (F[5, 30]>17, p < 0.001,
extremely significant. Furthermore, a significant η2p > 0.74). Post hoc tests (Tukey’s HSD) revealed
interaction for internal speed and external speed was significant differences between conditions that reflect
found (F[25,180] = 2.14, p = 0.002, η2p = 0.23). Six the non-linear relationship for slower internal speeds,
simple main effects tests were conducted to test the plotted in Figure 3, compared with the more linear
effect of external speed at each level of internal speed. relationship for the faster internal speeds.
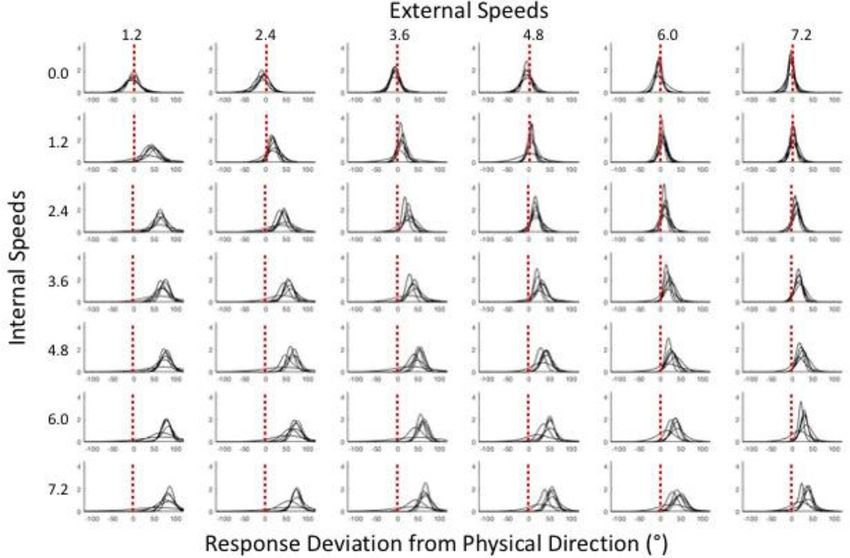
Figure 4. The solid blue arrows represent the directional components of the internal velocity vector (Vi ) and the external velocity
vectors (Ve ). The dashed blue line represents the directional components being scaled by weights wi and we . The red dashed line
represents the perceived trajectory, modeled here as resulting from a weighted vector combination of the internal and external
velocities. Depending on the values of wi and we , the internal and external velocities are combined to produce different perceived
directions, denoted by θ .
Downloaded from jov.arvojournals.org on 08/03/2021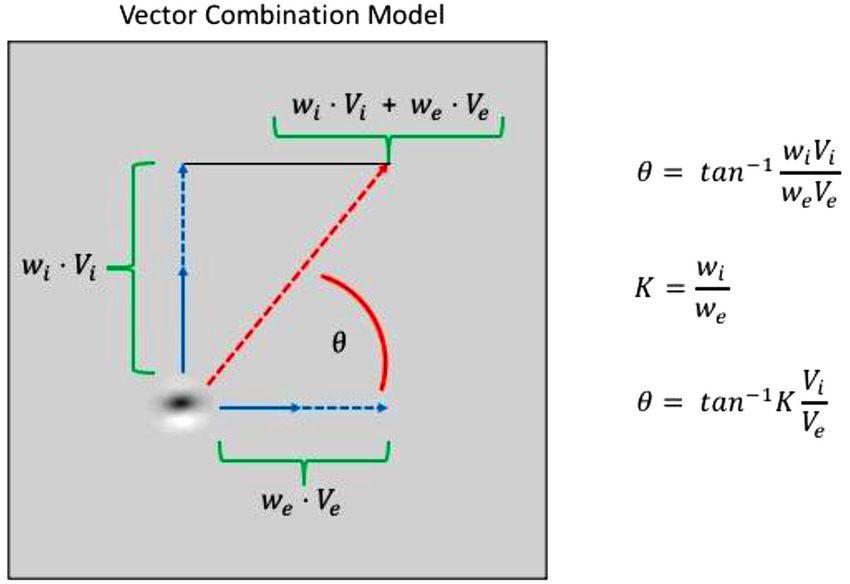
Journal of Vision (2021) 21(8):2, 1–9                           Heller et al.                                                             6

         Vector combination model                                                    Because we only measured the offset angle of the
                                                                                   perceived motion vector from the true external motion
            In the two previous papers that explored how the                       vector, we cannot separately estimate wi and we , but can
         speed of the internal and external motion vectors                         only recover their relative value K = wwei . Thus, with the
         contribute to the size of the DD illusion (Cavanagh &                     proportion K as the free variable, the model we fit to the
         Tse, 2019; Tse & Hsieh, 2006), the authors considered                     present data has the form:
         the simplest plausible model for how the two vectors
         are combined: a vector combination model. This model                                          Vi
         assumes that the perceived external motion vector is                            θ = tan−1 K         (2)
         a combination of the physical internal and external                                           Ve
         motion vectors according to a set of weights (see Figure
         4). That is, for internal and external motion vectors                        This model with K = 1 gives a good fit to the data (root
         Vi and Ve , and corresponding weights wi and we , the                     mean square error [RMSE] = 8.1, Akaike information
         perceived angle θ is given by the model:                                  criterion [AIC] = 152.2) and an even better fit if we allow
                                                                                   K to be a free parameter (K = 0.74; RMSE = 3.6,
                                wiVi                                               AIC = 94.4). However, a closer inspection of these
                θ = tan−1                  (1)
                                weVe

         Figure 5. (A) The size of the illusion, which is plotted for the six conditions when Vi = Ve (black stars; see supplementary videos for
         demos of these conditions), clearly decreases as speed increases. If K were a constant value such as 1, these values would form a flat
         line (blue line). (B) Two models were fit, one where a separate value for K was fit for each of the six Ve (red circles) and one where a
         separate value for K was fit for each of the six Vi (magenta circles). Regression lines (dashed lines) were fit to each set of six values for
         K. The solid blue line corresponds to K = 1. (C) Here, we plot the model predictions using the regression fits to Ve (red line) and Vi
         (magenta line) along with the data (black stars). Clearly, the values of K fit to Ve give the better approximation to the data.

Downloaded from jov.arvojournals.org on 08/03/2021
Journal of Vision (2021) 21(8):2, 1–9 Heller et al. 7
Figure 6. Here, the magnitude of the illusion (y-axis) for our collected responses (colored circles) are shown along with the prediction
of the best fit model (colored lines), where variable values of K decrease linearly as Ve increases, with the form K = 1 + s* Ve , with s
= − 0.066.
predictions reveals deviations that suggest that the RMSE AIC
relative influence of internal and external speeds
might change with speed. Note that the predictions K = 1 + s* Ve 2.0
of Equation 2 for the illusion should all be the same K fit to 6 individual Ve 1.9 7
where the ratio of Ve and Vi are constant – we have K fit to 6 individual Vi 3.5 51.7
several cases where this holds in the experiment. For K = 0.74 3.6 43.0
example, there are six points where Ve is equal to Vi K = 1.0 8.1 101.1
(see Figure 4A). If we now plot the data from the Table 1. Root mean squared error and AIC for each model
conditions with a constant ratio of Ve to Vi , we see
that there is a systematic deviation from the expected
constant value. The simplest explanation of this
deviation is that K decreases with increasing external
velocity – the effectiveness of the internal velocity Discussion
gets relatively weaker as Ve increases. Perhaps this
is a simple consequence of low-level visual factors In this study, we systematically varied the speed of
for the registration of motion of a patch that is internal and external motion vectors in a double-drift
moving itself – we will cover this in more detail in the stimulus. Our results confirm previous work (Cavanagh
discussion. & Tse, 2019; Tse & Hsieh, 2006), showing that the
We therefore fit the data with six independent values magnitude of the illusion, as measured by the deviation
of K, one for each external velocity, and to be fair, of the perceived trajectory toward the direction of
with six independent values of K, one for each internal internal motion, increases as the speed of the internal
velocity. Allowing K to vary with the external velocity motion increases, and decreases as the speed of the
improved the fit significantly (RMSE = 1.9, AIC = external motion increases. However, our results also
57.9), whereas independent values of K for the different reveal an interaction between internal and external
internal velocities did not improve the fit (RMSE = speeds that has not been previously reported. We show
3.5, AIC= 103.1). Finally, a linear decrease was clear in in our best fitting model that the combination of the
the 6 values of K fit separately for each Ve (Figure 5B) internal and external motions depends on the speed of
so we fit the slope s in the expression K = 1 + s* Ve , the external motion: the relative value of the internal
obtaining a linear model for K (s = − 0.066). This and external weights (i.e. K = wwei ) decreases linearly
linearly decreasing function of K maintains the good fit with the speed of the external motion.
of the six independent K values but reduces the number Precisely how this dependency arises in the motion
of free parameters to 1 (RMSE = 2.0, AIC = 51.1; processing system is not clear, but there are three
see Figure 6). See Table 1 for all model comparisons. obvious possibilities. First, the contribution of the
Downloaded from jov.arvojournals.org on 08/03/2021Journal of Vision (2021) 21(8):2, 1–9 Heller et al. 8
internal speed (i.e. wi ) may decrease as external speed locations increases our ability to differentiate the
increases. Specifically, at faster external speeds, the representations of the two in brain imaging studies.
Gabor’s envelope spends less time at each location, If a causal account can be given for how the two
in effect reducing the time for local, motion-selective sources of motion accumulate and when they saturate,
receptive fields to accumulate speed information. it may be possible to engineer greater illusory position
Motion discrimination does in fact decrease as stimulus displacements. The present findings support these
duration decreases (Borghuis, Tadin, Lankheet, Lappin, efforts by revealing a piece of the puzzle: the external
& van de Grind, 2019). Second, the contribution of the speed plays a unique role in mediating how the
external speed (i.e. we ) may increase as external speed perceived path diverges from the physical path.
increases. Because the external motion of the Gabor
Keywords: motion induced position shift, double-drift,
is parallel to the orientation of its internal carrier, it
motion velocity, computational modeling
is a second order motion that may be analyzed by a
global tracking processes that integrates signals from
units along the motion path (Cavanagh, 1992). At
faster external speeds, the longer trajectory covers Acknowledgments
more receptive fields, and this larger sample pool may
increase the fidelity of the external motion information.
Supported by National Science Foundation Grant
Finally, both internal and external weights may change.
1632738 (P.T.), funding from the Department of
These are mere speculations at this point, and more
Psychological and Brain Science, Dartmouth College
experiments are needed to determine the specific
(P.C.), a grant from NSERC of Canada (P.C.),
mechanism that governs the special role that external
and funding from the Women in Science Project at
speed plays in combining the two sources of motion.
Dartmouth College.
A final potential source of the decrease in K is the
possibility that, at higher speeds, the illusory paths may Commercial relationships: none.
be curved (Kwon et al, 2015) or reset to the physical Corresponding author: Nathan H. Heller.
path (Nakayama & Holcombe, 2020) at some point. Email: nathan.h.heller.gr@dartmouth.edu.
Kwon et al. (2015) found that the perceived path was Address: Department of Psychological and Brain
strongly curved for the speeds they used (Ve = 4 Sciences, Dartmouth College, 6207 Moore Hall,
dva/s, Vi = 10 dva/s). In their model, the drift in the Hanover, NH 03755, USA.
direction of the internal motion saturated after about
200 ms so the path initially deviated from the physical *
NP and VMF contributed equally to this work.
path but then curved around to run parallel to it. M‘t
Hart, Henriques, & Cavanagh (2019) reported both
curvature and resets back to the physical path in longer
duration trajectories. In contrast, our model and our References
measurement technique assume a linear path over the
500 ms during which the Gabor was present, and at Brainard, D. H. (1997). The psychophysics toolbox.
the slower speeds we use, this may have been the case. Spatial Vision, 10(4), 433–436.
However, if the perceived paths in our experiment
had any curvature or resets, the apparent direction Borghuis, B. G., Tadin, D., Lankheet, M. J., Lappin, J.
averaged over the 500 ms presentation time, would S., & van de Grind, W. A. (2019). Temporal limits
show less illusion strength – less deviation from the of visual motion processing: psychophysics and
physical direction. If curvature and resets were more neurophysiology. Vision, 3(1), 5.
likely at higher external speeds, this might explain Cavanagh, P. (1992). Attention-based motion
some of the reduction in illusion strength and the perception. Science (New York, N.Y.), 257(5076),
decrease of K with Ve . The possibility of curvature 1563–1565.
and resets can be evaluated informally by comparing Cavanagh, P., & Anstis, S. (2013). The flash grab effect.
the first and second part of Supplementary Video S1. Vision Research, 91, 8–20.
In the first part of the video, when Vi = Ve = 1.2 Cavanagh, P., & Tse, P. U. (2019). The vector
dva/s, perceived paths appear relatively linear. Compare combination underlying the double-drift illusion is
this with the second part of the video, when Vi = Ve based on motion in world coordinates: Evidence
= 7.2 dva/s. Here, the perceived path may appear to from smooth pursuit. Journal of Vision, 19(14), 2.
curve toward or reset to the physical path for some
observers. Dunker, K. T. (1929). Über induzierte bewegung.
One of our aims in testing and modeling the Psychologische Forschung, 12, 180–259.
double-drift illusion is to maximize the illusion size. Eagleman, D. M., & Sejnowski, T. J. (2007). Motion
Increasing the distance between physical and perceived signals bias localization judgments: A unified
Downloaded from jov.arvojournals.org on 08/03/2021Journal of Vision (2021) 21(8):2, 1–9 Heller et al. 9
explanation for the flash-lag, flash-drag, flash-jump, Nakayama, R., & Holcombe, A. O. (2020). Attention
and Frohlich illusions. Journal of Vision, 7(4), 3. updates the perceived position of moving objects.
Hui, J., Wang, Y., Zhang, P., Tse, P. U., & Cavanagh, Journal of Vision, 20(4), 21.
P. (2020). Apparent Motion Is Computed in Özkan, M., Tse, P. U., & Cavanagh, P. (2020). Pop-out
Perceptual Coordinates. i-Perception, 11(4), for illusory rather than veridical trajectories with
2041669520933309. double-drift stimuli. Attention, Perception, &
Kwon, O. S., Tadin, D., & Knill, D. C. (2015). Unifying Psychophysics, 82(6), 3065–3071.
account of visual motion and position perception. Shapiro, A., Lu, Z. L., Huang, C. B., Knight, E., &
Proceedings of the National Academy of Sciences, Ennis, R. (2010). Transitions between central and
112(26), 8142–8147. peripheral vision create spatial/temporal distortions:
Lisi, M., & Cavanagh, P. (2015). Dissociation between A hypothesis concerning the perceived break of the
the perceptual and saccadic localization of curveball. PLoS One, 5(10), e13296.
moving objects. Current Biology, 25(19), 2535– M‘t Hart, B., Henriques, D. Y., & Cavanagh, P. (2019).
2540. Manual tracking of the double-drift illusion.
Liu, S., Tse, P. U., & Cavanagh, P. (2018). Meridian Journal of Vision, 19(10), 286b.
interference reveals neural locus of motion-induced Tse, P. U., & Hsieh, P. J. (2006). The infinite regress
position shifts. Journal of Neurophysiology, 119(6), illusion reveals faulty integration of local and global
2091–2099. motion signals. Vision Research, 46(22), 3881–3885.
Liu, S., Yu, Q., Tse, P. U., & Cavanagh, P. (2019). Neural Wallach, H., Bacon, J., & Schulman, P. (1978).
correlates of the conscious perception of visual Adaptation in motion perception: alteration of
location lie outside visual cortex. Current Biology, induced motion. Perception & Psychophysics, 24(6),
29(23), 4036–4044. 509–514.
Massendari, D., Lisi, M., Collins, T., & Cavanagh, P. Whitney, D. (2002). The influence of visual motion on
(2018). Memory-guided saccades show effect of a perceived position. Trends in Cognitive Sciences,
perceptual illusion whereas visually guided saccades 6(5), 211–216.
do not. Journal of Neurophysiology, 119(1), 62–72.
Downloaded from jov.arvojournals.org on 08/03/2021You can also read