Effectiveness of protection areas in safeguarding biodiversity and ecosystem services in Tibet Autonomous Region
←
→
Page content transcription
If your browser does not render page correctly, please read the page content below
www.nature.com/scientificreports
OPEN Effectiveness of protection areas
in safeguarding biodiversity
and ecosystem services in Tibet
Autonomous Region
Kaipeng Xu, Xiahui Wang*, Jinnan Wang, Jingjing Wang, Rongfeng Ge, Rensheng Tian,
Huixia Chai, Xin Zhang & Le Fu
The Tibet Autonomous Region of China constitutes a unique and fragile ecosystem that is increasingly
influenced by development and global climate change. To protect biodiversity and ecosystem services
in Tibet, the Chinese government established a system of nature reserves at a significant cost;
however, the effectiveness of nature reserves at protecting both—biodiversity and ecosystem service
functions in Tibet is not clear. To determine the success of existing nature reserves, we determined
importance areas for the conservation of mammal, plant, bird, amphibian, and reptile species, and
for the protection of ecosystem service functions. The results indicated that important conservation
areas for endangered plants were mainly distributed in the southern part of Nyingchi City, and for
endangered animals, in the southern part of Nyingchi and Shannan Cities. Extremely important
conservation areas for ecosystem service functions of carbon sequestration, water and soil protection,
and flood regulation were mainly distributed in the southern part of Nyingchi and Shannan Cities,
northern and southeastern parts of Nagqu City, and southern part of Ngari area. Based on an analysis
of spatial overlap in protection areas, we conclude that existing natural reserves need to be expanded,
and new ones need to be established to better protect biodiversity in Tibet Autonomous Region.
The Tibet Autonomous Region, located within the Qinghai–Tibet Plateau in southwestern China, constitutes a
unique and fragile ecosystem1. The region is the birthplace of several main rivers of Asia including the Yangtze,
Lancang, and others. The region’s water and soil conservation functions are important for water quality and
quantity, and the maintenance of agricultural irrigation and other human production activities in the middle
and lower reaches2. The region’s water and soil conservation functions are important for maintaining water
quality and quantity, and maintenance of agricultural irrigation and other human production activities in the
middle and lower r eaches3.
Environmental problems caused by human activities and climate change in the Tibet Plateau have become a
serious concern for ecologists and managers4. The Chinese government launched an ecological restoration plan
with the purpose of slowing down or reversing environmental degradation5. Between 1979 and 2015, the invest-
ment in restoration activities reached 90 billion yuan. Although vegetation coverage on the Qinghai–Tibet Plateau
has increased in response to these activities, there are few reports on the effect of the ecological restoration plan6.
However, Tibet faces increasingly pressing climate change p roblems7. A recent study showed that the average
temperature in Tibet increased at the rate of 0.32 °C every 10 years from 1961 to 2015; this increase was noticeably
higher than the global and the national temperature rise. Climate warming resulted in a reduction of glacier area
in the Qinghai–Tibet Plateau, and an increase in melt water v olume8. Climate change also caused a rise in the
lower limit of the plateau permafrost, and strengthening of the freeze–thaw ablation; this led to land desertifica-
tion, and a breakdown in windbreak, sand stabilization, and water and soil conservation functions of grasslands.
Dominant plant species in some areas declined gradually because of global warming, and many weedy plants
and toxic herbs appeared, endangering the native biological diversity of the Tibet R egion9. Therefore, planning
for protecting biological diversity and ecosystem service function in Tibet Region is u rgent10.
The ecosystems of Tibet are considered fragile due to the special geological location, natural conditions, and
the relatively low economic development level of the area; however, the variety of ecosystem service functions
comprises an important part of ecological security for the region and the c ountry11. It has been predicted that
Center of Eco‑Environmental Zoning, Chinese Academy of Environmental Planning (CAEP), Beijing 100012, People’s
Republic of China. *email: wangxh@caep.org.cn
Scientific Reports | (2022) 12:1161 | https://doi.org/10.1038/s41598-021-03653-6 1
Vol.:(0123456789)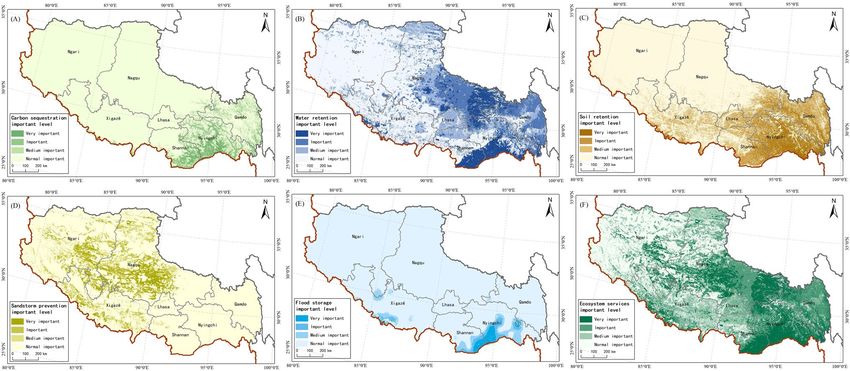
www.nature.com/scientificreports/
Figure 1. The geographical elevation of the study area and the location map of the surrounding countries and
provinces. We created this figure in using ArcGIS 10.5 for maps (URL: http://www.esri.com/).
biological diversity will increase in the southeastern part of the Qinghai–Tibet Plateau as a result of permafrost
thawing; however, as climate becomes increasingly drier, desertification is likely to expend, and biological diver-
sity in the northern part of the Plateau will likely decrease.
The effects of ecological restoration and the impact on ecological environment in Tibet have been extensively
researched12. However, a great need exists to evaluate the spatial distribution and conservation effectiveness of
protected areas in Tibet Autonomous Region13. Identification of key areas of ecosystem services and biodiversity
will allow the establishment of new targeted ecological restoration areas, and the reduction of environmental
degradation14. In this study, we focused on areas which protect biodiversity and ensure the security of ecosys-
tem services. Our specific objectives were: (1) to map the spatial distribution of important areas for biological
diversity protection in Tibet, (2) determine the spatial pattern of ecosystem services, and (3) analyze protection
status and nature reserve system planning.
Research methods
Study area. Tibet Autonomous Region is located at the southwest frontier of China, with its geographic
location between longitude 78 25′–99 06′ E, and latitude 26° 50′–36° 53′ N; the region borders with the Xinjiang
Uygur Autonomous Region and Tibet to the north, Sichuan and Yunnan Provinces to the east, and Nepal, India,
Bhutan, and Myanmar to the southeast15. It is an important gateway of southwestern China16.
Tibet Autonomous Region has an area of 12.02 million square meters, accounting for 1/8 of China’s land
area17. In 2018, permanent resident population in the region reached 3.36 million. Regional DGP was just RMB
134.56 billion. Compared with central and eastern China, economic development in Tibet is lagging, and it is
the least developed of the provinces18.
Average elevation in Tibet Autonomous Region reaches 4728 m, with elevations of > 5000 m spread over 0.467
million square meters, making up 39.8% of the region’s total area mainly in the west; area with elevation ≤ 3000 m
accounts for 4.7% of the total area at only 57,000 square meters, and is mainly distributed in the south of Nyingchi
City and Shannan City (Fig. 1).
Rainfall in Tibet exhibits strong spatial differences, and is unevenly distributed during the year, with promi-
nent wet and dry seasons. Average temperature in Tibet decreases from southeast to northwest. The plateau area
of Tibet experiences strong winds of long duration. The large territory of Tibet has diversified habitat t ypes19. It
features all terrestrial ecosystem types including peculiarities that other regions of China and other countries in
the world do not have. As a unique regional environmental unit, Tibet has given rise to specific biological groups,
with many rare wild plants and animals, and is the main differentiation and formation center of world mountain
species20. Tibet is also a region with rich biodiversity specific to high altitudes, forms a natural germplasm bank
of alpine organisms, and contributes to global biodiversity protection.
Data sources. To determine land cover/land use, we used land coverage data from global land coverage
product (http://www.globallandcover.com/) developed by the State Geological Information Center. The images
used for classification were mainly 30 m multi-spectral images, including LandsatTM 5 ETM+ multi-spectral
Scientific Reports | (2022) 12:1161 | https://doi.org/10.1038/s41598-021-03653-6 2
Vol:.(1234567890)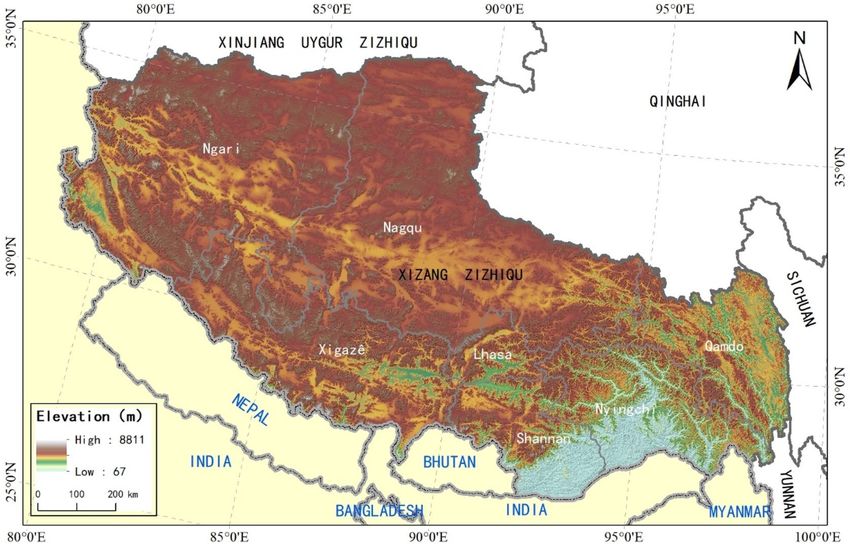
www.nature.com/scientificreports/
image and multi-spectral image of China Environmental Disaster Reduction Satellite (HJ-1)21. This series of
product raises spatial resolution an order of magnitude, with the overall classification precision reaching 80%.
Vegetation coverage data were obtained from Moody Image with an inversion based on a pixel binary model.
The calculation of vegetation coverage was based on MODIS data products provided by DISC, NDVI data
(MOD13Q1) of NASA. We adopted a remote sensing estimation method for the calculation of vegetation cover-
age, based on pixel binary model and NDVI values as parameters22.
Plant distribution information was obtained from the China Plants Database; spatial distribution data of
mammals, amphibians, and reptiles were obtained from IUCN, and Colored Atlas of Chinese Amphibians and
Their Distributions, supplemented with China’s Mammal Diversity and Geographical Distribution; bird spatial
distribution data originated from Bird Life International; elevation and habitat vegetation types from China
Plants Database, IUCN Red List, Bird Life International, and recent studies23. Elevation data came from the 90 m
digital elevation model obtained in radar terrain detection mission of the NASA shuttle.
Biomass was calculated with the biomass method and data accumulation NNP method of above ground bio-
mass. Vegetation index-biomass is an empirical statistical model based on field measured forest shrub biomass
data and quickbird, and then reverse-based on quickbird from biomass; cumulative NNP method was confirmed
with the growth period (start and end periods) of grassland or field, cumulative NPP for a growth period was
calculated for above ground biomass and CASA model adopted an NPP a lgorithm24. Natural reserve data were
obtained from the China Ministry of Ecology and Environment.
We calculated other ecosystem functions, including carbon fixation, water and soil conservation, windbreak
and sand stabilization, and flood regulation using 5-year (2010–2015) evaluation project of the Chinese ecosystem
environment25. Details of calculations are given below.
Mapping of biological diversity. To map the important areas of biodiversity conservation, we selected
threatened species from the IUCN Red List or Chinese Red List indicator species, including species in critically
endangered (CR), endangered (EN), and vulnerable (VU) categories26. The final selected list contained a total
of 1534 species, including 955 plants, 152 mammals, 127 birds, 177 amphibians, and 123 reptiles27. Distribution
information for plants was obtained from the Scientific Database of China Plant Species. Range maps for mam-
mals, amphibians, and reptiles were obtained from the IUCN. Range maps for birds were acquired from BirdLife
International. We refined the potential habitat for each species based on specific distribution area, elevational
range, and vegetation. Data on specific distribution areas were obtained from the Institute of Zoology, Chinese
Academy of Sciences; habitat requirements for elevation and vegetation for each species were derived from the
Scientific Database of China Plant Species, the IUCN Red List, BirdLife International, and recent s tudies28.
Important areas for species conservation were identified by summing up weighted potential habitats for
each taxon. To describe the relative importance of different IUCN categories, we gave weights of 3, 2, and 1 to
categories CR, EN, and VU, respectively. For each taxon, we normalized the summed values separately to the
range of 0–100 using the minimum–maximum normalization method, with 100 being the most important and
0 being the least i mportant29.
Spatial overlapping was conducted to obtain the importance value of biodiversity protection for the 5 groups
of species, and the maximum value was the total importance value of biological diversity protection for all spe-
cies together. Based on the importance value, the top cumulative 20% area was taken as extremely important
iversity30.
for biological d
Mapping of ecosystem services. We considered five key regulating ecosystem services: water reten-
tion, soil retention, sandstorm prevention, carbon sequestration, including both biophysical supply and supply
weighted by the number of people benefiting31. Data for these calculations were obtained from the National
Ecosystem Assessment Project 2000–201532.
A. We calculated carbon sequestration as the difference between net primary productivity and soil respiration,
as follows33:
NEP = NPP − RS,
where NEP, net ecosystem productivity, was carbon sequestration (g C/m2/year), NPP was net primary pro-
ductivity (g C/m2/year) of the ecosystem, and RS was carbon release (g C/m2) from soil through respiration.
B. Water conservation amount, rainfall, evapotranspiration, and surface runoff are closely related to vegetation
type and other factors, and may be calculated using the water balance equation as follows34:
j
TQ = (Pi − Ri − ETi ) · Ai ,
i=1
where TQ was the total water conservation amount (m3).
Pi was rainfall (mm); Riwas rainstorm runoff (mm), ETi was evapotranspiration (mm), Ai was the area of
ecosystem type i; i was ecosystem type in the study area; j was the total number of ecosystems in the study
area.
C. To calculate soil conservation, we used the general soil loss equation (USLE), as modified by.
SC = R · K · LS · (1 − C),
Scientific Reports | (2022) 12:1161 | https://doi.org/10.1038/s41598-021-03653-6 3
Vol.:(0123456789)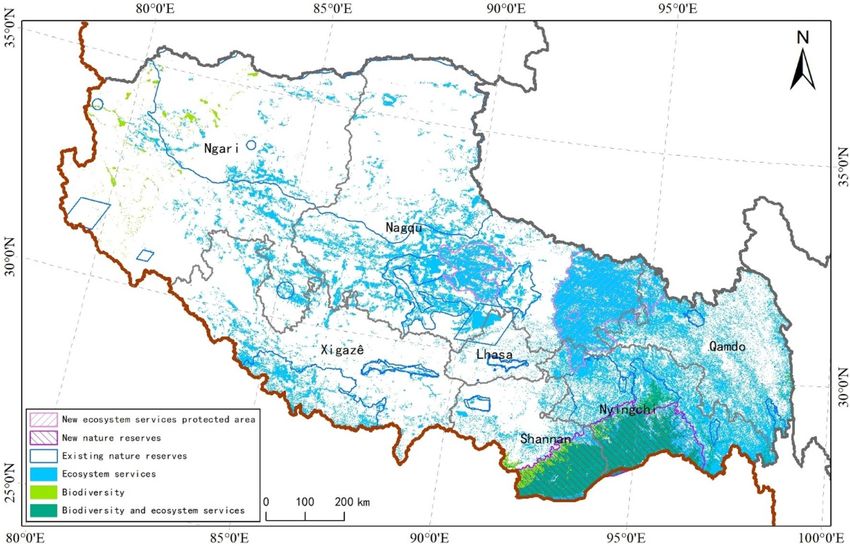
www.nature.com/scientificreports/
where SC was the soil conservation amount (t h m−2 a−1); R was rainfall erosivity factor (MJ mm h m−2 h−1
a−1); K was soil erodibility factor (t h
m2 h h
m−2MJ−1 mm−1); LS was terrain factor; C was vegetation cover-
age factor35.
D. To calculate sand stabilization amounts, we used the revised wind erosion equation, which incorporates
effects of wind speed, rainfall, temperature, soil texture, terrain, and vegetation coverage on soil erosion and
soil conservation36.
SR = SLpotential − SL
Rk = SR SLpotential
where, SR was the amount of sand stabilization (t k m−2 a−1), Rk was sand stabilization rate, SLpotential was the
potential wind erosion amount, and SL was the actual soil erosion amount (t km−2 a−1).
E. Flood regulation capacity of lakes was based on the relationship between the adjustable water storage capacity
of different lakes and lake surface area; the adjustable water storage capacity of the lakes was further estimated
based on lake surface a rea37.
Ln(Cr ) = 0.678 Ln(A) + 6.636 (N = 6, R2 = 0.963),
where Cr was adjustable water storage capacity (10,000 m
3); A was lake surface area ( km2).
Cr = 0.35 Ct (N = 460, R2 = 0.810),
3), Ctwas total storage capacity.
where Cr was flood control storage (10,000 m
Flood storage capacity of marshland takes into account surface water retention in marshland, calculated for
the average submerged 1 m in flood period and marshland a rea38.
Similar to the importance index for endangered species, we normalized the biophysical supply value into
the importance index value ranging from 0 to 100 using the minimum–maximum normalization method. We
also defined an important area for ecosystem service provision as the top 20% cumulative area according to the
importance index value. The overall importance index map for overall ecosystems service was the maximum
value of the four services layers.
Effects of ecological protection. We used spatial overlapping to analyze the protection effect of natural
reserves on biodiversity and ecosystem service function39. If the coverage of key habitats in nature reserves was
higher than that of nature reserves in Tibet Autonomous Region, we defined it as good protection reserves effect
on threatened species by protected areas network40. For ecosystem services, if the natural protection zones of
biophysical supply (or of the weighted number benefiting from the supply) relative to its total supply were greater
than the area of Tibet autonomous region, and land supply of biophysical supply (or the weighted number ben-
efiting from the supply), we defined it as a better protective effect on the service function of the reserve network,
or as poorly represented in terms of threatened species or ecosystem services.
Protection gap analysis. We analyzed the need for establishing new nature reserves or expanding existing
ones to better cover high priority areas for biodiversity and ecosystem services. Priority areas were delimited
by using the top 20% of habitat for biodiversity conservation and for ecosystem service provision according to
the importance index value. Protection net is a design based on important area protection for both biological
diversity and ecological system service function41. Protection gap analysis quantifies the need for establishment
of new, or expansion of existing protection sites; an overlap analysis of the distribution of areas of importance
for biological diversity protection, ecosystem service protection, and that of current nature reserves. then by
recognizing the spatial unit without the distribution of important area of biological diversity and ecosystem
service protection42.
Results
Spatial distribution of important areas for biological diversity protection. We assigned species
to the following categories: extremely endangered, endangered, and vulnerable, based on IUCN and China Spe-
cies Red List for the Tibet Autonomous Region. In total, 202 species were selected as important protection spe-
cies; among them were 105 plant, 46 mammal, 23 bird, 16 amphibian, and 12 reptile species.
Important areas for protection of endangered plants in Tibet Autonomous Region were mainly distributed in
the southern part of Nyingchi City (Fig. 2A). In that, extremely important and important areas totaled respec-
tively 6383.31 and 36,052.50 k m2 accounting for 0.53 and 3.00% of the total area of Tibet (Table 1).
Important areas for protection of endangered mammals were mainly distributed in the southern part of
Nyingchi and Shannan Cities (Fig. 2B). In that, extremely important and important areas totaled respectively
50,365.63 and 65,749.56 k m2, accounting for 4.19 and 5.47% of the total area of Tibet (Table 1).
Important areas for protection of endangered birds in Tibet were mainly distributed in the south of Nyingchi
and Shannan Cities and in the west of Ngari Region (Fig. 2C). In that, extremely important and important areas
totaled respectively 6674.69 and 52,993.25 k m2, accounting for 0.56 and 4.41% of the total area (Table 1).
Scientific Reports | (2022) 12:1161 | https://doi.org/10.1038/s41598-021-03653-6 4
Vol:.(1234567890)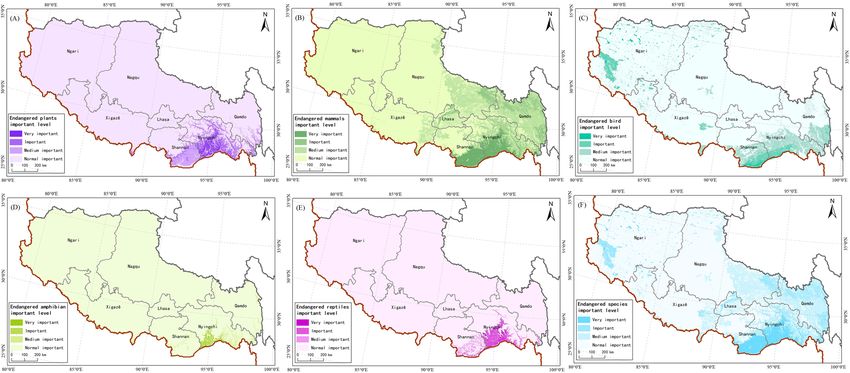
www.nature.com/scientificreports/
Figure 2. Spatial pattern of Biodiversity importance of China’s Tibet autonomous region, (A) distribution of the
importance of endangered plants, (B) distribution of importance of endangered mammals, (C) distribution of
importance of endangered birds, (D) distribution of importance of endangered amphibians, (E) distribution of
importance of endangered reptiles, (F) distribution of importance of endangered species. We created this figure
in using ArcGIS 10.5 for maps (URL: http://www.esri.com/).
Extremely Medium
important Important importance General importance
Biodiversity type Area % Area % Area % Area %
Plants 6383.31 0.53 36,052.50 3.00 44,163.94 3.67 1,115,359.50 92.80
Mammals 50,365.63 4.19 65,749.56 5.47 187,642.38 15.61 898,201.69 74.73
Birds 6674.69 0.56 52,993.25 4.41 87,663.19 7.29 1,054,628.13 87.74
Amphibians 2336.75 0.19 7164.81 0.60 12,731.81 1.06 1,179,725.88 98.15
Reptiles 6854.81 0.57 16,851.94 1.40 10,445.75 0.87 1,167,806.75 97.16
All 54,994.25 4.58 102,822.25 8.55 197,048.69 16.39 847,094.06 70.48
Table 1. Area (km2), and its proportion (%) to total area with different levels of importance for biodiversity
conservation in Tibet.
Important areas for protection of amphibians in Tibet were mainly found in the south of Nyingchi City
(Fig. 2D); extremely important and important areas totaled 2336.75 and 7164.81 km2, respectively, accounting
for 0.19 and 0.60% of the total area of Tibet.
Important areas for reptile protection were mainly distributed in the south of Nyingchi and Shannan Cities
(Fig. 2E). In that, extremely important and important areas totaled 6854.81 and 16,851.94 k m2, respectively,
accounting for 0.57 and 1.40% of the total area of Tibet (Table 1). Important areas for protection of all endangered
species in Tibet Autonomous Region were mainly distributed in the south of Nyingchi and Shannan Cities, and
in the west of Ngari Region (Fig. 2F). In that, extremely important and important areas totaled 54,994.25 and
102,822.25 km2, respectively, accounting for 4.58 and 8.55% of the total area of Tibet (Table 1).
Importance pattern of ecosystem service function. For biophysical supply, areas that were extremely
important and important for carbon sequestration were mainly distributed in the south of Nyingchi and Shan-
nan Cities, and on the periphery of Qamdo City; these areas accounted for 3.52 and 2.99%, respectively, of the
total area of Tibet (Table 2). Areas that had medium importance for carbon sequestration were mainly distrib-
uted in the south of Qamdo City, accounting for 2.77% of the total area (Fig. 3A).
Extremely important and important areas for water conservation were mainly distributed in the south of
Nyingchi and Shannan Cities, and in the southeastern part of Nagqu City, accounting for 11.90% of the total
area of Tibet (Table 2). Important areas for water conservation were mainly east of Qamdo and Nagqu Cities,
accounting for 14.36% of the total area. Medium importance areas were mainly in the north of Lhasa and Shan-
shan Cities, accounting for 14.50% of the total area of Tibet (Fig. 3B).
Extremely important and important areas for soil conservation were mainly distributed south of Nyingchi
and Shannan Cities, and east of Qamdo City, accounting respectively for 7.93 and 8.80% of the total area of Tibet
Scientific Reports | (2022) 12:1161 | https://doi.org/10.1038/s41598-021-03653-6 5
Vol.:(0123456789)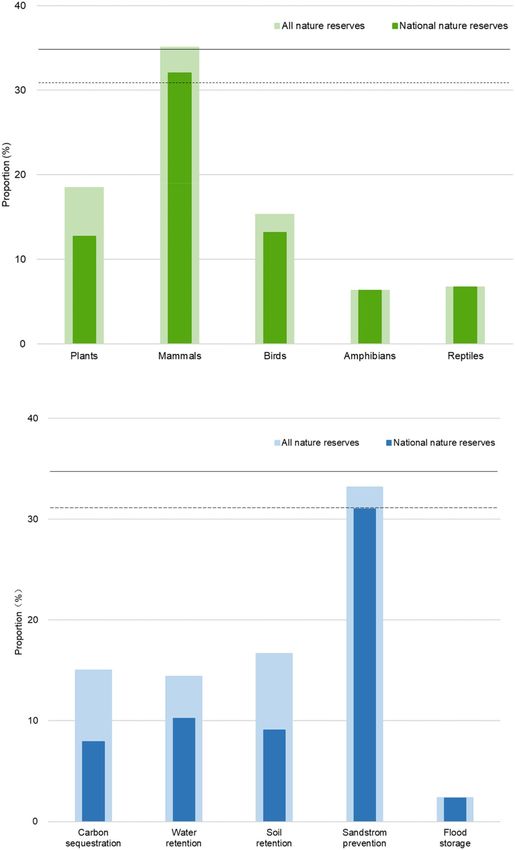
www.nature.com/scientificreports/
Extremely Medium
important Important importance General importance
Type Area/km2 % Area/km2 % Area/km2 % Area/km2 %
Carbon sequestration 42,345.69 3.52 35,773.75 2.98 33,273.63 2.77 1,090,566.19 90.73
Water conservation 143,057.00 11.90 172,578.81 14.36 174,306.44 14.50 712,017.00 59.24
Soil conservation 95,311.19 7.93 105,816.94 8.80 127,116.00 10.58 873,715.13 72.69
Windbreak and sand fixation 79,077.25 6.58 75,374.50 6.27 70,415.75 5.86 977,091.75 81.29
Flood regulation 16,111.69 1.34 20,472.75 1.70 38,616.44 3.21 1,126,758.38 93.74
All 290,653.25 24.18 249,118.50 20.73 224,450.25 18.67 437,737.25 36.42
Table 2. Area and proportion with different levels of importance for ecosystem services in Tibet.
Figure 3. Spatial distribution pattern of ecosystem services importance in Tibet, (A) spatial distribution of
the importance of carbon sequestration, (B) spatial distribution of the importance of water retention, (C)
spatial distribution of the importance of soil retention, (D) spatial distribution of the importance of sandstorm
prevention, (E) spatial distribution of the importance of flood storage, (F) spatial distribution of the importance
of ecosystem services. We created this figure in using ArcGIS 10.5 for maps (URL: http://www.esri.com/).
(Table 2). Medium importance areas for soil conservation were mainly distributed in Xigazê City, accounting
for 10.58% of the total area (Fig. 3C).
Extremely important and important areas for sandstorm prevention were distributed in Nagqu City and Ngari
Region (Fig. 3D). Extremely important and important areas for flood regulation in Tibet were mainly distributed
in the south of Nyingchi and Shannan Cities (Fig. 3E), accounting for 1.34 and 1.70%, respectively (Table 2).
Extremely important areas for ecosystem service protection were mainly distributed south of Nyingchi and
Shannan Cities, northwest and southeast of Nagqu City, and south of Ngari Region, accounting for 42.42% of
the total area (Table 2). Important areas were mainly distributed in the middle of Qamdo and Nagqu Cities,
accounting for 20.73% of the total area. Medium importance areas were mainly distributed in Lhasa and Xigazê
Cities, and northwest of Shannan City, accounting for 18.16% of the total area of Tibet (Fig. 3F).
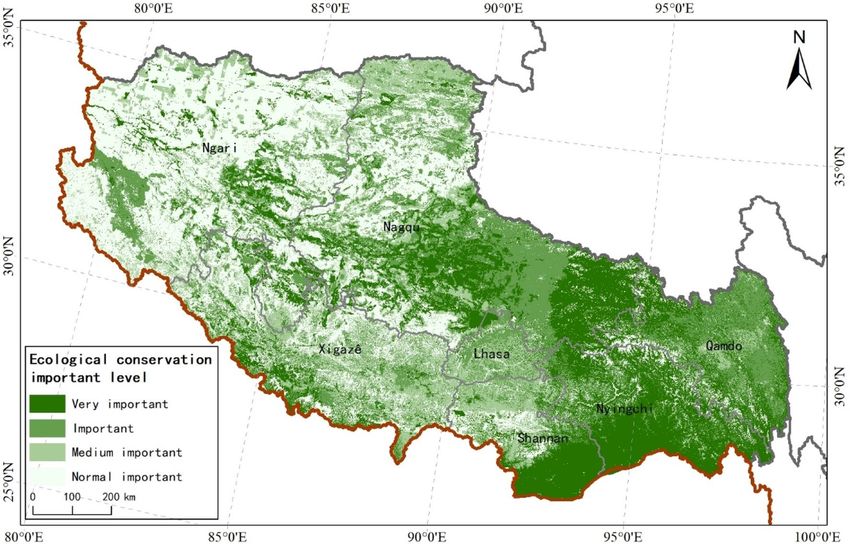
Comprehensive spatial pattern of ecosystem service. Ecological diversity in Tibet Autonomous
Region overlapped with areas important for carbon sequestration, water conservation, soil conservation, and
flood regulation function; these areas were mainly distributed in the south of Nyingchi City and Shannan City
(Fig. 4). Considering both biological diversity and the importance of ecosystem service function, extremely
important and important areas of Tibet’s ecological protection totaled 300,024.13 and 281,246.56 km2, respec-
tively, accounting for 24.96 and 23.40% of the total area of Tibet; these areas were mainly distributed in the
south of Nyingchi City, Qamdo City, Nagqu City, and Shanna City, and in the southeast of Ngari Region. Areas
of medium importance for ecological protection totaled 222,343.94 km2, accounting for 18.5% of the total area;
this was mainly distributed in Xigazê City, Lhasa City, Shannan City, and in the northwest of Nagqu City (Fig. 4).
Protection status analysis and nature reserve system planning. The results of spatial overlapping
of nature reserves with different groups of endangered species and ecosystem service function indicated that the
existing nature reserves had low effectiveness in biological diversity protection in Tibet Autonomous Region
Scientific Reports | (2022) 12:1161 | https://doi.org/10.1038/s41598-021-03653-6 6
Vol:.(1234567890)www.nature.com/scientificreports/
Figure 4. Spatial distribution pattern of ecosystem services in Tibet. We created this figure in using ArcGIS
10.5 for maps (URL: http://www.esri.com/).
(Fig. 5). National nature reserves are mainly nature reserves for plants, reptiles, mammals, and amphibians, and
serve as protection areas for birds, reptiles, and plants more so than for the other endangered species. The effect
of all nature reserves on 5 ecosystem services functions used in this study indicating that current nature reserves
will not secure ecological functions. In that, however, the protection effect of windbreak and sand stabilization
was greater than that of other ecosystem service functions. National nature reserves had a better effect than on
windbreak and sand stabilization. Additionally, their effect on water conservation and soil conservation was
better than on other ecosystem services. Finally, we have redefined the protected areas system in China’s Tibet
Autonomous Region (Fig. 6).
Discussion
Biological diversity. We found that important and medium-importance areas for endangered species pro-
tection in Tibet Autonomous Region were not adjacent to each other. There are two possible reasons for the
spatial separation43. First, the influence of human activities on biological diversity in Tibet Region played a
very important role. Second, targeted protection strategies should be adopted for different protection goals and
types of protected areas44. For example, we propose that new nature reserves be established or existing ones
expanded in the southern part of the Tibet Autonomous Region, with biological diversity as the main protection
goal; further, development activities threatening biological diversity should be prohibited or controlled, and the
connectedness of plant and animal habitats should be strengthened by constructing ecological corridors, and
by restoring h abitats45. We propose that ecosystem services become the main protection goal in Nagqu Region;
there, new ecological protection areas should be established, water conservation ability improved, water and soil
loss limited via ecological restoration, and a ban implemented on any new construction that is irrelevant to water
protection, windbreak, sand stabilization, and soil conservation46.
Comprehensive spatial pattern. Increasingly more people hope that conservation areas can achieve
dual goals—protection of biodiversity and security of ecosystem services. When the importance of biological
diversity and ecosystem service function was considered together, we found that the extremely important and
important areas for ecological protection accounted for 24.96 and 23.40% of the total area of Tibet. Further, we
found that the newly established nature reserves aimed at biological diversity protection and ecosystem ser-
vice function, and newly established ecological function protection areas aimed at ecosystem service function
protection47. The area of newly established nature reserves was 60,000 square meters, accounting for 5.05% of
the total area of Tibet alone; it was capable of providing important protection for biological diversity48. The area
of newly established ecological function protection areas reached 65,200 square meters, accounting for 5.42%
of the total area of Tibet; this was capable of providing extremely important water conservation, windbreak and
sand stabilization, and soil conservation function49.
Our research focus ranged from biodiversity to ecosystem services for human well-being. A new reserve
can create harmony between man and nature, and improve the health of both. We propose to establish nature
Scientific Reports | (2022) 12:1161 | https://doi.org/10.1038/s41598-021-03653-6 7
Vol.:(0123456789)www.nature.com/scientificreports/
Figure 5. Biodiversity and ecosystem services conservation effectiveness map, solid line indicates the
percentage of Tibet area taken up by all nature reserves, dashed line solid line indicated the percentage of Tibet
area taken up by national nature reserves.
Scientific Reports | (2022) 12:1161 | https://doi.org/10.1038/s41598-021-03653-6 8
Vol:.(1234567890)www.nature.com/scientificreports/
Figure 6. The system planning of Tibet Protected area based on the spatial pattern of biodiversity and
ecosystem services. We created this figure in using ArcGIS 10.5 for maps (URL: http://www.esri.com/).
reserves in which human activity is highly restricted and a new category of ecosystem service reserves in which
those human activities would be allowed that do not affect critical s ervices50. We also propose to create a new
category of effectiveness appraisal systems in China, which can continuously help to achieve ecosystem services
and sustainable development goals. Diversity can also be protected from the micro community level, for example,
through community p articipation51, however, that extends beyond the scope of this study.
Policy significance. Biological diversity and ecosystem service are the two main goals of ecological
rotection52. Nature reserve protection system, which addresses both biological diversity and ecosystem ser-
p
vice, is beneficial for all-inclusive interests in protection areas, acceptable for local governments and citizens,
and favorable to the construction of nature reserves53. However, areas of importance for biological diversity
protection in Tibet did not overlap spatially with those of importance for ecosystem service protection; there-
fore nature reserves in northwestern part of Tibet, with biological diversity as the main protection aim, do not
address the protection needs of ecosystem service functions54. To protect both—biological diversity and eco-
system service function, current protection system needs to be o ptimized55. In this study, we found overlapping
protection areas of biological diversity and ecosystem service mainly in the south of Shannan City and Nyingchi
City, with important areas of biological diversity protection relatively small, while those of ecosystem service
protection relatively large56.
Conclusions
Our results showed that important areas for endangered plants were distributed mainly south of Nyingchi City.
Important areas for endangered mammal protection were found mainly south of Nyingchi and Shannan City.
Further, important areas of biological diversity overlapped with those of carbon sequestration, water conserva-
tion, soil conservation, and flood regulation to some extent. We conclude that the southern part of Nyingchi City,
Qamdo City, Nagqu City, Shannan City, and the southeastern part of Ngari Region are key areas for ecological
restoration because of their role in biodiversity and ecosystem services.
This study shed some light on possible goals for ecosystem restoration in the Tibet Region of China; namely,
ecosystem restoration should aim for ecosystem services and biological diversity. The study also showcased
the insufficient effectiveness of nature reserves and national nature reserves in biodiversity protection in Tibet
Autonomous Region, and relatively satisfactory effect on bird, reptile, and plant protection.
Received: 23 October 2020; Accepted: 22 November 2021
Scientific Reports | (2022) 12:1161 | https://doi.org/10.1038/s41598-021-03653-6 9
Vol.:(0123456789)www.nature.com/scientificreports/
References
1. Cao, S. & Zhang, J. Political risks arising from the impacts of large-scale afforestation on water resources of the Tibetan Plateau.
Gondwana Res. 28, 898–903 (2015).
2. Kinzig, A. P. et al. Response—Ecosystem services: Free lunch no more. Science 335, 656 (2012).
3. Zhang, J. et al. Natural recovery and restoration in giant panda habitat after the Wenchuan earthquake. For. Ecol. Manage. 319,
1–9 (2014).
4. Chen, Z. et al. Land-use change from arable lands to orchards reduced soil erosion and increased nutrient loss in a small catch-
ment. Sci. Total Environ. 648, 1097–1104 (2019).
5. Boerema, A., Van Passel, S. & Meire, P. Cost-effectiveness analysis of ecosystem management with ecosystem services: From theory
to practice. Ecol. Econ. 152, 207–218 (2018).
6. Bouwma, I. et al. Adoption of the ecosystem services concept in EU policies. Ecosyst. Serv. 29, 213–222 (2018).
7. Carpenter, S. R. et al. Millennium ecosystem assessment: Research needs. Science 314, 257 (2006).
8. Xiao, Q., Tao, J., Xiao, Y. & Qian, F. Monitoring vegetation cover in Chongqing between 2001 and 2010 using remote sensing data.
Environ. Monit. Assess. 189, 493 (2017).
9. Harrison, X. A. et al. A brief introduction to mixed effects modelling and multi-model inference in ecology. PeerJ 6, e4794 (2018).
10. Zhang, J. et al. Modeling activity patterns of wildlife using time-series analysis. Ecol. Evol. 7, 2575–2584 (2017).
11. Fu, B. et al. Hydrogeomorphic ecosystem responses to natural and anthropogenic changes in the Loess Plateau of China. Annu.
Rev. Earth Planet. Sci. 45, 223–243 (2017).
12. Ouyang, W. et al. Combined impacts of land use and soil property changes on soil erosion in a mollisol area under long-term
agricultural development. Sci. Total Environ. 613–614, 798–809 (2018).
13. Arneth, A. et al. Post-2020 biodiversity targets need to embrace climate change. Proc. Natl. Acad. Sci. 117, 30882 (2020).
14. Keyes, A. A., McLaughlin, J. P., Barner, A. K. & Dee, L. E. An ecological network approach to predict ecosystem service vulner-
ability to species losses. Nat. Commun. 12, 1586 (2021).
15. Feng, X. et al. Human cystic and alveolar echinococcosis in the Tibet Autonomous Region (TAR), China. J. Helminthol. 89, 671–679
(2015).
16. Hallquist, M. et al. Photochemical smog in China: Scientific challenges and implications for air-quality policies. Natl. Sci. Rev. 3,
401–403 (2016).
17. Zhang, G. G. et al. Abundance and conservation of waterbirds breeding on the Changtang Plateau, Tibet Autonomous Region,
China. Waterbirds 38, 19–29 (2015).
18. Sun, D. et al. Soil erosion and water retention varies with plantation type and age. For. Ecol. Manage. 422, 1–10 (2018).
19. Wangdwei, M., Steele, B. & Harris, R. B. Demographic responses of plateau pikas to vegetation cover and land use in the Tibet
Autonomous Region, China. J. Mammal. 94, 1077–1086 (2013).
20. Zhuo, G., La, B., Pubu, C. & Luo, B. Study on daily surface evapotranspiration with SEBS in Tibet Autonomous Region. J. Geogr.
Sci. 24, 113–128 (2014).
21. Butarbutar, T., Soedirman, S., Neupane, P. R. & Köhl, M. Carbon recovery following selective logging in tropical rainforests in
Kalimantan, Indonesia. For. Ecosyst. https://doi.org/10.1186/s40663-019-0195-x (2019).
22. Yu, W. J. & Zhou, W. Q. Spatial pattern of urban change in two Chinese megaregions: Contrasting responses to national policy and
economic mode. Sci. Total Environ. 634, 1362–1371 (2018).
23. Storch, F., Kändler, G. & Bauhus, J. Assessing the influence of harvesting intensities on structural diversity of forests in south-west
Germany. For. Ecosyst. https://doi.org/10.1186/s40663-019-0199-6 (2019).
24. Xiao, Y. & Xiao, Q. Identifying key areas of ecosystem services potential to improve ecological management in Chongqing City,
southwest China. Environ. Monit. Assess 190, 258 (2018).
25. Ge, J. et al. Modeling alpine grassland cover based on MODIS data and support vector machine regression in the headwater region
of the Huanghe River, China. Remote Sens. Environ. 218, 162–173 (2018).
26. Symes, W. S., Edwards, D. P., Miettinen, J., Rheindt, F. E. & Carrasco, L. R. Combined impacts of deforestation and wildlife trade
on tropical biodiversity are severely underestimated. Nat. Commun. 9, 4052 (2018).
27. Xin, S. et al. Forestland-cover changes in China’s tropical area: Historical patterns, implications, and policy options-a case study
from Xishuangbanna. J. Sustain. For. 36, 18–31 (2017).
28. Rao, Y. et al. Integrating ecosystem services value for sustainable land-use management in semi-arid region. J. Clean. Prod. 186,
662–672 (2018).
29. Ricketts, T. H. et al. Disaggregating the evidence linking biodiversity and ecosystem services. Nat. Commun. 7, 13106 (2016).
30. Nguyen, M. D., Ancev, T. & Randall, A. Forest governance and economic values of forest ecosystem services in Vietnam. Land Use
Policy 97, 103297 (2018).
31. Xu, W. et al. Strengthening protected areas for biodiversity and ecosystem services in China. Proc. Natl. Acad. Sci. U.S.A. 114,
1601–1606 (2017).
32. Ouyang, Z. et al. Using gross ecosystem product (GEP) to value nature in decision making. Proc. Natl. Acad. Sci. U.S.A. 117,
14593–14601 (2020).
33. Anne, B. et al. Towards an operational methodology to optimize ecosystem services provided by urban soils. Landsc. Urban Plan.
176, 1–9 (2018).
34. Karlen, D. L., Peterson, G. A. & Westfall, D. G. Soil and water conservation: Our history and future challenges. Soil Sci. Soc. Am.
J. 78, 1493–1499 (2014).
35. Tuo, D., Xu, M. & Gao, G. Relative contributions of wind and water erosion to total soil loss and its effect on soil properties in
sloping croplands of the Chinese Loess Plateau. Sci. Total Environ. 633, 1032–1040 (2018).
36. Rubio-Delgado, J., Schnabel, S., Gómez-Gutiérrez, Á. & Sánchez-Fernández, M. Estimation of soil erosion rates in dehesas using
the inflection point of holm oaks. CATENA 166, 56–67 (2018).
37. Abouabdillah, A. et al. Evaluation of soil and water conservation measures in a semi-arid river basin in Tunisia using SWAT. Soil
Use Manage. 30, 539–549 (2014).
38. Dominati, E. J., Mackay, A., Lynch, B., Heath, N. & Millner, I. An ecosystem services approach to the quantification of shallow
mass movement erosion and the value of soil conservation practices. Ecosyst. Serv. 9, 204–215 (2014).
39. Engdawork, A. & Bork, H.-R. Long-term indigenous soil conservation technology in the Chencha Area, Southern Ethiopia: Origin,
characteristics, and sustainability. Ambio 43, 932–942 (2014).
40. Sverdrup, H. U. & Olafsdottir, A. H. Considerations on the future biomass production potential of Iceland, and what role that
could have in future fuel supply and carbon balances. J. Sustain. For. 36, 647–665 (2017).
41. Ofoegbu, C. & Speranza, C. I. Assessing rural peoples’ intention to adopt sustainable forest use and management practices in South
Africa. J. Sustain. For. 36, 729–746 (2017).
42. Munyati, C. & Sinthumule, N. I. Cover gradients and the forest-community frontier: Indigenous forests under communal manage-
ment at Vondo and Xanthia, South Africa. J. Sustain. For. 33, 757–775 (2014).
43. Xiao, Q., Gao, Y., Hu, D., Tan, H. & Wang, T. Assessment of the interactions between economic growth and industrial wastewater
discharges using co-integration analysis: A case study for China’s Hunan Province. Int. J. Environ. Res. Public Health 8, 2937–2950
(2011).
Scientific Reports | (2022) 12:1161 | https://doi.org/10.1038/s41598-021-03653-6 10
Vol:.(1234567890)www.nature.com/scientificreports/
44. Sun, Q., Miao, C., Qiao, Y. & Duan, Q. The nonstationary impact of local temperature changes and ENSO on extreme precipitation
at the global scale. Clim. Dyn. 49, 4281–4292 (2017).
45. Cao, S., Chen, L., Xu, C. & Liu, Z. Impact of three soil types on afforestation in China’s Loess Plateau: Growth and survival of six
tree species and their effects on soil properties. Landsc. Urban Plan. 83, 208–217 (2007).
46. Setten, G. & Brown, K. M. Ecosystem services as an integrative framework: What is the potential? Land Use Policy 75, 549–556
(2018).
47. Arroyo-Vargas, P., Fuentes-Ramírez, A., Muys, B. & Pauchard, A. Impacts of fire severity and cattle grazing on early plant dynamics
in old-growth Araucaria-Nothofagus forests. For. Ecosyst. https://doi.org/10.1186/s40663-019-0202-2 (2019).
48. Paudel, S. & Sah, J. P. Effects of different management practices on stand composition and species diversity in subtropical forests
in Nepal: Implications of community participation in biodiversity conservation. J. Sustain. For. 34, 738–760 (2015).
49. Su, L., Miao, C., Borthwick, A. G. L. & Duan, Q. Wavelet-based variability of Yellow River discharge at 500-, 100-, and 50-year
timescales. Gondwana Res. 49, 94–105 (2017).
50. Enquist, B. J., Abraham, A. J., Harfoot, M. B. J., Malhi, Y. & Doughty, C. E. The megabiota are disproportionately important for
biosphere functioning. Nat. Commun. 11, 699 (2020).
51. Schuldt, A. et al. Multiple plant diversity components drive consumer communities across ecosystems. Nat. Commun. 10, 1460
(2019).
52. Miao, C., Sun, Q., Duan, Q. & Wang, Y. Joint analysis of changes in temperature and precipitation on the Loess Plateau during the
period 1961–2011. Clim. Dyn. 47, 3221–3234 (2016).
53. Zhang, J. et al. Divergent responses of sympatric species to livestock encroachment at fine spatiotemporal scales. Biol. Conserv.
209, 119–129 (2017).
54. Cao, S., Liu, Y., Su, W., Zheng, X. & Yu, Z. The net ecosystem services value in mainland China. Sci. China Earth Sci. 61, 595–603
(2018).
55. Waiswa, D., Stern, M. J. & Prisley, S. P. Drivers of deforestation in the Lake Victoria crescent, Uganda. J. Sustain. For. 34, 259–275
(2015).
56. Xiao, Q. & Hu, D. Dynamic characteristics of a water resource structure in an urban ecological system: Structure modelling based
on input–occupancy–output technology. J. Clean. Prod. 153, 548–557 (2017).
Acknowledgements
This study was supported by National Key R & D Program of China (No. 2016YFC0503004, No.
2018YFC0506905). The study on Monitoring Technology of Ecological Protection Redline in Typical Regions
of Tibet (No. 2019 [44]). We would like to thank Kathryn Piatek for her help in writing this paper as well as
journal editors and anonymous reviewers for their comments on an earlier version of this manuscript.
Author contributions
K.P.X. and X.H.W. collected and analyzed the data and were major contributors in writing the manuscript.
J.J.W., L.F., J.N.W., R.S.T., H.X.C., X.Z. and R.F.G. made substantial contributions to the conception and design,
the interpretation of data, and writing of the manuscript. All authors read and approved the final manuscript.
Competing interests
The authors declare no competing interests.
Additional information
Correspondence and requests for materials should be addressed to X.W.
Reprints and permissions information is available at www.nature.com/reprints.
Publisher’s note Springer Nature remains neutral with regard to jurisdictional claims in published maps and
institutional affiliations.
Open Access This article is licensed under a Creative Commons Attribution 4.0 International
License, which permits use, sharing, adaptation, distribution and reproduction in any medium or
format, as long as you give appropriate credit to the original author(s) and the source, provide a link to the
Creative Commons licence, and indicate if changes were made. The images or other third party material in this
article are included in the article’s Creative Commons licence, unless indicated otherwise in a credit line to the
material. If material is not included in the article’s Creative Commons licence and your intended use is not
permitted by statutory regulation or exceeds the permitted use, you will need to obtain permission directly from
the copyright holder. To view a copy of this licence, visit http://creativecommons.org/licenses/by/4.0/.
© The Author(s) 2022
Scientific Reports | (2022) 12:1161 | https://doi.org/10.1038/s41598-021-03653-6 11
Vol.:(0123456789)You can also read