Effect of Seat Backrest Inclination on the Muscular Pattern and Biomechanical Parameters of the Sit-to-Stand
←
→
Page content transcription
If your browser does not render page correctly, please read the page content below
ORIGINAL RESEARCH
                                                                                                                           published: 09 September 2021
                                                                                                                        doi: 10.3389/fnhum.2021.678302

                                           Effect of Seat Backrest Inclination on
                                           the Muscular Pattern and
                                           Biomechanical Parameters of the
                                           Sit-to-Stand
                                           Nadège Tebbache and Alain Hamaoui*
                                           Laboratoire CIAMS, Université Paris-Saclay, Saint Aubin, France

                                           Objectives: The sit-to-stand (STS) transfer mobilizes an extended part of the kinematic
                                           chain throughout a postural phase characterized by a flexion of the trunk and a focal
                                           phase consisting of a whole-body extension. The aim of this study was to analyze the
                                           variations of the global muscular pattern and the biomechanical parameters in both
                                           phases, in relation with seat backrest inclination.
                                           Methods: Fifteen participants were asked to stand up from a seat with 5 backrest
                         Edited by:        inclination settings and at 2 execution speeds. The ground reaction forces and the
                     Teddy Caderby,        activity levels of fifteen muscles of the trunk and lower limbs were investigated.
    Université de La Réunion, France
                        Reviewed by:       Results: Backrest-induced modifications were mainly observed in the postural phase:
                    Romain Tisserand,      inclining the backrest backward increased the phase duration and the activity level of
        University of British Columbia,
                                Canada
                                           the sternocleidomastoideus and the rectus abdominis, while it reduced the activity of
                         Lars Janshen,     the tibialis anterior. It also allowed for an increased maximal anteroposterior velocity of
        Humboldt University of Berlin,     the body center of mass. Higher execution speed led to increased and earlier muscular
                               Germany
                                           activities of many trunk and lower limbs muscles, predominantly in the postural phase.
                 *Correspondence:
                      Alain Hamaoui        Discussion: Taken together, these results suggest that a greater backrest inclination
      alain.hamaoui@universite-paris-
                             saclay.fr
                                           increases the demand in the postural phase due to the increase of the upper body
                                           gravity torque about the ischial tuberosities, and requires an adaptation of muscular
                   Specialty section:      activity levels and timing, but with the same overall pattern. The kinetic energy gained
        This article was submitted to
                  Motor Neuroscience,      during the longer excursion of the trunk may also require less activation of the lower
                a section of the journal   limbs muscles involved in the generation of propulsive forces of the body.
    Frontiers in Human Neuroscience
                                           Keywords: sit-to-stand, backrest inclination, speed, ground reaction forces, electromyography, anticipatory
          Received: 09 March 2021
                                           postural adjustments
            Accepted: 23 July 2021
     Published: 09 September 2021
                              Citation:    INTRODUCTION
          Tebbache N and Hamaoui A
        (2021) Effect of Seat Backrest
                                           The sit-to-stand (STS) is the demanding and frequent transfer from the seated posture to the
  Inclination on the Muscular Pattern
and Biomechanical Parameters of the
                                           standing posture. From a kinematic point of view, the STS consists of a trunk flexion phase followed
                          Sit-to-Stand.    by an extension of the trunk and lower limbs initiated after seat unloading (Kelley et al., 1976; Nuzik
  Front. Hum. Neurosci. 15:678302.         et al., 1986; Rodosky et al., 1989; Hirschfeld et al., 1999; Boukadida et al., 2015). Integrating kinetics,
   doi: 10.3389/fnhum.2021.678302          Schenkman et al. (1990) assumed that trunk flexion moves the body center of mass forward but

Frontiers in Human Neuroscience | www.frontiersin.org                            1                            September 2021 | Volume 15 | Article 678302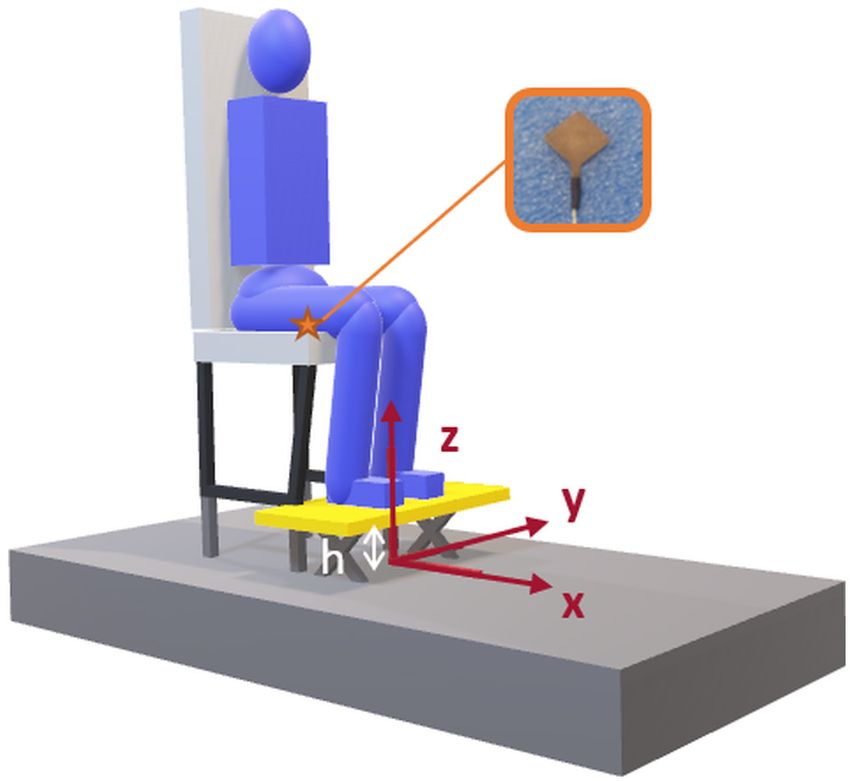
Tebbache and Hamaoui                                                                                             Backrest Inclination and Sit-to-Stand

above all increases the upper body forward momentum. This                      Two main phases can thus be distinguished during the
momentum is then transferred into a whole-body vertical                    STS task: one called postural phase, during which the
momentum once the seat is unloaded, allowing for whole-                    trunk is flexed forward, which acts as a preparation for
body extension.                                                            the other phase, when body extension takes place and seat
   The STS, a demanding task, requires the activation of a                 unloading occurs, namely the focal phase (Diakhaté et al., 2013;
large number of muscles with appropriate coordination. Some                Alamini-Rodrigues and Hamaoui, 2017; Hamaoui and Alamini-
common components of this muscular pattern can be extracted                Rodrigues, 2017). In between those 2 phases is the seat-off, when
from electromyographic studies. The first muscle to be activated           seat unloading occurs.
during the STS task is the tibialis anterior (TA) (Doorenbosch                 It has been shown that APAs are motor-task specific and are
et al., 1994; Roebroeck et al., 1994; Vander Linden et al., 1994;          organized according to a well-defined sequence. They adapt to
Gross et al., 1998; Khemlani et al., 1999; Rodrigues-de-Paula-             initial conditions, execution conditions (including speed) and
Goulart and Valls-Solé, 1999; Tebbache and Hamaoui, 2020). Its             to the functional state of the system (Bouisset and Do, 2008).
activity is associated with foot stabilization during trunk flexion        Therefore, the characteristics of the seat, which are a key factor
(Doorenbosch et al., 1994; Roebroeck et al., 1994; Vander Linden           in seated posture ergonomics, might induce APAs adaptations
et al., 1994; Gross et al., 1998; Khemlani et al., 1999). As in            when performing the STS task. Several studies explored those
many others forward oriented tasks, it is also involved in the             determinants biomechanically, mainly seat height (Rodosky et al.,
backward shift of the center of pressure in STS initiation, together       1989; Schenkman et al., 1996; Gillette and Stevermer, 2012; An
with the inhibition of the soleus muscle (Sol) (Crenna and                 et al., 2013; Yoshioka et al., 2014) and feet position (Shepherd and
Frigo, 1991). Head (sternocleidomastoid) and trunk (abdominal              Koh, 1996; Khemlani et al., 1999; Kawagoe et al., 2000; Gillette
muscles) flexors are recruited to perform the forward tilt of              and Stevermer, 2012; Ng et al., 2015). It was shown that lowering
the trunk (Rodrigues-de-Paula-Goulart and Valls-Solé, 1999).               seat height and putting the feet forward resulted in greater joint
Quadriceps, together with hamstrings, are then activated for seat          constraints (Burdett et al., 1985; Rodosky et al., 1989; Arborelius
unloading and lower limb extension, with head (upper trapezius)            et al., 1992). A lower seat led to increased trunk maximal angular
and spinal extensors guiding the verticalization of the whole body         velocity to increase upper body momentum generation (Hughes
(Munton et al., 1984; Roebroeck et al., 1994; Vander Linden                et al., 1994; Schenkman et al., 1996) or to failure in the case of
et al., 1994; Rodrigues-de-Paula-Goulart and Valls-Solé, 1999;             elderly subjects unable to use the momentum transfer strategy
Bouchouras et al., 2015; Chorin et al., 2016). Several studies             (Hughes et al., 1994).
reported that quadriceps, hamstrings and trunk extensors are                   However, the influence of seat backrest inclination in terms of
the main driving forces of the sit-to-stand and are activated              biomechanics remains to our knowledge understudied, although
once the vertical projection of the center of mass has been                most resting and transportation seats have an inclined backrest.
brought closer to the feet or its speed is sufficient (Pai and             In this setting, trunk flexion is initiated against the force of
Rogers, 1990; Vander Linden et al., 1994; Rodrigues-de-Paula-              gravity, instead of benefitting from it when the trunk is initially
Goulart and Valls-Solé, 1999; Hof et al., 2005). Posterior lower           upright (Millington et al., 1992). It also extends the trajectory
leg muscles control the horizontal momentum and stabilize the              of the center of mass during STS, offering opportunity for the
posture at the end of the STS (Doorenbosch et al., 1994; Khemlani          generation of a greater horizontal momentum in the postural
et al., 1999; Rodrigues-de-Paula-Goulart and Valls-Solé, 1999;             phase, which is a fundamental component of the postural phase
Cuesta-Vargas and Gonzalez Sanchez, 2013). In addition, a                  and of the STS strategy (Schenkman et al., 1990; Pai et al., 1994).
recent study exploring the effect of backrest inclination on                   Consequently, the question arises as to how the motor pattern
muscular activity showed an increase in the activity level of              of the postural and focal phases of the STS is adjusted to
upper body flexors (abdominal muscles and SCOM) and ST,                    seat backrest inclination. The first option might be a simple
together with a decrease in TA activity before seat unloading              adaptation of muscular activity levels, while the other would
(Tebbache and Hamaoui, 2020).                                              involve an in-depth reorganization of the program with a new
   According to Gelfand revisiting Bernstein’s ideas (Bernstein,           set of muscles being active at a different timing. Given the
1967), voluntary movements include a postural component                    importance of momentum control during the STS task, and in
related to stability and a focal component related to the                  order to analyze this task when maximal performance is sought, a
voluntary movement itself. Postural activity happens during                special interest was also given to the execution speed parameter. It
and after the focal movement, but mainly beforehand (Belenkii              was expected that performing the STS at maximum speed would
et al., 1967; Bouisset and Zattara, 1981; Cordo and Nashner,               exacerbate and make more visible the adaptation of the motor
1982) with Anticipatory Postural Adjustments (APAs). APAs                  program to backrest inclination.
precede the focal movement, and their assumed goals include                    Part of a similar question was addressed in a previous paper
compensation of the forthcoming perturbation associated with               (Tebbache and Hamaoui, 2020), which gave a first indication of
the focal movement (Bouisset and Zattara, 1987) as well as the             muscular variations in the postural phase. This paper aims to
generation of propulsive forces when the movement involves a               further deepen that analysis by an additional kinetics analysis
change of support base (Herman et al., 1973; Breniere and Do,              of the STS task. The main hypothesis was that inclined backrest
1986; Brenière and Do, 1991; Stapley et al., 1998). For the STS            requires a higher level of muscular activity during the postural
task, APAs occurring during the postural phase are rather used             phase, but induces an increased horizontal momentum which
for the latter purpose.                                                    may ease the focal phase.

Frontiers in Human Neuroscience | www.frontiersin.org                  2                                 September 2021 | Volume 15 | Article 678302
Tebbache and Hamaoui                                                                                                          Backrest Inclination and Sit-to-Stand

MATERIALS AND METHODS                                                                   Pressure Sensor
                                                                                        A 25-mm2 capacitive pressure sensor (C500 sensor PPS, Los
Participants                                                                            Angeles, United States) was inserted under the seatpan cushion,
Fifteen healthy subjects (7 males—8 females; age: 22.9 ± 3                              at mid-thigh level (Figure 1) and used to detect the onset
years; weight: 65.8 ± 9.7 kg; height: 171.6 ± 7.4 cm, BMI:                              of seat unloading.
22.2 ± 1.9 kg/m2 ), took part in this study. It was carried
out in accordance with the recommendations of the local                                 Electromyography
“Ethics Committee for Movement Analysis (CERAM), INU                                    A 16-channel wireless surface EMG device (Zero Wire Model,
Champollion,” which has approved this study. All subjects gave                          Aurion, Milan, Italy) was used. The signal was sampled at
written informed consent prior to the testing, in accordance with                       1,000 Hz, amplified with a gain of 1,000, the bandwidth was
the Declaration of Helsinki. Due to a technical issue, one subject                      10–500 Hz, and the common mode rejection ratio 90 dB.
was then excluded from the results analysis.                                               Surface EMG was collected on the dominant side of the
                                                                                        subject (as told by the subject), on 12 muscles: Upper trapezius
                                                                                        (TraS), sternocleidomastoideus (SCOM), neck extensors (NE),
Experimental Set-Up                                                                     rectus abdominis (RA), erector spinae in the thoracic region
Customized Adjustable Seat                                                              (ES T6), erector spinae in the lumbar region (ES L3), rectus
A specifically designed modular airline seat (part of a 2-seat                          femoris (RF), vastus medialis (VM), semitendinosus (ST),
row) was used in this study. It was made adjustable by ARTEC                            gastrocnemius medialis (GM), tibialis anterior (TA), and soleus
Aerospace company (Seilh, France) by modifying a regular                                (Sol). Electromyograms were obtained using Ag/AgCl pre-gelled
airline seat to allow for the investigation of the influence of                         disposable electrodes positioned 2 cm apart over the muscle
specific parameters. The backrest inclination, defined as the angle                     belly, in line with muscle fibers direction and on prepared skin.
between the backrest and the seatpan, was adjustable in the range                       All electrode placements were confirmed using palpation and
90◦ –130◦ continuously.                                                                 manual resistance tests, following SENIAM recommendations
                                                                                        (Hermens et al., 2000).
                                                                                           Maximal voluntary contraction (MVC) electromyograms
Force Platform                                                                          against manual resistance were recorded for amplitude
A 1 m × 2 m 6-channel custom-made force platform                                        normalization purposes, with two trials of 3 s for each muscle.
(Bertec, Columbus, United States), on which the adjustable
seat was screwed, was used to record forces and moments in                              Procedure
the three orthogonal directions (Figure 1) with a sampling                              The experimental parameters were backrest inclination angle
frequency of 1,000 Hz.                                                                  (90◦ –100◦ –110◦ –120◦ –130◦ ) and execution speed [comfortable
                                                                                        (CS)—maximal (MS)]. To standardize experimental conditions,
                                                                                        the participants were barefoot and in their underwear. They
                                                                                        first adopted a comfortable position on the seat, with their back
                                                                                        resting against the backrest. Floor height was adjusted beforehand
                                                                                        so that their thighs were horizontal, their feet flat on the floor,
                                                                                        and their lower legs vertical. Feet placement was at a self-selected
                                                                                        width, but the anterior-posterior position was imposed with the
                                                                                        back of the heel at the rear end of the adjustable foot platform.
                                                                                        Participants were asked to cross their arms loosely over their
                                                                                        chest, then to stand up in response to a verbal signal, at the
                                                                                        speed specified beforehand, namely comfortable or maximal.
                                                                                        The comfortable speed was described as the natural self-selected
                                                                                        speed used in daily life; the maximal speed was described as
                                                                                        “as fast as possible.” They were instructed to perform an STS
                                                                                        task shortly after a verbal signal was given, at a self-selected
                                                                                        moment in time. Once in the standing posture, subjects had to
                                                                                        keep still until an audio signal indicated the end of the trial. For
                                                                                        each combination of the five backrest inclination levels and two
                                                                                        execution speeds, five 6-s trials were performed, with a rest time
                                                                                        of 10 s between trials and 120 s between series. Two training trials
                                                                                        were implemented at each change of condition for the subjects to
                                                                                        familiarize with the task of standing at the relevant speed and with
  FIGURE 1 | Seat on the force platform. Axes were as follows: x-axis is along          a given backrest inclination.
  the anteroposterior direction and points forward, y-axis along the mediolateral
                                                                                            Execution speed was randomized, but backrest inclination
  axis, pointing to the left, and z-axis follows the vertical direction, pointing
  upward.
                                                                                        was performed in a systematic ascending order from 90◦ to
                                                                                        130◦ . Since the system of worm screw with crank used to

Frontiers in Human Neuroscience | www.frontiersin.org                               3                                 September 2021 | Volume 15 | Article 678302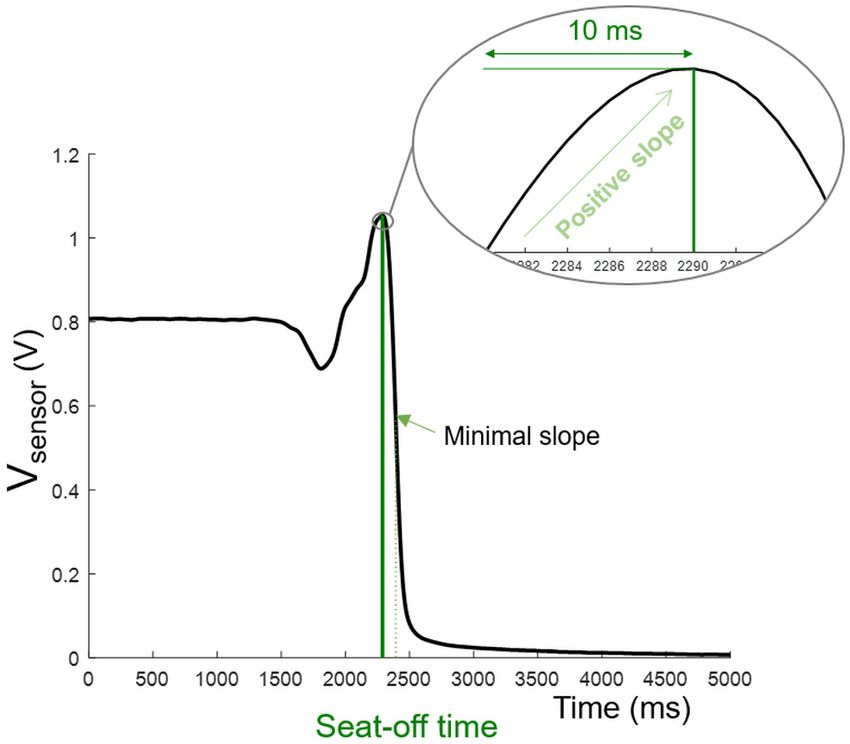
Tebbache and Hamaoui Backrest Inclination and Sit-to-Stand
set the backrest inclination at a precise level was very slow,
randomization would have excessively lengthened the duration
of the experiment.
Data Analysis
Electromyography
EMG signals were full-wave rectified, filtered with a band-pass
Butterworth filter (10–450 Hz) and smoothed (sliding window of
51 ms) (Conforto et al., 1999).
Muscle onset was detected using an algorithm based on the
work of Lidierth (1986). The muscle was considered active when
the mean amplitude of the EMG signal across the 50 following
samples exceeded the baseline mean by 2 baseline standard
deviations for more than 90 ms, without going below it for
more than 15 ms. Baseline parameters were calculated on the
50 ms before the verbal signal was given. Movement start time,
described below, was considered as the time origin and subtracted
from the onset times obtained.
Activity levels were calculated as the average rectified values
(ARV) of the EMG signal for each phase, normalized by the ARV
FIGURE 2 | Detection of start and end times. Start time corresponded to the
of the 3-s MVC signal. Each muscle was thus characterized by a fall of xp below the threshold calculated from the preceding 400 ms baseline
mean activity level for each phase, both expressed in percent of for at least 200 ms. Concerning end time, the detection area was reduced to
the MVC (APP and AFP ). the time interval following the first plateau after feet loading, and end time
preceded the first 400 ms where peak-to-peak CoP anteroposterior
displacement did not exceed 1 cm.
Force Plate and Pressure Sensor Data
Center of Pressure (CoP)
The anteroposterior position of the center of pressure (CoP)
End Time. End time was detected based on CoP displacement
was calculated from Equation 1, considering that the forces in
as well. The algorithm included successive steps to determine
the anteroposterior directions were applied at the height of the
the onset of the plateau following unloading, from which the
platform beneath the feet (h) (Figure 1), above the force platform.
CoP peak-to-peak amplitude on a 400 ms sliding window was
This simplification is addressed in the limitations section.
calculated. When this value did not exceed 1 cm, the algorithm
hFx − My was stopped, and the end time was associated with the last sample
xp = (1) of the window under consideration (Figure 2).
Fz
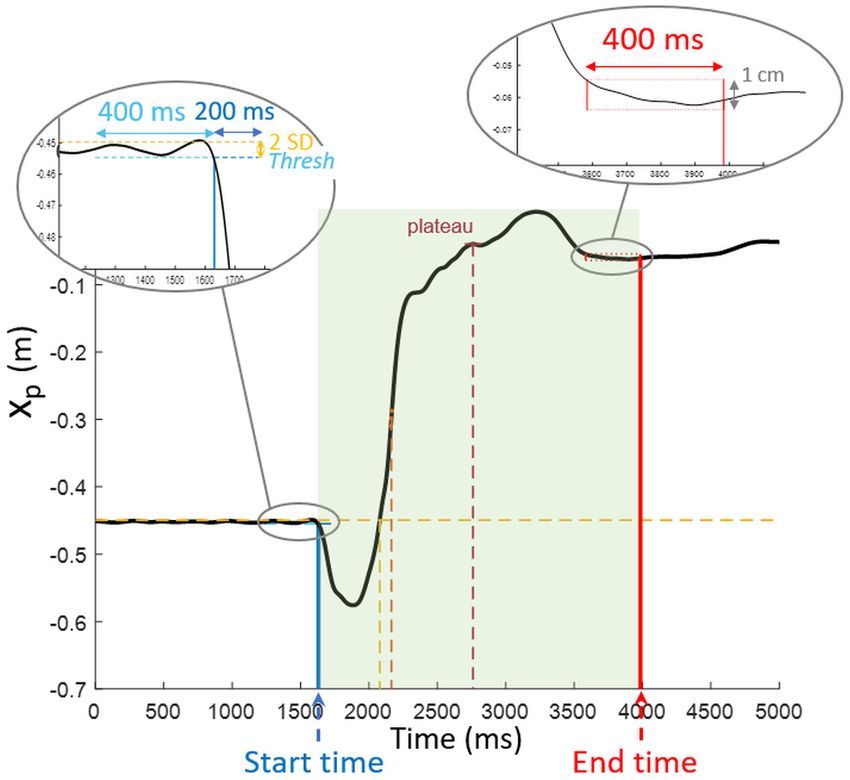
Seat-Off Time. Seat-off time was detected by means of the
Considering pressure sensor inside the seatpan structure under the cushion.
The algorithm detected the time associated with the steepest
– xp as the anteroposterior position of the CoP, negative slope, and then moved back to detect the time when
– h as the height of the adjustable platform beneath the feet, this slope changed sign and stayed positive for at least 10 ms,
– Fx as the total ground reaction force in the anteroposterior indicating the seat-off (Figure 3).
direction,
– Fz as the total ground reaction force in the vertical STS Indicators
direction, The STS was characterized by means of time, amplitude and
– My as the external moment along the mediolateral axis velocity parameters:
calculated at the center of the force platform.
– Anticipatory postural adjustments duration (dPP): time
Time Markers between start time and seat-off
Start time, end time, and seat-off time were measured to calculate – Focal phase duration (dFP): time between seat-off and end
the duration of the postural phase (dPP), the focal phase (dFP) time
and the entire STS (dSTS). – Total STS duration (dSTS): time between start time and end
time
Start Time. The STS transfer start time was associated with CoP – Anticipatory postural adjustments amplitude
backward displacement initiation. It was the first time when (1xp ): difference between the initial and the
all the values of a 200-ms window were lower than the mean minimal anteroposterior position of the CoP during
value calculated in the preceding 400-ms sliding baseline window the postural phase.
minus two standard deviations on this window (Figure 2). Start – Maximal CoG speeds in the anteroposterior (x0 G max)
time was associated with the first value of the 200-ms window. and vertical (z’G max) directions: peak of CoG speed
Frontiers in Human Neuroscience | www.frontiersin.org 4 September 2021 | Volume 15 | Article 678302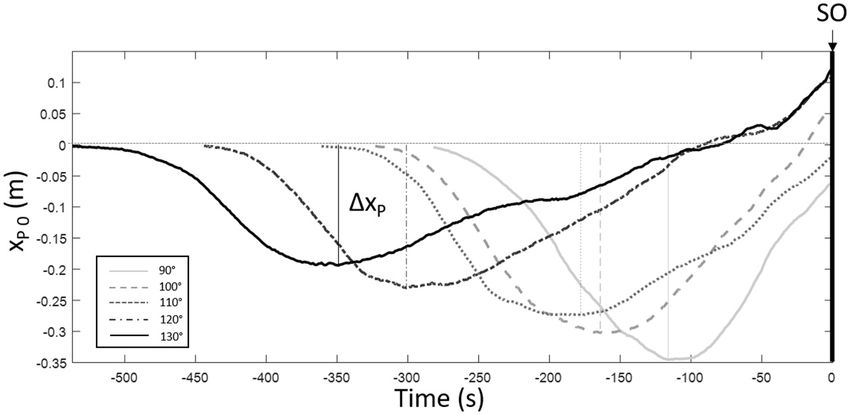
Tebbache and Hamaoui Backrest Inclination and Sit-to-Stand
Statistical Analysis
A 2-factor repeated-measures ANOVA was conducted for each
dependent variable, with backrest inclination (5 modalities) and
execution speed (2 modalities) as within-subjects factors, and
the level of significance set at 0.05. When statistical significance
was reached, simple contrasts were analyzed, by comparing each
backrest inclination setting above 90◦ to the 90◦ setting.
RESULTS
Our results are presented in tables, completed by figures for the
most relevant variations. The structure of the tables varies in
order to highlight the significant results. When no significant
interaction effect was found between the two independent
variables, namely backrest inclination and velocity, a different
table was made for each of these variables containing values
averaged over the different modalities of the other variable.
FIGURE 3 | Seat-off detection. Starting from the time of occurrence of the
steepest negative slope, the signal was analyzed backwards to identify the Electromyography
time when the slope changed sign and remained positive for at least 10 ms. Onset Times
Most muscles investigated were firstly activated during the
postural phase, with VM, RF, ST, and GM being activated close to
the beginning of the focal phase. A significant effect of backrest
inclination was observed on the onset times of 4 muscles, angles
higher than 90◦ being associated with delayed onsets for VM
(p < 0.001), and TA (p < 0.05), and TraS (p < 0.01 but with no
significant contrast compared to 90◦ ), and earlier onset of ES L3
(p < 0.01) (Table 1).
When comparing the 2 speed conditions, performing at
maximal speed significantly reduced the onset times of all
muscles investigated except SCOM and RA.
Furthermore, the ANOVA revealed a significant interaction
effect between backrest inclination × speed for ST (p < 0.01),
with a significant simple main effect of backrest inclination only
at comfortable speed (p < 0.05) but a significant effect of speed
for each backrest inclination (p < = 0.01).
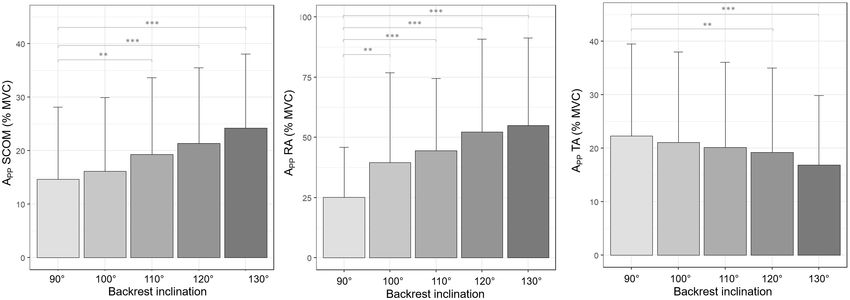
Activity Levels
When considering the mean activity levels, the most active
muscles during the postural phase, showing values higher than
25%, were mainly located in the trunk (RA, ES L3, ES T6) and
neck (NE, TraS) (Table 2). In the focal phase, these muscles were
in contrast located in the lower limbs (VM, TA, Sol, GM), with
FIGURE 4 | STS indicators. Vsensor represents the pressure sensor beneath decreased values for trunk and neck muscles (Table 3).
the seat; xp the position of the CoP, x0 G the anterioposterior velocity of the
Increasing backrest inclination resulted in significant
CoG; z’G the CoG vertical velocity.
variations of activity levels during the postural phase, with higher
values for SCOM (p < 0.001) and RA (p < 0.001), and lower
for TA (p < 0.05) (Table 2 and Figure 5). For this muscle, a
signals obtained by integrating accelerations with null significant decrease in activity was observed only from 120◦ on.
initial conditions (Figure 4). In the focal phase, increasing backrest inclination only led to
lower activity levels for RF (p < 0.05) and Sol (p < 0.05) (Table 3).
Shorter times to perform the STS and higher maximal speeds Execution speed significantly increased activity levels in the
were considered as indicators of a better performance, according postural phase of all muscles investigated except for TA and ES
to existing literature (Bouisset and Do, 2008; Diakhaté et al., 2013; T6, although their mean activity level still increased in condition
Hamaoui and Alamini-Rodrigues, 2017). MS (Table 4).
Frontiers in Human Neuroscience | www.frontiersin.org 5 September 2021 | Volume 15 | Article 678302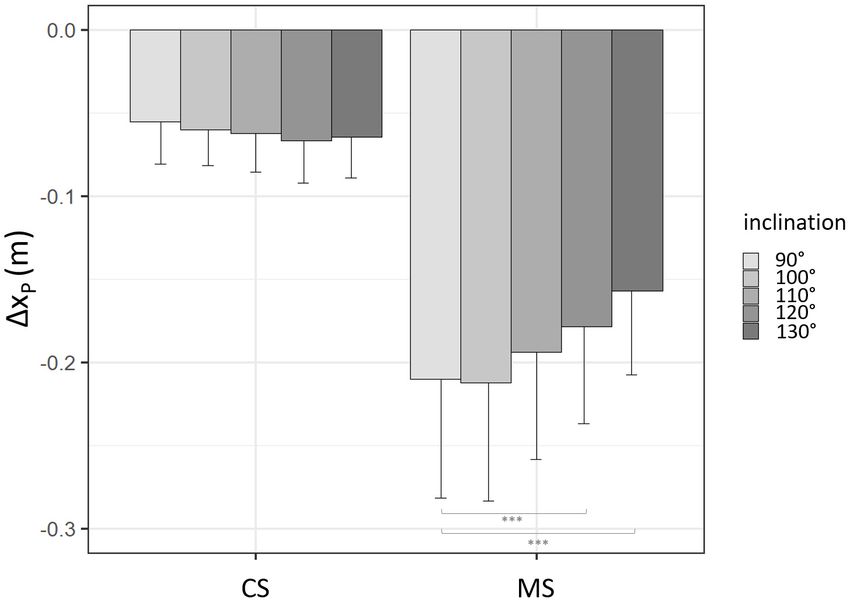
Tebbache and Hamaoui                                                                                                                              Backrest Inclination and Sit-to-Stand

TABLE 1 | Mean (SD) muscle onset times, in ms, for the 5 inclination conditions and for the 2 execution speeds, and p-values for effects of inclination (i), speed (V), and
their interaction (i*V).

Muscle            V                 90◦                   100◦                   110◦                   120◦                          130◦               p(i)       p(V)         p(i*V)

NE               CS            358.9 (220)           335.1 (269.3)           310.2 (344.1)          321.8 (292.3)             355.6 (382.6)              NS          ***          NS
                 MS           114.6 (155.1)           76.8 (167.4)           118.5 (216.9)           111.9 (238)               65.5 (174.9)
TraS             CS           168.9 (215.2)          123.7 (143.9)           140.6 (233.9)          126.3 (189.3)             163.1 (316.0)               **         NS           NS
                 MS             9.4 (71.8)            26.3 (114.4)            15.7 (76.6)            18.9 (84.7)                   9.1 (70.5)
                 /90◦                                      NS                     NS                     NS                            NS
SCOM             CS            58.5 (443.8)           30.9 (379.3)           –46.7 (163.2)           –89.4 (39.4)              –121.1 (63.5)             NS          NS           NS
                 MS            –45.8 (28.6)           55.9 (376.3)            –57.5 (25.8)           –66.7 (22.9)                  –68 (30.2)
RA               CS           105.1 (310.7)            –29.6 (76.8)            –60.7 (42)            –72.5 (55.3)                  –17.2 (76.5)          NS          NS           NS
                 MS            –16.3 (130.6)           –49.9 (32.1)           –53.7 (35.8)            –6.9 (119)                   –34.9 (47.9)
VM               CS           665.9 (205.3)          688.3 (163.5)           778.4 (201.4)          810.3 (185.7)             953.9 (257.9)              ***         ***          NS
                 MS           293.2 (103.7)          315.8 (109.4)            332 (140.4)           398.2 (142.2)             477.3 (184.8)
                 /90◦                                      NS                      **                    ***                           ***
RF               CS           569.8 (352.4)          520.1 (312.4)           590.1 (384.3)          462.8 (298.4)                  610.8 (365)           NS          ***          NS
                 MS            225.3 (165)            197.1 (189)             206.6 (217)           190.7 (162.1)             256.9 (198.5)
TA               CS            51.3 (100.7)            4.2 (48.4)             19.2 (55.1)            39.5 (29.3)               82.6 (127.3)               *          **           NS
                 MS             26.8 (76.5)            –30.3 (12.3)            –27 (19.9)             1.2 (57.9)                   0.7 (23.1)
                 /90◦                                       **                     *                     NS                            NS
Sol              CS           480.8 (341.2)          443.3 (432.4)           576.6 (485.7)          523.7 (497.4)                  667 (511)             NS          ***          NS
                 MS           153.8 (166.3)          172.3 (182.1)           163.1 (250.4)          122.7 (169.3)             199.3 (245.9)
GM               CS           634.8 (331.9)          638.9 (268.3)           691.3 (349.5)          748.2 (474.8)             719.8 (472.9)              NS          ***          NS
                 MS           160.6 (101.6)          203.6 (160.7)           207.3 (196.8)          192.1 (218.5)                  227 (234.4)
ST               CS           655.9 (159.9)           726.5 (192)            822.7 (265.7)           787.3 (318)              893.6 (399.3)               *                        **
                 /90◦                                      NS                      *                     NS                            ***
                 MS            272.1 (141)           302.3 (156.3)           340.5 (182.1)          323.8 (245.7)             280.1 (264.4)              NS
ES T6            CS            280 (180.5)           273.9 (139.6)           273.9 (183.1)          267.4 (220.4)             253.6 (188.7)              NS          ***          NS
                 MS             150 (77.9)            124.9 (90.1)            112.8 (88)            100.7 (93.5)              105.6 (114.5)
ES L3            CS           462.1 (182.6)           396.6 (111)             414 (225.4)           354.9 (145.1)             310.1 (142.7)               **         ***          NS
                 MS            148.9 (81.6)           131.5 (89.9)           113.3 (110.1)           93.7 (97.7)                    81.5 (93)
                 /90◦                                      NS                     NS                      **                           ***

When the global effect of inclination is significant, the contrasts for each inclination compared to i0 is also shown   (/90◦ ).   Symbols for the p-values are as follows: *p < 0.05;
**p < 0.01; ***p < 0.001; NS: p ≥ 0.05.

   During the focal phase, only half of the muscles investigated                             significantly lengthened postural phase duration under both
showed any significant variation according to execution speed,                               speed conditions (p < 0.001), and maximal speed produced the
with a systematically higher activity in MS condition: RA                                    reverse effect for all inclination levels (p < 0.001) (Table 5).
(p < 0.05), RF (p < 0.001), VM (p < 0.001), Sol (p < 0.05), GM
(p < 0.01), and ST (p < 0.01) (Table 4).
   No statistically significant effect of the interaction between                            CoP Maximal Backward Displacement (1xP )
execution speed and backrest inclination was found.                                          An interaction effect inclination × speed was evidenced by the
                                                                                             ANOVA (p < 0.001) (Figure 6), requiring that each simple main
                                                                                             effect be analyzed separately.
STS Indicators                                                                                   Backrest inclination had a significant effect only in the
Durations                                                                                    condition MS (p < 0.001), with CoP maximal backward
The total duration of the STS increased with backrest inclination                            displacement decreasing with backrest inclination at 120◦
(p < 0.01) and decreased with execution speed (p < 0.001)                                    inclination and 130◦ inclination compared to the 90◦ level
(Table 5), but some variations were also specific to each                                    (Figure 6 and Table 6).
phase of the STS.                                                                                The effects of backrest inclination on CoP parameters could
   When considering the focal phase, its duration was shortened                              be observed in the raw data presented in Figure 7, with
at maximum speed (p < 0.01), with no effect resulting from                                   smaller and earlier excursion of CoP traces associated with
backrest inclination. When focusing on the postural phase, an                                increased inclination.
interaction was found between the 2 factors (inclination × speed)                                Execution speed had a significant effect at each inclination
(p < 0.01), requiring a specific analysis of the simple main effect                          level with greater CoP maximal backward displacement at MS
of each variable for each different setting. Backrest inclination                            (p < 0.001) (Table 6).

Frontiers in Human Neuroscience | www.frontiersin.org                                   6                                              September 2021 | Volume 15 | Article 678302
Tebbache and Hamaoui Backrest Inclination and Sit-to-Stand
TABLE 2 | Mean (SD) muscle activity levels in the postural phase (APP ), in % MVC, vs. 561 ± 85 mm/s at CS) (Table 5). However, no variation was
for the 5 inclination conditions, calculated for both execution speeds.
observed according to backrest inclination.
APP 90◦ 100◦ 110◦ 120◦ 130◦ p(i)
NE 35.03 36.97 37.86 39.06 38.13 NS
(16.64) (17.31) (19.66) (20.92) (19.42)
DISCUSSION
p(/90◦ ) – – – –
TraS 33.22 31.03 24.91 24.6 22.99 NS
(23.75) (22.39) (13.77) (14.15) (13.61)
Effects of Backrest Inclination
p(/90◦ ) – – – –
Results calculated from EMG and force plate signals revealed
SCOM 14.64 16.19 19.33 21.38 24.21 ***
that the increase in backrest inclination levels caused significant
(13.53) (13.75) (14.3) (14.16) (13.89) variations of both muscular activity and biomechanical
p(/90◦ ) NS ** *** *** parameters during the STS.
RA 25.11 39.57 44.5 52.28 54.88 ***
(20.86) (37.31) (29.94) (38.53) (36.49)
p(/90◦ ) ** *** *** ***
TABLE 3 | Mean (SD) muscle activity levels in the focal phase (AFP ), in % MVC, for
VM 3.84 3.86 3.96 3.95 4.82 NS
the 5 inclination conditions, calculated for both execution speeds.
(2.56) (2.55) (2.55) (2.48) (6.02)
p(/90◦ ) – – – – AFP 90◦ 100◦ 110◦ 120◦ 130◦ p(i)
RF 5.45 6.07 5.97 6.04 5.45 NS
(4.4) (4.48) (4.31) (3.56) (3.51) NE 22.57 22.44 26.16 27.41 27.86 NS
p(/90◦ ) – – – – (12.45) (11.84) (19.37) (22.17) (21.72)
TA 22.31 21.09 20.15 19.25 16.9 ** p(/90◦ ) – – – –
(17.24) (19.96) (15.92) (15.76) (13) TraS 10.42 9.62 9.08 8.98 9.55 NS
p(/90◦ ) NS NS ** *** (7.49) (6.63) (5.77) (6.13) (7.37)
Sol 19.04 16.41 19.01 18.19 18.2 NS p(/90◦ ) – – – –
(14.05) (11.01) 18.17) (12.49) (12.69) SCOM 3.25 3.18 3.78 3.52 3.55 NS
p(/90◦ ) – – – – (1.93) (1.82) (2.23) (2.03) (2.24)
GM 16.25 14.82 14.74 16.95 15.7 NS p(/90◦ ) – – – –
(19.44) (16.95) (16.09) (16.02) (15.61) RA 5.61 5.82 5.63 5.73 5.85 NS
p(/90◦ ) – – – – (6.28) (6.15) (6.06) (6.19) (6.6)
ST 3.35 3.02 2.99 4.04 4.7 NS p(/90◦ ) – – – –
(2.59) (2.1) (1.89) (3.05) (4.82)
VM 33.15 30.62 31.49 30.10 30.34 NS
p(/90◦ ) – – – –
(10.64) (9.78) (11.01) (11.17) (10.92)
ES T6 29.82 30.68 34.35 28.74 25.98 NS
p(/90◦ ) – – – –
(43.78) (51.41) (60) (34.18) (30.47)
RF 16.51 15.04 15.98 15.45 15.97 *
p(/90◦ ) – – – –
(8.06) (7.47) (8.24) (7.51) (8.28)
ES L3 47.57 54.32 56.42 64.11 69.26 NS
(57.32) (56.65) (62.69) 62.27) (79.11) p(/90◦ ) ** NS * NS
p(/90◦ ) – – – – TA 28.19 26.57 26.18 25.57 26.84 NS
(21.63) (20.19) (17.88) (18.92) (22.01)
Symbols for the p-values are as follows: **p < 0.01; ***p < 0.001; NS: p ≥ 0.05.
p(/90◦ ) – – – –
A dash (“–”) indicates that no statistically significant global effect was found, and
therefore no further analysis was made. Sol 34.72 32.4 31.35 30.22 32.85 *
(16.25) (14.93) (15.48) (13.88) (18.26)
p(/90◦ ) NS * ** NS
1xP decrease with backrest inclination at maximal speed can GM 26.41 27.96 25.51 27.63 28.11 NS
be observed in Table 6 and from the raw data in Figure 7. (22.46) (26.65) (23.60) (23.94) (24.48)
p(/90◦ ) – – – –
ST 24.67 20.18 23.79 22.61 21.27 NS
CoG Maximal Forward Velocity
(18.13) (12.32) (18.44) (18.00) (14.87)
Maximal CoG forward velocity (x0 Gmax ), reached around seat-
p(/90◦ ) – – – –
off, significantly increased with backrest inclination (p < 0.001)
ES T6 15.5 15.61 16.09 15.38 15.87 NS
(Table 5) and with execution speed (p < 0.001). The contrast
(9.28) (9.01) (9.40) (7.95) (8.70)
analysis showed that all backrest inclination levels higher than
p(/90◦ ) – – – –
90◦ caused significantly higher x0 Gmax compared to the 90◦ level.
ES L3 32.10 30.51 30.61 28.58 29.53 NS
(11.45) (10.26) (12.18) (8.18) (8.81)
CoG Maximal Vertical Velocity p(/90◦ ) – – – –
CoG maximal vertical velocity (z’Gmax ), which was reached
Symbols for the p-values are as follows: *p < 0.05; **p < 0.01; NS: p ≥ 0.05.
during the focal phase, was affected by speed conditions A dash (“–”) indicates that no statistically significant global effect was found, and
(p < 0.001), with larger values at MS (853 ± 159 mm/s at MS therefore no further analysis was made.
Frontiers in Human Neuroscience | www.frontiersin.org 7 September 2021 | Volume 15 | Article 678302Tebbache and Hamaoui Backrest Inclination and Sit-to-Stand
FIGURE 5 | Mean (SD) muscle activity levels in the postural phase (APP), in % MVC, for the 5 inclination conditions calculated for both execution speeds. Symbols
for the p-values are as follows: ∗∗ p < 0.01; ∗∗∗ p < 0.001.
With a reclined backrest, the duration of the postural phase TABLE 4 | Mean (SD) muscle activity levels in the postural phase (APP ) and in the
focal phase (AFP ) in % MVC for the 2 speed conditions: comfortable speed (CS)
increased. This phenomenon can be related to the increased
and maximal speed (MS), calculated for the 5 backrest inclination levels.
range of motion of the trunk when it is initially more extended,
under the hypothesis of a limited variation of movement APP AFP
velocity. Consistently, onset times were also delayed with backrest
inclination for VM and ST, which are part of the prime movers CS MS p(V) CS MS p(V)
of body extension (Roebroeck et al., 1994; Vander Linden et al., NE 27.20 47.62 *** 24.91 25.66 –
1994; Rodrigues-de-Paula-Goulart and Valls-Solé, 1999). (14.00) (16.99) (15.75) (19.99)
In accordance with a recent study (Tebbache and Hamaoui, TraS 19.62 35.08 *** 10.01 9.05 –
2020), differences in mean muscular activity levels were mainly (10.39) (21.07) (6.72) (6.54)
observed during the postural phase, with higher values for two SCOM 10.24 28.06 *** 3.11 3.8 –
trunk (RA) and neck (SCOM) muscles when the trunk was more (6.49) (14.10) (1.66) (2.32)
inclined backward. RA 27.11 59.43 ** 5.29 6.16 *
These variations might be explained by a larger initial torque (18.85) (38.58) (6.19) (6.1)
of the force of gravity about the ischial tuberosities, as the lever VM 3.31 4.86 * 28.49 33.79 ***
arm of upper body weight is larger when the trunk is further (3.94) (2.79) (9.73) (10.88)
extended, and therefore a higher level of muscular activity is RF 4.28 7.31 *** 14.16 17.42 ***
required to perform trunk flexion. Moreover, the onset time of ES (2.9) (4.42) (7.33) (8.01)
L3 was shorter when the backrest was more inclined, suggesting TA 18.65 21.23 – 25.71 27.63 –
earlier involvement of the lower back muscles in order to generate (15.08) (16.35) (20.98) (18.89)
forces at the lumbar level to counteract gravity. Sol 11.67 24.67 ** 28.99 35.63 *
This increased muscular demand during the postural phase (6.7) (15.79) (12.96) (17.46)
led to a larger x0 Gmax , which took place shortly after the seat-off. GM 8.25 23.14 *** 20.39 33.87 **
Smaller APAs amplitude and TA activity level could be related (7.91) (19.59) (17.45) (27.52)
to this higher momentum gained during the extended course ST 2.66 4.59 ** 17.35 27.65 **
of trunk flexion. (1.76) (3.8) (10.12) (19.59)
More specifically, these results suggest that with increased ES T6 17.5 42.32 – 16.27 15.11 –
trunk range of motion and velocity, the role played by TA is taken (16.24) (58.75) (9.5) (7.97)
over by trunk muscles (specifically flexors, SCOM and RA) and ES L3 33.36 83.31 *** 28.98 31.55 –
becomes less essential for STS success. (34.07) (75.74) (7.75) (12.1)
Indeed, as observed in our previous study (Tebbache and
Symbols for the p-values are as follows: *p < 0.05; **p < 0.01; ***p < 0.001; NS:
Hamaoui, 2020), TA activity level was reduced with backrest p ≥ 0.05. A dash (“–”) indicates that no statistically significant global effect was
inclination in the postural phase, with no variation during the found, and therefore no further analysis was made.
focal phase. Its activation was also delayed when the backrest
was inclined, suggesting a lower participation in the STS task,
as observed by various authors when the initial geometrical Rodrigues-de-Paula-Goulart and Valls-Solé, 1999). Indeed, TA is
configuration deviated from the standard one (Doorenbosch involved in the backward shift of the center of pressure at STS
et al., 1994; Vander Linden et al., 1994; Khemlani et al., 1999; initiation, occurring together with the inhibition of the soleus
Frontiers in Human Neuroscience | www.frontiersin.org 8 September 2021 | Volume 15 | Article 678302Tebbache and Hamaoui Backrest Inclination and Sit-to-Stand
TABLE 5 | Mean (SD) total durations of the STS (dSTS), duration of the postural TABLE 6 | 1xP values for the 5 inclination conditions and for in the 2 speed
phase (dPP), maximal CoG anteroposterior velocity (x0 Gmax ), for the 5 inclination conditions: comfortable speed (CS) and maximal speed (MS).
conditions and for the 2 speed conditions: comfortable speed (CS) and
maximal speed (MS). 1xP (mm)
dSTS dPP (ms) dFP x0 Gmax z’Gmax CS MS
(ms) (ms) (mm/s) (mm/s)
90◦ 55 210
CS MS (25) (72)
100◦ 60 212
90◦ 2,267 738 374 1,711 578 706 (22) (71)
(436) (154) (71) (276) (118) (217)
110◦ 62 194
100◦ 2,393 775 407 1,802 601 693 (23) (65)
(379) (149) (97) (316) (111) (194)
120◦ 67 178
110◦ 2,342 851 463 1,685 612 706 (26) (58)
(477) (175) (98) (292) (112) (186)
130◦ 65 157
120◦ 2,487 939 525 1,755 626 721 (24) (50)
(430) (150) (110) (304) (108) (196)
p(i) NS ***
130◦ 2,553 1,080 610 1,707 630 709
p(100◦ /90◦ ) – NS
(476) (163) (124) (313) (14) (190)
p(110◦ /100◦ ) – NS
p(i) ** *** *** NS *** NS
p(120◦ /110◦ ) – ***
p(100◦ /90◦ ) NS NS * – * –
p(130◦ /120◦ ) – ***
p(110◦ /100◦ ) NS *** *** – *** –
p(V) ***
p(120◦ /110◦ ) ** *** *** – *** –
p(i*V) ***
p(130◦ /120◦ ) *** *** *** – *** –
p(V) *** *** ** *** *** Symbols for the p-values are as follows: ***p < 0.001; NS: p ≥ 0.05. A dash (“–”)
indicates that no statistically significant global effect was found, and therefore no
p(i*V) NS ** NS NS NS
further analysis was made.
For dPP, speed conditions were considered separately as the interaction effect i x
V was significant. Symbols for the p-values are as follows: *p < 0.05; **p < 0.01;
***p < 0.001; NS: p ≥ 0.05. A dash (“–”) indicates that no statistically significant
global effect was found, and therefore no further analysis was made.
muscle (Sol) (Crenna and Frigo, 1991). This functional unit thus
results in a larger lever arm of the ground reaction force about the
ankle joint, creating an angular external moment which facilitates
the propulsion of the body by breaking the rotation equilibrium
in whole-body movements such as the STS task, gait initiation
or pushing ramp efforts (Breniere and Do, 1986; Crenna and
Frigo, 1991). The analysis of CoP trajectory showed that the
initial backward shift (1xP ), which is considered as an indicator
of APAs amplitude (Bouisset and Do, 2008; Diakhaté et al.,
2013; Hamaoui and Alamini-Rodrigues, 2017), had smaller values
when the backrest was more inclined, but only in MS condition. FIGURE 6 | Maximal CoP backward displacement as a function of speed and
This tends to further confirm the reduced necessity to backrest inclination. Mean and standard deviations are presented for the 2
generate those APAs, because they would have been less efficient speed conditions and the 5 backrest inclination levels. ∗∗∗ p < 0.001.
given the initial segmental configuration and would even be
counterproductive for fast hip flexion.
The compensation by the increased horizontal momentum CoG (thus using the second mechanism) reduced the need
should be enhanced at maximal speed, as the momentum for larger displacement of the CoP within the base of support
gained is larger. (first mechanism).
Furthermore, these results can be analyzed in light of the The adjustments taking place during the postural phase and
three mechanisms by which balance of a standing human can leading to a larger horizontal velocity allow for the maintenance
be maintained (Hof, 2007): displacing the CoP with respect to of a globally unaltered focal phase, as suggested by its unchanged
the vertical projection of the CoG (first mechanism), rotating duration and CoG maximal vertical velocity.
a body segment with respect to the CoG (second mechanism) Indeed, in contrast with x0 Gmax , z’Gmax , which was reached
and applying an external force other than the ground reaction later during the focal phase, was unaffected by backrest
force (third mechanism) (Hof, 2007). Those three mechanisms inclination, probably because the main effect of trunk flexion
contribute to modifying CoG acceleration. In the present study, occurred along the anterior-posterior axis. Although the
it was observed that counter-rotating the trunk around the momentum transfer strategy suggests a transfer of the horizontal
Frontiers in Human Neuroscience | www.frontiersin.org 9 September 2021 | Volume 15 | Article 678302Tebbache and Hamaoui Backrest Inclination and Sit-to-Stand
FIGURE 7 | Displacement of xp during the postural phase (until SO, seat-off time) as a function of time for one subject for the 5 backrest inclinations.
momentum to the vertical momentum (Schenkman et al., 1990), A more extended initial position of the trunk was associated
it seemed not to be entirely so in this study. with increased muscular activity which led to increased kinetic
These results rather suggest a separate programming of the energy gained through a wider range of trunk flexion, lowering
two phases although they are biomechanically interdependent. the need of APAs.
It must be noted that the increase of postural phase duration A similar analysis could be made in respect of execution speed,
in conditions of more inclined backrest does not necessarily showing an increased activity of all recorded muscles during
represents a reorganization of the postural adjustments, as the the postural phase, and an increase in APAs magnitude and
course of trunk flexion is larger, and then automatically longer CoG velocity peaks.
for a same execution speed. These adaptations to biomechanical factors, rather than an
in-depth reprogramming of the task, are in line with existing
literature, which showed that an increase in ischiofemoral contact
Effects of Execution Speed area with the seat (Diakhaté et al., 2013), a reduction in cervical
The speed factor was initially selected to highlight the effects (Hamaoui and Alamini-Rodrigues, 2017) or lumbar mobility
of backrest inclination, but speed effects were also studied (Alamini-Rodrigues and Hamaoui, 2017) led to modifications in
thoroughly. Results showed that all muscles, except TA and APAs amplitude or duration and to lower motor performance.
SCOM, which were the first to be activated, presented a reduced An insight of this result was observed in our previous study
onset time at maximal speed. Higher levels were observed for 10 (Tebbache and Hamaoui, 2020), with muscular variations
muscles out of 12 during the postural phase, and for 6 out of 12 concordant with the initial geometrical configuration and mainly
during the focal phase, suggesting a predominant effect in the confined to the muscles active in the postural phase.
former, as observed in previous work (Tebbache and Hamaoui, However, it must be noted that the increase of postural
2020). These variations in the muscular pattern resulted in a phase duration in conditions of more inclined backrest does
shorter duration of both postural and focal phases, with an not necessarily represents a reorganization of the postural
increase of 1xP , x0 Gmax and z’Gmax values. This way, earlier and adjustments, as the course of trunk flexion is larger, which
higher muscular activity allowed for larger anticipatory postural naturally extends the duration of the postural phase for a same
adjustments and a better performance along the anterior- execution velocity.
posterior and vertical axes. In contrast with the existing literature, From a more conceptual point of view, our findings also
which has depicted a more pronounced variation of vertical linear support the key principles that postural adjustments are task-
momenta compared to horizontal momenta (Pai and Rogers, specific, adaptable and under the control of the central nervous
1988, 1990; Pai et al., 1994; Gross et al., 1998), our data showed the system (Bouisset and Do, 2008). Such ability requires an internal
same levels of variation between CoP velocity peaks. Hence, the representation of the biomechanical parameters of the human
theory according to which horizontal momentum is limited due body and their integration in motor programming.
to balance constraints requiring the subject to stand straight at the
end of the movement (Pai and Rogers, 1990) cannot be extended
to conditions where the trunk was initially inclined backward. Practical Implications
Reclining the backrest, which increases static comfort due to a
better distribution of the pressure across the soft tissue in contact
Adaptability of STS Parameters with the seat (Hertzberg, 1972; Andersson et al., 1975; Barbenel,
Taken together, results from EMG and force plate data showed an 1992) and to a decreased component of the gravity force on the
adaptation of the STS strategy driven by the new biomechanical spine (Andersson et al., 1979), has implications regarding the
demand related to backrest inclination and execution speed. completion of the STS. It concerns the postural phase, with a need
Frontiers in Human Neuroscience | www.frontiersin.org 10 September 2021 | Volume 15 | Article 678302Tebbache and Hamaoui Backrest Inclination and Sit-to-Stand
for higher activity of neck and trunk flexors (SCOM and RA) that CONCLUSION
could be a limiting factor for older people or patients presenting
a weakness in these muscles. As a consequence, one can question This study revealed that the variations in STS programming
the interest of bringing the backrest at 90◦ before performing the associated with inclined backrest mainly consist in a simple and
task, especially for people suffering a limited function of trunk direct adaptation to the new biomechanical demand, with no in-
and neck muscles. However, setting backrest inclination must depth reprogramming. It mainly raised the activity level of trunk
then be easy to perform and much secure (slow velocity, no and neck flexors due to the augmented torque of gravity about
accidental triggering. . .), which is a challenging objective. the ischial tuberosities center, but it also lowered the recruitment
When considering the increase of kinetic energy for higher of some lower limbs muscles (TA, RF) thanks to the increased
ranges of trunk flexion, which are associated with a lower need kinetic energy gained during the longer trunk flexion. Hence
of TA and RF activity, it might in theory be beneficial to patients reclining the backrest should make the task more demanding at
suffering lower limbs disorders, but only if trunk and neck trunk level but less demanding for the lower limbs.
muscles function is preserved.
LIMITATIONS DATA AVAILABILITY STATEMENT
The main limitation of the study design was the absence The original contributions presented in the study are included
of kinematical data, which did not allow for a segmental in the article/Supplementary Material, further inquiries can be
analysis of osteo-articular mobility and its association with the directed to the corresponding author/s.
muscular pattern. The sample size was also relatively small, but
the population was homogeneous in terms of age and BMI.
Regarding data analysis, the method was oversimplified and
ETHICS STATEMENT
approximations were made in calculating the position of the
CoP and the CoG, but the consequences can be considered as The studies involving human participants were reviewed
negligible because the system was at postural equilibrium prior and approved by the Ethics Committee for Movement
to movement initiation. Analysis (CERAM), INU Champollion. The patients/participants
Another limitation might be the order of the tasks which provided their written informed consent to participate in this study.
was partly randomized (execution speed but not the backrest
inclination angle) due to the technical constraints of the
customed seat. However, the 120 s rest time between series and
the repeated stimulation of the subject all along the experiment AUTHOR CONTRIBUTIONS
should have minimized this side effect.
It must also be noted that the postural phase is longer and AH wrote the initial research project. NT and AH contributed to
probably more conscious in the STS than in many other tasks conception and design of the study. NT organized the database.
exploring the postural adjustments (rising on tip toes, pointing, Both authors contributed to manuscript revision, read, and
gait initiation. . .). As a consequence, one can question the approved the submitted version.
possibility that the variations of the postural phase observed
in maximum velocity condition might rather represent the
compliance to the experiment instructions than a postural FUNDING
adjustment supporting the focal phase. However, the participants
were asked to reach the standing posture as fast as possible, and This work has been funded by the Region Occitanie (France)
not to perform the two phases quicker. With the focus on the goal, and the European Regional Development Fund (FEDER). The
they were given the freedom to adapt postural phase parameters funders had no role in study design, data collection and analysis,
to the focal phase. decision to publish, or preparation of the manuscript.
REFERENCES study. Orthop. Clin. North Am. 6, 105–120. doi: 10.1016/s0030-5898(20)31
205-0
Alamini-Rodrigues, C., and Hamaoui, A. (2017). Effect of three different lumbar Andersson, G. B., Murphy, R. W., Ortengren, R., and Nachemson, A. L. (1979). The
splints on posturokinetic capacity when performing the sit-to-stand task. Ann. influence of backrest inclination and lumbar support on lumbar lordosis. Spine
Phys. Rehabil. Med. 60, 406–409. doi: 10.1016/j.rehab.2016.09.003 4, 52–58. doi: 10.1097/00007632-197901000-00009
An, Q., Ishikawa, Y., Nakagawa, J., Oka, H., Yamakawa, H., Yamashita, A., Arborelius, U. P., Wretenberg, P., and Lindberg, F. (1992). The effects of armrests
et al. (2013). “Muscle synergy analysis of human standing-up motion with and high seat heights on lower-limb joint load and muscular activity during
different chair heights and different motion speeds,” in Proceedings of the 2013 sitting and rising. Ergonomics 35, 1377–1391. doi: 10.1080/001401392089
IEEE International Conference on Systems, Man, and Cybernetics, (Manchester: 67399
IEEE), 3579–3584. Barbenel, J. (1992). Pressure management. Prosthet. Orthot. Int. 15, 225–231.
Andersson, B. J., Ortengren, R., Nachemson, A. L., Elfström, G., and Broman, Belenkii, V. E., Gurfinkel, V. S., and Paltsev, E. I. (1967). [Control elements of
H. (1975). The sitting posture: an electromyographic and discometric voluntary movements]. Biofizika 12, 135–141.
Frontiers in Human Neuroscience | www.frontiersin.org 11 September 2021 | Volume 15 | Article 678302Tebbache and Hamaoui Backrest Inclination and Sit-to-Stand Bernstein, N. (1967). The Co-Ordination and Regulation of Movements. Oxford: procedures. J. Electromyogr. Kinesiol. 10, 361–374. doi: 10.1016/s1050-6411(00) Pergamon-Press, 236. 00027-4 Bouchouras, G., Patsika, G., Hatzitaki, V., and Kellis, E. (2015). Kinematics and Hertzberg, H. T. E. (1972). The Human Buttocks in Sitting: Pressures, Patterns, and knee muscle activation during sit-to-stand movement in women with knee Palliatives. SAE Technical Paper No. 72005. New York, NY: SAE Inc. osteoarthritis. Clin. Biomech. 30, 599–607. doi: 10.1016/j.clinbiomech.2015.03. Hirschfeld, H., Thorsteinsdottir, M., and Olsson, E. (1999). Coordinated ground 025 forces exerted by buttocks and feet are adequately programmed for weight Bouisset, S., and Do, M.-C. (2008). Posture, dynamic stability, and voluntary transfer during sit-to-stand. J. Neurophysiol. 82, 3021–3029. doi: 10.1152/jn. movement. Neurophysiol. Clin. 38, 345–362. doi: 10.1016/j.neucli.2008.10.001 1999.82.6.3021 Bouisset, S., and Zattara, M. (1981). A sequence of postural movements precedes Hof, A., Gazendam, M. G. J., and Sinke, W. E. (2005). The condition for dynamic voluntary movement. Neurosci. Lett. 22, 263–270. doi: 10.1016/0304-3940(81) stability. J. Biomech. 38, 1–8. doi: 10.1016/j.jbiomech.2004.03.025 90117-8 Hof, A. L. (2007). The equations of motion for a standing human reveal three Bouisset, S., and Zattara, M. (1987). Biomechanical study of the programming mechanisms for balance. J. Biomech. 40, 451–457. doi: 10.1016/j.jbiomech.2005. of anticipatory postural adjustments associated with voluntary 12.016 movement. J. Biomech. 20, 735–742. doi: 10.1016/0021-9290(87)9 Hughes, M. A., Weiner, D. K., Schenkman, M. L., Long, R. M., and Studenski, 0052-2 S. A. (1994). Chair rise strategies in the elderly. Clin. Biomech. 9, 187–192. Boukadida, A., Piotte, F., Dehail, P., and Nadeau, S. (2015). Determinants of sit- doi: 10.1016/0268-0033(94)90020-5 to-stand tasks in individuals with hemiparesis post stroke: a review. Ann. Phys. Kawagoe, S., Tajima, N., and Chosa, E. (2000). Biomechanical analysis of effects Rehabil. Med. 58, 167–172. doi: 10.1016/j.rehab.2015.04.007 of foot placement with varying chair height on the motion of standing up. Breniere, Y., and Do, M. C. (1986). When and how does steady state gait movement J. Orthop. Sci. 5, 124–133. doi: 10.1007/s007760050139 induced from upright posture begin? J. Biomech. 19, 1035–1040. doi: 10.1016/ Kelley, D. L., Dainis, A., Wood, G. K. (1976). “Mecanics and muscular dynamics of 0021-9290(86)90120-x rising from a seated position,” in Proceedings of the 5th International Congress Brenière, Y., and Do, M. C. (1991). Control of gait initiation. J. Mot. Behav. 23, of Biomechanics, Jyväskylä, Finland. Biomechanics, V-B, Vol. 1B, ed. P. V. Komi 235–240. (Baltimore, MD: University Park Press), 127-134. Burdett, R. G., Habasevich, R., Pisciotta, J., and Simon, S. R. (1985). Biomechanical Khemlani, M. M., Carr, J. H., and Crosbie, W. J. (1999). Muscle synergies and comparison of rising from two types of chairs. Phys. Ther. 65, 1177–1183. joint linkages in sit-to-stand under two initial foot positions. Clin. Biomech. 14, doi: 10.1093/ptj/65.8.1177 236–246. doi: 10.1016/s0268-0033(98)00072-2 Chorin, F., Cornu, C., Beaune, B., Frère, J., and Rahmani, A. (2016). Sit to Lidierth, M. (1986). A computer based method for automated measurement of the stand in elderly fallers vs non-fallers: new insights from force platform and periods of muscular activity from an EMG and its application to locomotor electromyography data. Aging Clin. Exp. Res. 28, 871–879. doi: 10.1007/s40520- EMGs. Electroencephalogr. Clin. Neurophysiol. 64, 378–380. doi: 10.1016/0013- 015-0486-1 4694(86)90163-x Conforto, S., D’Alessio, T., and Pignatelli, S. (1999). Optimal rejection of Millington, P. J., Myklebust, B. M., and Shambes, G. M. (1992). Biomechanical movement artefacts from myoelectric signals by means of a wavelet filtering analysis of the sit-to-stand motion in elderly persons. Arch. Phys. Med. Rehabil. procedure. J. Electromyogr. Kinesiol. 9, 47–57. doi: 10.1016/s1050-6411(98) 73, 609–617. 00023-6 Munton, J. S., Ellis, M. I., and Wright, V. (1984). Use of electromyography to Cordo, P. J., and Nashner, L. M. (1982). Properties of postural adjustments study leg muscle activity in patients with arthritis and in normal subjects associated with rapid arm movements. J. Neurophysiol. 47, 287–302. doi: 10. during rising from a chair. Ann. Rheum. Dis. 43, 63–65. doi: 10.1136/ard. 1152/jn.1982.47.2.287 43.1.63 Crenna, P., and Frigo, C. (1991). A motor programme for the initiation of forward- Ng, S. S. M., Kwong, P. W. H., Chau, M. S. P., Luk, I. C. Y., Wan, S. S., and Fong, oriented movements in humans. J. Physiol. 437, 635–653. doi: 10.1113/jphysiol. S. S. M. (2015). Effect of arm position and foot placement on the five times 1991.sp018616 sit-to-stand test completion times of female adults older than 50 years of age. Cuesta-Vargas, A. I., and Gonzalez Sanchez, M. (2013). Differences in muscle J. Phys. Ther. Sci. 27, 1755–1759. doi: 10.1589/jpts.27.1755 activation patterns during sit to stand task among subjects with and without Nuzik, S., Lamb, R., VanSant, A., and Hirt, S. (1986). Sit-to-stand movement intellectual disability. Biomed Res. Int. 2013:e173148. pattern. A kinematic study. Phys. Ther. 66, 1708–1713. doi: 10.1093/ptj/66.11. Diakhaté, D. G., Do, M. C., and Le Bozec, S. (2013). Effects of seat-thigh contact on 1708 kinematics performance in sit-to-stand and trunk flexion tasks. J. Biomech. 46, Pai, Y.-C. C., Naughton, B., Chang, R., and Rogers, M. (1994). Control of body 879–882. doi: 10.1016/j.jbiomech.2012.12.022 centre of mass momentum during sit-to-stand among young and elderly adults. Doorenbosch, C. A., Harlaar, J., Roebroeck, M. E., and Lankhorst, G. J. (1994). Gait Posture 2, 109–116. doi: 10.1016/0966-6362(94)90100-7 Two strategies of transferring from sit-to-stand; the activation of monoarticular Pai, Y.-C. C., and Rogers, M. W. (1988). Dependence of weight transfer patterns on and biarticular muscles. J. Biomech. 27, 1299–1307. doi: 10.1016/0021-9290(94) the speed of ascent during sit-to-stand. J. Biomech. 21:863. doi: 10.1016/0021- 90039-6 9290(88)90054-1 Gillette, J. C., and Stevermer, C. A. (2012). The effects of symmetric and asymmetric Pai, Y.-C. C., and Rogers, M. W. (1990). Control of body mass transfer as a function foot placements on sit-to-stand joint moments. Gait Posture 35, 78–82. doi: of speed of ascent in sit-to-stand. Med. Sci. Sports Exerc. 22, 378–384. 10.1016/j.gaitpost.2011.08.010 Rodosky, M. W., Andriacchi, T. P., and Andersson, G. B. (1989). The influence of Gross, M. M., Stevenson, P. J., Charette, S. L., Pyka, G., and Marcus, R. (1998). chair height on lower limb mechanics during rising. J. Orthop. Res. 7, 266–271. Effect of muscle strength and movement speed on the biomechanics of rising doi: 10.1002/jor.1100070215 from a chair in healthy elderly and young women. Gait Posture 8, 175–185. Rodrigues-de-Paula-Goulart, F., and Valls-Solé, J. (1999). Patterned doi: 10.1016/s0966-6362(98)00033-2 electromyographic activity in the sit-to-stand movement. Clin. Neurophysiol. Hamaoui, A., and Alamini-Rodrigues, C. (2017). Influence of cervical spine 110, 1634–1640. doi: 10.1016/s1388-2457(99)00109-1 mobility on the focal and postural components of the sit-to-stand task. Front. Roebroeck, M. E., Doorenbosch, C. A., Harlaar, J., Jacobs, R., and Lankhorst, G. J. Hum. Neurosci. 11:129. doi: 10.3389/fnhum.2017.00129 (1994). Biomechanics and muscular activity during sit-to-stand transfer. Clin. Herman, R., Cook, T., Cozzens, B., and Freedman, W. (1973). “Control of postural Biomech. 9, 235–244. doi: 10.1016/0268-0033(94)90004-3 reactions in man: the initiation of gait,” in Control of Posture and Locomotion. Schenkman, M., Berger, R. A., Riley, P. O., Mann, R. W., and Hodge, W. A. (1990). Advances in Behavioral Biology, eds R. B. Stein, K. G. Pearson, R. S. Smith, and Whole-body movements during rising to standing from sitting. Phys. Ther. 70, J. B. Redford (Boston, MA: Springer US), 363–388. doi: 10.1007/978-1-4613- 638–648; discussion648–651. 4547-3_28 Schenkman, M., Riley, P., and Pieper, C. (1996). Sit to stand from progressively Hermens, H. J., Freriks, B., Disselhorst-Klug, C., and Rau, G. (2000). lower seat heights — alterations in angular velocity. Clin. Biomech. 11, 153–158. Development of recommendations for SEMG sensors and sensor placement doi: 10.1016/0268-0033(95)00060-7 Frontiers in Human Neuroscience | www.frontiersin.org 12 September 2021 | Volume 15 | Article 678302
You can also read