Ecosystem Services Contents lists available at ScienceDirect
←
→
Page content transcription
If your browser does not render page correctly, please read the page content below
Ecosystem Services 51 (2021) 101346

                                                                  Contents lists available at ScienceDirect

                                                                      Ecosystem Services
                                                         journal homepage: www.elsevier.com/locate/ecoser

A matrix approach to tropical marine ecosystem service assessments in
South east Asia
Caroline Hattam a, b, c, Stefanie Broszeit a, *, Olivia Langmead b, Radisti A. Praptiwi d, e, 1,
Voon Ching Lim f, 2, Lota A. Creencia g, 3, Duc Hau Tran h, Carya Maharja d,
Tatang Mitra Setia d, e, f, 4, Prawesti Wulandari d, 5, Jito Sugardjito d, 6, Jonson Javier g, 7,
Edgar Jose f, Lea Janine Gajardo i, Amy Yee-Hui Then j, 8, Yang Amri Affendi k, 9, Sofia Johari l,
Eva Vivian Justine m, Muhammad Ali Syed Hussein n, 10, Hong Ching Goh o, 11,
Phuc Hung Nguyen g, Van Quyen Nguyen g, Ngoc Thao Le p, Hoang Tri Nguyen q,
Andrew Edwards-Jones a, Daniel Clewley a, Melanie Austen b, r, s, t
a
  Plymouth Marine Laboratory, Prospect Place, The Hoe, Plymouth, UK
b
  School of Biological and Marine Sciences, University of Plymouth, Plymouth, UK
c
  ICF, Riverscape, 10 Queen Street Place, London EC4R 1BE, UK
d
  Centre for Sustainable Energy and Resources Management, Universitas Nasional, Jakarta, Indonesia
e
  Department of Biotechnology, Universitas Esa Unggul, Jakarta, Indonesia
f
  School of Science, Monash University Malaysia, 47500 Bandar Sunway, Selangor, Malaysia
g
  College of Fisheries and Aquatic Sciences, Western Philippines University, Palawan, Philippines
h
  Department of Zoology, Faculty of Biology, Hanoi National University of Education, Hanoi, Viet Nam
i
  Department of Biology, Graduate School, Universitas Nasional, Jakarta, Indonesia
j
  Faculty of Biology, Universitas Nasional, Jakarta, Indonesia
k
  College of Agriculture, Forestry and Environmental Sciences, Western Philippines University, Palawan, Philippines
l
  College of Fisheries and Aquatic Sciences, Western Philippines University, Palawan, Philippines
m
   Institute of Biological Sciences, Faculty of Science, Universiti Malaya, 50603 Kuala Lumpur, Malaysia
n
  Institute of Ocean and Earth Sciences, Universiti Malaya, 50603 Kuala Lumpur, Malaysia
o
  Department of Urban and Regional Planning, Faculty of Built Environment, Universiti Malaya, 50603 Kuala Lumpur, Malaysia
p
  Department of Urban and Regional Planning, Faculty of Built Environment, Universiti Malaya, 50603 Kuala Lumpur, Malaysia
q
  Borneo Marine Research Institute, Universiti Malaysia Sabah, Jalan UMS, 88400 Kota Kinabalu, Sabah, Malaysia
r
  Department of Urban and Regional Planning, Faculty of Built Environment, Universiti Malaya, 50603 Kuala Lumpur, Malaysia
s
  Secretariat of Cu Lao Cham – Hoi An Biosphere Reserve, Viet Nam
t
  Vietnam National Committee for Man and Biosphere Program, Viet Nam

A R T I C L E I N F O                                    A B S T R A C T

Keywords:                                                Ecosystem service assessments are increasingly used to support natural resource management, but there is a bias
Habitats                                                 in their application towards terrestrial systems and higher income countries. Tropical marine applications are
Modified

     * Corresponding author.
       E-mail address: stbr@pml.ac.uk (S. Broszeit).
     1
       ORCID: 0000-0002-1657-6982.
     2
       ORCID: 0000-0002-2722-4771.
     3
       ORCID: 0000-0002-8586-8604.
     4
       ORCID: 0000-0003-2667-5199.
     5
       ORCID: 0000-0002-7078-7465.
     6
       ORCID: 0000-0002-2913-9204.
     7
       ORCID: 0000-0002-9355-8649.
     8
       ORCID: 0000-0001-6558-8237.
     9
       ORCID: 0000-0002-9392-2463.
    10
       ORCID: 0000-0002-0554-5590.
    11
       ORCID: 0000-0002-9250-2205.

https://doi.org/10.1016/j.ecoser.2021.101346
Received 11 September 2020; Received in revised form 2 June 2021; Accepted 26 July 2021
Available online 13 August 2021
2212-0416/© 2021 The Authors. Published by Elsevier B.V. This is an open access article under the CC BY license (http://creativecommons.org/licenses/by/4.0/).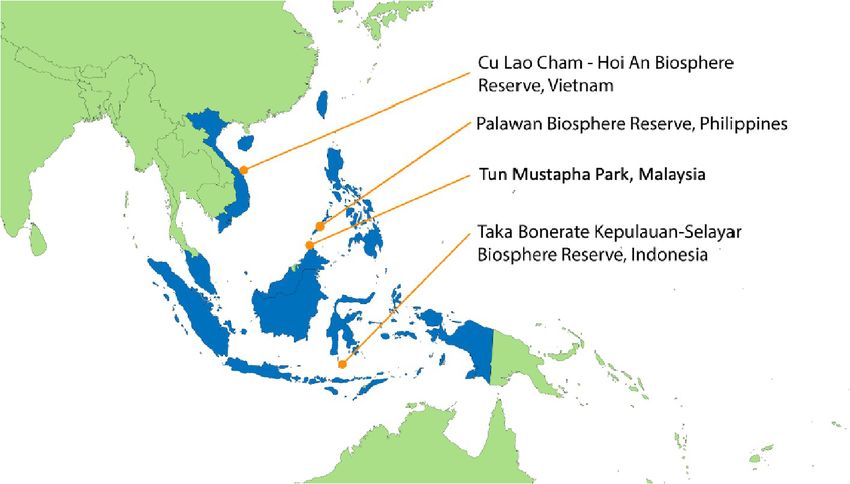
C. Hattam et al. Ecosystem Services 51 (2021) 101346
Ecosystem service potential particularly scarce, especially in SE Asia. Given the growing coastal population and expansion in blue economy
Confidence scores sectors in SE Asia, evidence to support effective marine planning, such as ecosystem service assessments, is
Evidence gaps urgently needed. Data deficiencies for marine systems, especially (but not only) in lower income countries is a
significant obstacle for ecosystem service assessments. To overcome this, we develop an ecosystem service po
tential matrix which combines evidence taken from an extensive literature review together with expert opinion.
The matrix includes both natural and modified habitats as the service providing units. The ecosystem service
potential for habitats are scored at the macro level (e.g. mangrove) due to insufficient evidence to score micro-
habitats (e.g. fringe, basin or riverine mangroves). The majority of evidence is available for biogenic habitats
(mangroves, coral reefs and seagrass meadows) with comparatively little for sedimentary habitats. While pro
visioning, regulating and cultural services are scored, published evidence is more readily available for provi
sioning and regulating services. Confidence scores, indicating the uncertainty in the ecosystem service potential
scores are included in the matrix. To our knowledge this is the first attempt to systematically capture the pro
vision of ecosystem services from tropical marine habitats. Although initially developed for four marine
biosphere reserves and protected areas in SE Asia, the generic nature of the evidence included suggests that the
matrix constitutes a valuable baseline for marine ecosystem service assessments within SE Asia and provides a
robust foundation for development in future work.
1. Introduction 2017), in which the capacity or potential of an ecosystem service
providing unit (typically land use or habitat types) to supply ecosystem
Ecosystem service assessments are increasingly used to support services is assessed and scored. The method can draw on multiple data
environmental management, with applications at local (e.g. Tamayo sources (e.g. literature, model output, observational data), but where
et al., 2018; Bana and Sakti, 2019), national (e.g. Schröter et al., 2016) data are scarce, expert judgement and knowledge can be incorporated
and global scales (e.g. the Millennium Ecosystem Assessment, 2005, and (Campagne and Roche, 2018). The method enables a rapid assessment of
more recently IPBES, 2019, Díaz et al., 2019). Although global assess ecosystem service supply and/or demand for a specific area (Burkhard
ments cover all biomes, national and local assessments typically focus on et al., 2012). It is now one of the most popular ecosystem service
terrestrial environments, with marine equivalents lagging significantly assessment methods available (Jacobs et al., 2015) and results have been
behind (Townsend et al., 2018; Lautenbach et al., 2019). This bias to used for policy making and the development of management measures
wards terrestrial systems has been attributed to the challenges faced by for target areas (e.g. Tao et al., 2018). Marine applications of the matrix
marine assessments including a scarcity of marine spatial data, the approach are relatively few, but include six European focused studies
mobile nature of marine resources, the three dimensional character of (Salomidi et al., 2012; Galparsoro et al., 2014; Potts et al., 2014; Burdon
marine ecosystems and the spatial disconnect between where services et al., 2017; Depellegrin et al., 2017; Farella et al., 2020) and one from
are produced and where they are used in the marine environment New Zealand (Geange et al., 2019); no tropical studies have been
(Townsend et al., 2018; Hooper et al., 2019). The application of identified. Of these seven studies, each uses marine habitats as the
ecosystem service assessments is also biased by geographical location. ecosystem service providing units, but Potts et al. (2014), Burdon et al.
The vast majority of assessments have occurred in Europe, the USA and (2017) and Farella et al. (2020) also assess the potential of marine
China with comparatively few having taken place in lower income species to provide ecosystem services. The number of services assessed
countries (Lautenbach et al., 2019). Marine applications that have varies from 12 to 25 with most studies including supporting ecosystem
occurred in lower income countries have typically been in Africa (e.g. services alongside provisioning, regulating and cultural services. Only
Lange and Jiddawi, 2009; Abunge et al., 2013) and South America (e.g. Geange et al. (2019) base their assessment on an internationally
Castaño-Isaza et al., 2015). accepted ES classification, drawing from both TEEB (TEEB, 2010) and
Evidence to support marine management and planning in tropical CICES (Common International Classification of Ecosystem Services;
locations, such as ecosystem service assessments, is urgently needed. Haines-Young and Potschin (2018)).
Demand for marine space and resources is increasing due to growing Despite the advantages of the matrix approach, the reliance on expert
populations and expanding blue economies (Roberts and Brink, 2010), judgement may produce unacknowledged or hard-to-quantify un
especially in lower income tropical countries (World Bank and United certainties (Hou et al., 2013). In a review of 109 matrix studies, Cam
Nations Department of Economic and Social Affairs, 2017; Bennett et al., pagne et al. (2020) found that only 15% considered the variability and
2019). This is coupled with recognition of the deteriorating state of uncertainty in their scores. The reproducibility and transparency in the
many components of the marine environment (Worm et al., 2006; scoring process is also criticised (Jacobs et al., 2015), which may lead to
Canonico et al., 2019) and concerns over increased conflict for marine inconsistent findings when the matrix approach is repeatedly applied to
space and resources (Pomeroy et al., 2014). In Asia, one of the centres the same area (Tao et al., 2018). To standardise the matrix creation
for coastal population and blue economy growth, the development and process, Jacobs et al. (2015) produced guidelines for improving the
implementation of integrated coastal management incorporating marine scientific quality of the matrix model, which have been further devel
spatial planning has been identified as a priority investment needed to oped by Campagne and Roche (2018). Campagne and Roche (2018)
support the blue economy (Whisnant and Reyes, 2015). Examples of recommend a seven-step process: goal preparation, harmonising un
marine planning in the region are few, but lessons learnt from small- derstanding of the ecosystem service and ecosystem type classifications,
scale marine planning initiatives (e.g. Bataan, Philippines and Waka initial scoring of the matrix, filling in the matrix, compiling values,
tobi National Park, Indonesia) suggest that the capacity to implement checking the reliability and validation of the matrix, and the creation of
marine planning throughout SE Asia is largely lacking partly due to outputs.
limitations in the data and information needed to develop it (Pomeroy A further challenge to the matrix approach is the inconsistent
et al., 2014). incorporation of cultural ecosystem services. This risks cultural
The data deficiency in many marine and coastal areas, especially (but ecosystem services being overlooked by decision makers, and is recog
not only) in lower income countries, has been described as the greatest nised as a particular problem in lower income countries (Martin et al.,
obstacle to the advancement of ecosystem service assessments (Eigen 2016). Some authors exclude cultural services entirely (e.g. Geange
brod et al., 2010). One method that may overcome this challenge is the et al., 2019), while others use a single cultural service (e.g. Depellegrin
capacity matrix approach (Burkhard et al., 2009; Campagne et al., et al., 2017) or a mixture of benefits, components of well-being and
2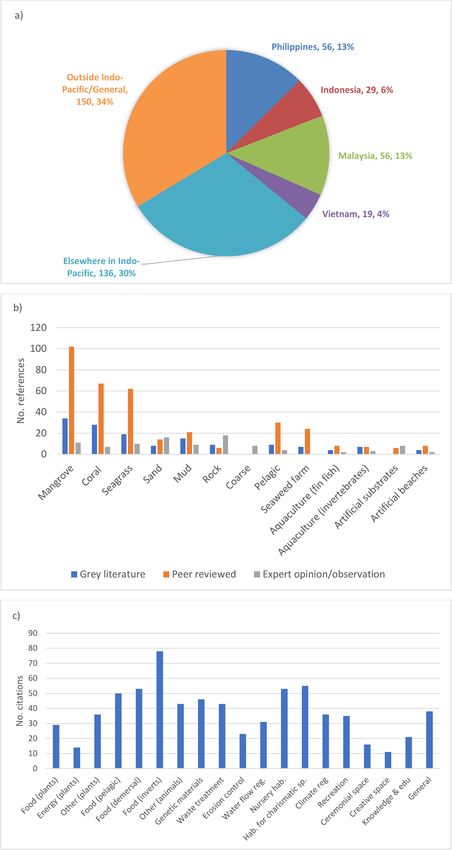
C. Hattam et al. Ecosystem Services 51 (2021) 101346
values (e.g. Burdon et al., 2017). Such inconsistency may be attributed an appropriate ecosystem service classification. This was followed by an
to the lack of clarity in the literature about what constitutes a cultural extensive literature review to document the available evidence on the
ecosystem service or what the explicit contribution of the natural potential of each SPU to provide each ecosystem services (step 3). Step 4
environment is to their provision (Satz et al., 2013). Chan et al. (2012), involved scoring the matrix (ecosystem service potential, and confi
Chan et al. (2018) indicate the need to recognise that cultural ecosystem dence in the evidence used to generate the potential score) and har
services are co-produced and co-created through interactions between monising the scores using a consensus approach. Step 5 focused on
people and ecosystems. To operationalise this concept, Fish et al. (2016) validating outputs by cross-checking the scores with the evidence and
recommend distinguishing between environmental places, cultural peer review of the evidence base. Step 6 (mapping the outputs and
practices, benefits and goods. Given the place-based nature of the matrix application in management decisions) is not reported in depth, but an
approach, this suggests that a more standardised approach to capture example is given.
the cultural ecosystem services can be developed through the inclusion
of different types of environmental places of cultural importance.
2.1. Defining the ecosystem service providing units
This paper reports the process used to develop a tropical marine
ecosystem service potential matrix that captures all ecosystem services
Following Geange et al. (2019), habitats were selected as the most
(i.e. provisioning, regulating and cultural services) in a standardised
suitable SPUs for each case study site. In all but the Indonesian case,
manner, provides a transparent evidence trail for each score, and as
some level of habitat mapping had occurred and macro biogenic habitats
sesses the confidence in the evidence used. The development of the
(mangrove forests, coral reefs, seagrass meadows) had been identified.
matrix results from the need to support marine planning within four
Each of the macro biogenic habitat types were further classified into
marine biosphere reserves and protected areas in SE Asia, which form
micro-habitats (e.g. mangrove fringe, basin and riverine) to enable the
the case study sites for the GCRF Blue Communities Programme (htt
capture of how these sub-units may potentially provide different levels
ps://www.blue-communities.org; Fig. 1): Taka Bonerate Kepulauan
of ecosystem services (Appendix A).
Selayar Biosphere Reserve, Indonesia; Palawan, the Philippines; Cu Lao
Knowledge of the existence of sedimentary habitats was scarce. As no
Cham-Hoi An, Vietnam; and the Tun Mustapha Park, Malaysia. While
standardised habitat classification for marine tropical habitats exists,
each biosphere reserve and marine park has its own management needs,
sedimentary habitats were subdivided into sand, mud, rock, and coarse
what they have in common is similar habitats and a shared lack of data
following a EUNIS-type approach (European Nature Information Sys
on which to base management decisions. While the resulting matrix
tem; EUNIS, 2019). Sand, mud, rock and coarse habitats were split into
cannot be expected to capture all the spatial variability in ecosystem
intertidal and subtidal sub-categories to capture how depth may influ
service provision across all sites, it can provide a starting point for more
ence the capacity to provide ecosystem services (e.g. recreational ca
tailored ecosystem service assessments in future. To our knowledge, this
pacity of intertidal sandy beaches is generally much higher than subtidal
is the first attempt to systematically capture the provision of ecosystem
sand). A generic pelagic class was also included to capture ecosystem
services from tropical marine habitats. As such, it constitutes a valuable
services provided by the water column, a habitat frequently missing in
baseline for marine ecosystem service assessments within SE Asia and
marine ecosystem service assessments (Hooper et al., 2019).
provides a robust foundation for development in future work.
Given the extent of human activities within the case study sites, a
series of modified habitats were defined to account for differences in
2. Method
their ecosystem service provisioning compared to natural habitats.
Modified habitats included those that had artificial substrata intro
Focusing initially on the four tropical marine biospheres and pro
duced, and for the case study areas these comprised:
tected areas, a modified version of the Campagne and Roche (2018)’s
Seaweed farms where seaweed germlings are attached to cultivation
seven-step process was used for the creation of the tropical marine
lines connected to buoys or poles and then grown out until they are of
ecosystem service potential matrix (Fig. 2). Given the absence of a
harvestable size. These structures may cover extensive shallow coastal
standardised classification system for tropical marine ecosystem service
areas, particularly in the Asia-Pacific region (Chung et al., 2017). Found
providing units (SPUs), the initial preparation stage was divided into
in Palawan, Tun Mustapha Park and Taka Bonerate Kepulauan Selayor.
two: 1) identifying the ecosystem SPUs and 2) selecting and modifying
Fish cages used for the mariculture of finfish that take place in both
Fig. 1. Location of the four GCRF Blue Communities case study sites (source: Blank world map (green color) by OSeveno, used under CC BY-SA 4.0 / cropped, changed
colours and added case study sites). (For interpretation of the references to colour in this figure legend, the reader is referred to the web version of this article.)
3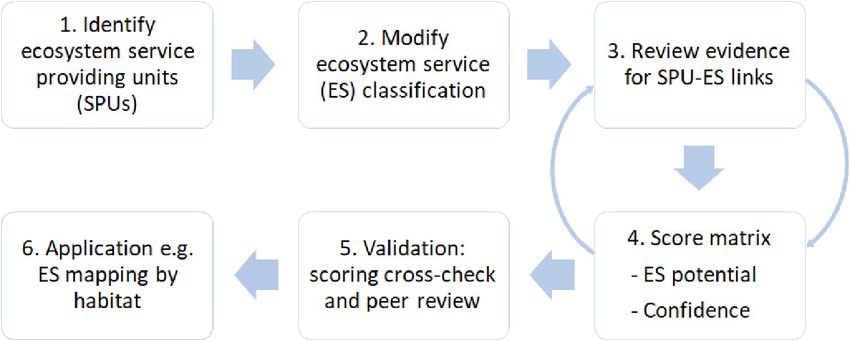
C. Hattam et al. Ecosystem Services 51 (2021) 101346
Fig. 2. Flow-chart of approach to matrix preparation, modified from Campagne and Roche (2018).
brackish and marine environments. Small fish are grown on to a material for mariculture and restocking respectively.
harvestable size, fed on either pellets or wild caught fish. In Vietnam and Due to the inclusion of modified habitats in the habitat classification,
Philippines finfish cages are often located over coral reefs as they require provisioning services attributed specifically to mariculture activities
both good water quality and sheltered conditions (Hedberg et al., 2015; were removed from the service classification to avoid double counting.
Hedberg et al., 2017). Found in all case study sites. The provision of food, energy and other materials from plants and ani
Invertebrate aquaculture farms including pearl oyster farms. These mals from mariculture sites is therefore captured in generic provisioning
are often cultured in nets or baskets suspended on long lines to reduce service categories. Inclusion of the modified habitats in this way also
predation. Oysters are highly sensitive to their growing environment. enabled the capture of other potential ecosystem service delivery by
Good water quality is necessary for optimum growth and health of the these habitats that would otherwise have been lost (e.g. their contri
oysters, which in turn lead to higher quality pearls and lower mortality butions to regulating and cultural services).
from disease. Pearl farms, like finfish cages, are often located over coral
reefs for this reason. Found in Palawan.
Artificial structures such as breakwaters, pontoons, seawalls or 2.3. Evidence review
jetties that have been constructed for access or to prevent flooding.
Found in all case study sites. Given the general lack of empirical data relevant on the provision of
Artificial beaches used either for coastal protection or to enhance ecosystem services by habitats in the case study sites, especially for
existing beaches for tourism purposes. Not present in the case study regulating services, evidence was gathered through a review of existing
sites, but of interest to them. literature, both peer reviewed and non-peer reviewed (e.g. government
Shrimp ponds, although common across SE Asia, were not included and NGO reports). Although systematic reviews are now the gold stan
in this assessment as they are not present in the marine ecosystems dard in evidence synthesis, due to the number of review permutations
within the case study sites (e.g. they occurred in riverine mangrove sites possible for this assessment, a more targeted approach was used. While
outside the boundary of Tun Mustapha Park). Intertidal clam culture and this may potentially introduce bias into the findings, the purpose of this
mangrove plantations were also not included as modified habitats. review was not to identify all the available evidence, but to demonstrate
While there are areas seeded/planted within case study sites, there are that evidence for a link between a habitat and an ecosystem service
no new habitat types from introduced structures and for the purposes of exists. A structured approach was taken to ensure a comprehensive re
this exercise, they were considered similar to their unmanaged ‘natural’ view and traceability. Searches were undertaken in English and local
habitats. They are included within intertidal mud and mangrove forests languages by teams from Indonesia, Malaysia, Philippines, the UK and
respectively. Vietnam.
2.3.1. Bibliographic Database Searches
2.2. Classifying ecosystem services Searches were performed in Web of Science and Google Scholar
using the search terms: “habitat” AND “ecosystem service”, where
Relevant marine ecosystem services were selected and defined “habitat” stands for each of the habitats including both macro and
following a combination of both CICES 5.1 and TEEB ecosystem service micro-habitats. “Ecosystem service” stands for each of ecosystem ser
classifications with division, groups and class combined for simplicity. vices included. For each service, variations of terms were used to ensure
Cultural ecosystem services were adapted based on Fish et al. (2016) in comprehensive retrieval of information. For example, variations for
recognition of their place-based and relational nature (Appendix B). “Treatment and assimilation of wastes or toxic substances” included
Ecosystem services were excluded if they had no relevance to SE Asian “bioremediation” and “remediation of waste”. For habitats that also
marine habitats or the supporting evidence was lacking (e.g. pest and occur in freshwater the search terms were extended to include “AND
disease control). Gaps in the existing frameworks necessitated the cre marine”. If the habitat also occurs in temperate or polar regions, the
ation of new categories. For example, “provision of habitat for charis term “AND tropical” was added. Refine search filters were used to
matic species” was included given the dependence of some charismatic reduce the number of hits if searches returned studies from other dis
species on critical habitat (e.g. green turtles and dugongs graze in sea ciplines such as geology or engineering. See Appendix C for a list of
grass meadows). As this service can be specifically managed for, its in search terms.
clusion was considered justified, however, as with other regulating To augment this approach, a snowballing technique was used in
services, in some circumstances it may be considered a supporting ser which references of articles relevant to the study were scanned for
vice. Where ambiguity was found in definitions prior to evidence further useful publications. Reverse snowballing was also undertaken,
collection, these were modified for clarity. For example, ‘genetic mate where appropriate, by accessing the “times cited” lists of relevant arti
rial from plants and animals’, which has been used in a variety of ways cles in the search engines. Review articles were often used as they
elsewhere, was refined to include the collection of broodstock or contained helpful summaries of existing bodies of literature.
4
C. Hattam et al. Ecosystem Services 51 (2021) 101346
2.3.2. Search for grey literature and regional reports Table 1
To gather grey literature, the same search technique was used in Scoring system for ecosystem service potential and confidence scores.
Google, Dogpile (https://www.dogpile.com); the British Library (htt Score Definition Explanation
p://explore.bl.uk/primo_library/libweb/action/search.do?vid =
Ecosystem 3 High relevant potential
BLVU1); British Library ethos, a collection of academic theses created in service 2 Medium relevant
the United Kingdom and held in the British library (https://ethos.bl.uk potential potential
/Home.do;jsessionid = 6838C3BA0AB07238A6CAD49F1D6CA6F2); score 1 Low relevant potential
the World Bank elibrary (https://elibrary.worldbank.org/); and Open 0 No relevant potential
Blank No evidence
grey (http://www.opengrey.eu/). Targeted searches were also under Confidence 3 Strong, consistent Most likely to be
taken of the websites of NGOs and multinational organisations (e.g. FAO scores evidence and/or intuitive supported by extensive
and WWF). scientific support. published material (both
peer reviewed and grey
literature). High level of
2.3.3. Article screening
agreement among sources
Search results were scanned first by title and if deemed relevant to and/or united scientific
the study question, the full text was downloaded. Where more than 500 support. If it is intuitive
publications were returned by a search query, only the titles of first 500 and unchallenged by
publications were scanned for relevance. The abstract of each relevant other scientists, united
expert opinion can also
publication was then assessed for inclusion in the study. Literature from carry high confidence.
the case study countries was prioritised, followed by those from the This may also be
Indo-Pacific. Literature from outside the Indo-Pacific was excluded un supported by local
less no Indo-Pacific literature was found and it reported generic prin observations and
information from other
ciples relevant to habitats, irrespective of location. Ecosystem service
regions.
valuation studies were also removed unless they provided evidence for 2 General scientific support, There may be some
the ecosystem services that were valued. More general reviews or re but some uncertainty. published material,
ports that stated that a particular habitat provides a service without although some may be
showing evidence for such a statement were searched for valid refer from grey literature.
Some disagreement
ences to obtain evidence. Searches were carried out between October
among sources. Evidence
2018 to May 2019. available is more limited.
Where evidence was lacking, the authors of this study, particularly There may also be some
those working in the SE Asian case study sites, added their local observations from the
study team.
knowledge and field observations to the evidence base. In some cases,
1 Evidence is limited and Published material may
regional experts or authors of studies were contacted to confirm infor there is considerable not exist or may be
mation or find further information that they may have obtained but not uncertainty, limited/inconsistent.
used in their publications. inconsistency, or Expert opinion maybe the
variability in the only evidence available.
evidence. There may be
2.4. Scoring the matrix disagreement among
sources or expert opinion
The potential for each habitat to provide each ecosystem service was is particular to an
scored using a four-point scale where zero indicates no relative potential individual expert rather
than widely held.
and three indicates high relative potential, following a similar approach
Blank There is no evidence for a
by Geange et al. (2019). The potential of a habitat to provide an link
ecosystem service may not be the same as the habitats’ actual capacity to
provide the service due to the presence of human activities. Potential
scores therefore represent what the habitat could be capable of, should evidence had been collated, scoring was first undertaken by the indi
human pressures be alleviated. Scores do not consider who the benefi vidual research teams from Indonesia, Malaysia, Philippines, the UK and
ciaries of these services are or where those beneficiaries are located. Vietnam. Teams comprised 3–5 academics with marine ecological and
They were primarily based on the evidence collated from literature social science backgrounds and drew from across the GCRF Blue Com
search, but also drew on the expert knowledge of the research team. munities project team (78 researchers in total). To ensure that all teams
Where no evidence or relevant knowledge was available the link was approached scoring in a similar manner, a guidance note was created
unscored and the matrix cell left blank. The justification for each score (Appendix D) and multiple virtual meetings were held to discuss scoring
was captured alongside the score (Appendix F). For each ecosystem approaches. Knowledge gaps identified during the scoring process led to
service, habitats were scored relative to each other in terms of magni further targeted evidence searches and consultation with experts. This
tude of service provision, with the habitat with the highest and lowest first round of scoring took the individual teams between three and four
potentials (as indicated by the evidence) scored first. Only whole days to complete.
number scores were used. While it was initially anticipated that scoring The second round of scoring took place at a two-day workshop in
would occur at the micro-habitat level, it soon became apparent that this Plymouth, UK (August 2019) attended by 21 researchers representing
level of evidence was unavailable in most instances, partly due to the teams from all five countries. During the workshop, the following were
presence and absence of certain micro-habitats at the case study sites. discussed: concerns about the habitat classification, differences in
Consequently, scores were only allocated at the macro-habitat level that interpretation of the different ecosystem services and additional scoring
were present across case study sites unless specific evidence was rules that teams had developed to reach their final ecosystem potential
available. scores. Given the similarities in scores allocated by all teams for most
A confidence score was given to each ecosystem service potential provisioning and regulating services and some cultural services, it was
score based on the confidence the team had in the potential score and the decided to harmonise the scores across all locations to create a unified
supporting evidence (Table 1). Confidence was scored on a three-point ecosystem service potential matrix that could be applied beyond the case
scale where one indicated low confidence and three high confidence. study sites. The researchers divided into three self-selected groups with
Scoring was undertaken on two separate occasions. Once the representation from each participating country. Each group was
5
C. Hattam et al. Ecosystem Services 51 (2021) 101346
allocated a mix of ecosystem services and was provided with the existing Table 2
matrix scores (potential and confidence from the five country teams) Habitat classes used in the final version of the matrix.
and the evidence base. Each score was discussed with a view to define a Habitat Macro-habitat Micro- Comments
consensus score and a unified justification for this score. Any deviations type habitat
from the consensus scores were noted. This was particularly true for Cu Natural Mangrove Including mangrove plantations
Loa Cham-Hoi An, Vietnam, where many of the cultural service scores habitats Coral Includes dead coral that still
were distinct from those of the other case study sites. Consensus scores maintains reef structure, but
from each group, alongside important discussion points, were shared excludes coral rubble
Seagrass
during plenary sessions to ensure agreement. Sand Intertidal
subtidal
2.5. Validation: cross-checking the scores against the evidence and peer Mud Intertidal
review subtidal
Rock
Coarse substrata
The penultimate stage in the preparation of the matrix involved Pelagic
cross-checking the scores from the workshop with the evidence base, Modified Seaweed farms
followed by expert peer review of both the evidence base and the matrix habitats Fish cages
scores. After cross-checking, minor revisions were made to the confi Invertebrate Excludes shrimp ponds as they are
mariculture not present within the boundary
dence scores to better reflect the status of the evidence base. Peer review of case study sites
was undertaken by four experts with knowledge of both tropical marine Artificial Including breakwaters, seawalls,
habitats and ecosystem services in SE Asia. The outcome of the peer substrate pontoons and jetties
review resulted in modifications to two scores (the potential for seagrass Artificial
beaches
to provide habitat for charismatic species was increased from two to
three and the confidence score for mangroves to provide invertebrates
for food was increased to three). One additional piece of peer reviewed service (which became “food from other invertebrates”) and were
evidence and six personal communications were also incorporated into incorporated into food from pelagic fish (which became “food from
the evidence base. pelagic animals”) to better reflect their pelagic nature and to distinguish
them from less mobile invertebrate species. “Genetic materials from
2.6. Visualisation example: Biton Island, Palawan plants” and “genetic materials from animals” were combined into one
category due to insufficient evidence to score them independently.
To illustrate the potential use of this ecosystem service assessment, a Ranching was also excluded from the definition of “genetic materials
habitat map for the Black Rock MPA, Taytay Bay, Palawan (Philippines) from plants and animals” as it was considered not to involve the removal
was created and overlaid with the matrix scores. The habitat maps were of genetic material from one location to another. “Disease control” and
generated using a supervised Machine Learning approach (Random the “treatment and assimilation of waste” services were combined due to
Forests; Breiman, 2001) which was trained using a combination of overlaps between these and the inability to score them independently.
existing mapping and manual image interpretation. The classification The cultural service “places for recreation” was originally dis
was applied to Sentinel 2B satellite data from the 7th May 2020 for the aggregated into places used by residents and visitors in anticipation that
Tay Tay bay region to assign each pixel with the habitat it was most tourists and residents may utilise different locations, but the evidence
spectrally similar to. Due to the lack of high resolution bathymetry data base did not support this division and the two categories were combined.
for the area only spectral information was used and all areas where no All habitats were considered to have the potential to provide “places for
spectral information could be defined as one of the key habitats (sea knowledge-based activities” and “places for ceremonial activities”.
grass, coral reef, sediment or mangrove), and that were marine (as However, for ceremonial activities, it was decided that relative scoring
opposed to terrestrial and visually cross-checked) were then added to of the habitats for this service was not possible. In some cases, there was
the “pelagic habitat”. This classification was then manually refined for no available evidence to score this service. Consequently, habitats were
Black Rock MPA using GPS points collected during fieldwork to improve scored 1 where evidence indicated some potential. Cells were left blank
the accuracy for the specific area. The final habitat maps were then were there was either no evidence or no known potential.
converted to 50 × 50 m cells with each cell assigned the majority class One cultural service was removed from the classification (“places for
falling within it. These gridded habitat maps were used to generate gathering activities”). Gathering activities (e.g. fishing and gleaning)
ecosystem service maps. have a clear cultural component and make significant contributions to
individuals beyond the transactions made over the products harvested.
3. Results It was difficult, however, to disentangle the physical location of gath
ering from the object being gathered (i.e. the provisioning service).
3.1. Modifications to habitat and ecosystem service classifications Scores replicated those for food provisioning services. Consequently, the
gathering service was dropped from the matrix, but it must be recog
Across the four SE Asia case study sites, an initial total of 13 macro nised that provisioning services contain a cultural component that is not
and 21 micro habitats were identified as relevant ecosystem SPUs with easy to separate, at least through matrix assessments. These revisions
some further subdivisions to the micro habitats (Appendix A). To sup resulted in 18 ecosystem services being scored (Table 3).
port disaggregated scoring of the matrix, the evidence review initially
aimed to identify how each of the macro and micro-habitat classes
provides each of the ecosystem services in the classification. The evi 3.2. Evidence base
dence base including the use of expert opinion, however, did not support
this finer level of classification. Habitats were therefore scored at the In total 452 individual publications were included in the evidence
macro level only (Table 2), unless specific evidence for a disaggregated base to justify matrix scores. Some publications were used more than
score was available. once as they contained information pertinent to more than one
Workshop discussions about scoring led to modifications to the ecosystem service or habitat. This evidence base was supported by
ecosystem service classification and some definitions (Table 3). For expert judgement with 95 references to expert or study team opinions or
example, squid were removed from the “food from invertebrates” observations. Within the evidence base, 60% of all references were made
6C. Hattam et al. Ecosystem Services 51 (2021) 101346
Table 3 Table 3 (continued )
Final ecosystem service classification and definitions used. Ecosystem Ecosystem Definition Example
Ecosystem Ecosystem Definition Example service class service
service class service
prevention and
Provisioning Food from plants Food for Edible products from sediment retention
consumption by mangroves. (also including
humans from sediment
harvested plants. stabilisation).
Energy from Energy source from Mangrove for Water flow The contribution of a The role of coral reef
plants harvested plants. charcoal. regulation particular structures in
Other materials Fibres or other biotic Products harvested component of the dissipating wave
from plants material from from mangroves and marine ecosystem to energy before it
harvested plants used nipa. the dampening of the reaches shorelines.
for other purposes intensity of
including medicine, environmental
decoration, fashion, disturbances such as
handicrafts, storm, floods,
souvenirs, etc. tsunamis, and
Food from Food for Pelagic species hurricanes and the
pelagic animals consumption by harvested for food e. maintenance of
humans from pelagic g. tuna, mackerel and localized water flows
animal species from squid. such as coastal
wild capture fisheries current structures. (It
and mariculture is recognised that
sources. tsunamis behave
Food from Food for Demersal and farmed differently to wind
demersal fish consumption by fish for food e.g. and tidally formed
humans from grouper, rabbitfish waves and that
demersal animal and snapper. nothing will stop
species from wild some tsunamis).
capture fisheries and Maintaining The provision by a Some bioengineered
mariculture sources. nursery habitats particular habitats with
Food from other Food for Invertebrates component of the complex topographic
invertebrates consumption by harvested from the marine ecosystem of structures have been
humans from wild and from critical habitat for reported to play a
invertebrate species aquaculture e.g. reproduction and role in providing a
from wild capture molluscs, juvenile maturation refuge and feeding
fisheries, gleaning crustaceans, sea (nursery and feeding area for juvenile
and from mariculture cucumbers. functions). stages of fish, e.g.
sources. mangroves.
Other materials Fibres or other biotic Wild caught pearls, Climate The contribution of a This includes
from fauna material from seashells, fish regulation particular habitats that
harvested animals leather. component of the sequester carbon and
used for other marine ecosystem to long-term, decadal
purposes, including the maintenance of a storage, e.g.
medicine, favourable climate mangroves
decoration, fashion, through impacts on
handicrafts, the hydrological
souvenirs, etc. cycle, temperature
Genetic material Genetic material Seed or broodstock regulation, and the
from plants and from marine plants collection for contribution to
animals and animals aquaculture; climate-influencing
(including seeds, mangrove seedlings/ substances in the
spat, spores, whole seeds/cuttings for atmosphere.
plants or animals, plantations and Maintaining The provision by a Charismatic species
individual genes) for mangrove habitats for particular include plants
use in non-medicinal replanting. charismatic component of the reptiles, mammals,
contexts, such as species marine ecosystem of birds, fish and
maintaining or critical habitat for invertebrates (see
establishing a different charismatic Appendix E for full
population, breeding species either as a list considered).
new strains or shelter, feeding
varieties, habitat or a resting
construction of new place during
entities (from genes). migration and that is
Regulating Treatment and The removal of Removal of heavy or could be managed
assimilation of contaminants and metals, agri- for the presence of
wastes or toxic organic nutrient chemicals and other these species.
substances inputs of human pollutants, as well as Cultural Recreation Places that are used The use of beaches
origin, including the removal of for recreation for recreational
sewage waste and bacteria and viruses activities by residents activities.
other wastes. e.g. E. coli. (local people) and
Erosion control The contribution of a The role that visitors
particular mangrove roots play Ceremonial Places where Sacred sites within
component of the in stabilizing activities customs, rituals and mangroves used for
marine ecosystem to sediments and or religious activities ceremonial activities.
coastal erosion preventing erosion. occur and/or are
(continued on next page)
7C. Hattam et al. Ecosystem Services 51 (2021) 101346
Table 3 (continued ) associated with modified and sedimentary habitats as suggested by the
Ecosystem Ecosystem Definition Example limited availability of evidence for these habitats (Fig. 3b).
service class service In general, there were fewer scoring gaps for the potential of biogenic
significant for local
habitats to provide ecosystem services, but only mangroves were
beliefs assessed for all services. Mangroves show considerable potential for
Creative Places where the Seagrass beds and the ecosystem service provision with 13 out of the 18 ecosystem services
activities collection of objects/ seagrasses assessed scored as 3 (high potential). Sedimentary habitats received low
materials or themselves are used
potential scores across all services, while modified habitats generally
experiences are as inspiration for
important for crafts creative activities. scored higher for provisioning services (for which some of them are
and for creative specifically designed), but less well for regulating and cultural services.
processes occur. Scores for the pelagic habitat were mixed. In no case, however, were
Knowledge- Places that are used Visits by school individual ecosystem services assessed across all habitats. In general,
based activities for educational children to learn
activities about a site, citizen
regulating services were the most frequently assessed across habitats,
science or with “maintaining nursery habitats” being assessed for all macro habi
community tats and one micro-habitat. This was followed by “food provision from
environmental invertebrates”, “water flow regulation” and “places for knowledge-based
activities e.g. reef
activities”. Despite the inclusion of intertidal and subtidal sand and mud
monitoring,
mangrove planting habitats, these micro-habitats were only scored for two and five
and monitoring ecosystem services respectively.
Confidence scores mirror the ecosystem service potential scores in
sofar as confidence is correspondingly greater for mangroves and corals
to peer reviewed literature, 24% to grey literature and 16% to expert and lower for sedimentary and most modified habitats. This reflects the
opinion. The majority of publications (86%) were published after 2000 smaller published evidence base and the greater use of expert opinion to
and came from the case study countries or the wider Indo-Pacific (66%) score the ecosystem service potential for these habitats. In terms of
(Fig. 3a). Evidence was much more readily available for mangroves, ecosystem services, the highest confidence scores were allocated to
coral reefs and seagrass meadows, followed by the pelagic ecosystem “food from invertebrates” and “places for recreation”. Confidence scores
and seaweed farms (Fig. 3b). Evidence for sedimentary and modified were also higher for regulating services from biogenic habitats with the
habitats (other than seaweed farms) was scarce. exception of “water flow regulation” and “erosion control” as the roles of
In terms of ecosystem services, most evidence was found for provi these habitats in these services is less clear (e.g. mangroves can act as a
sioning services (49%), followed by regulating services (34%) and cul buffer against storm surges, but can also funnel water upstream). Con
tural services (12%). Approximately 5% of publications used in this fidence scores for cultural services are also generally lower, reflecting
study were not specific to SE Asia as they included, for example, global the difficulty in harmonising these scores and the absence of docu
studies that described a habitat, ecosystem service or process. For in mented evidence for these services.
dividual ecosystem services, evidence for the “provision of food by in
vertebrates” was supported by the largest volume of literature (Fig. 3c) 3.4. Data visualisation example: Biton Island, Palawan
followed by the “provision of habitat for charismatic species” and
“nursery habitat” (both regulating services). With the exception of As an illustration, the information derived from the matrix for four
“places for recreational activities”, relatively little evidence was avail provisioning services (Fig. 4) was converted into ecosystem service po
able for cultural services. tential maps for the Biton Island, Palawan (Fig. 5). The absence of
detailed habitats maps, and challenges associated with using satellite
3.3. Matrix scores data to create habitats maps, has meant that only five distinct habitats
could be included (mangroves, corals, seagrasses, sand and pelagic).
Modifications to the habitat and ecosystem service classification Nevertheless, the relative importance of these habitats for provisioning
compilation resulted in 270 possible habitat-ecosystem service combi services can be seen.
nations available for scoring (15 individual habitats and 18 ecosystem
services). Evidence was insufficient for all combinations to be scored, for 4. Discussion
example, no evidence could be found for the contribution of seagrass
habitats to “energy from plants” or rock habitats to “maintaining nursery To our knowledge this is the first attempt to systematically capture
grounds”. In total 64.4% of all combinations were scored, including 55% the provision of ecosystem services from tropical marine habitats.
of all habitat-provisioning service combinations, 75.6% of all habitat- Ecosystem service scores together with the evidence base and our con
regulating services combinations and 66.7% of all habitat-cultural ser fidence in this evidence, constitute a considerable advance in the
vice combinations (Table 4). The lower level of assessment for provi assessment of ecosystem services in marine tropical regions, where the
sioning services can be attributed primarily to a lack of evidence for state of knowledge lags behind temperate systems (Townsend et al.,
services generated from plants, especially “energy from plants” which 2018; Lautenbach et al., 2019). We believe the harmonised ecosystem
could only be assessed for mangroves. service scores for marine and coastal habitats constitute a valuable
The harmonised matrix (Fig. 4) provides an overview of the scores baseline for marine ecosystem service assessments within SE Asia, and
allocated to each habitat-service combination (see Appendix F for the highlight the gaps and research needs to improve our understanding of
evidence and justification behind each score). Where harmonisation was ecosystem service provision from tropical marine systems.
not possible (on all but five occasions), this is noted with the score
justification. Where a score could not be agreed, the score presented 4.1. Uncertainty within the matrix
represents agreement for three case study sites, with the alternative
score and its corresponding case study location noted below. Horizontal The absence of reporting on the uncertainties associated with the
reading of the matrix indicates how each habitat potentially provides development of an ecosystem service potential matrix is one of the main
ecosystem services, while vertical reading provides a summary of the criticisms of this approach (Jacobs et al., 2015; Campagne et al., 2017).
potential for each habitat, relative to the others, to provide a service. The primary method used in this study for dealing with uncertainty
Gaps in the matrix, where scoring was not possible, are mostly involved the creation of a clear evidence trail and justification for each
8C. Hattam et al. Ecosystem Services 51 (2021) 101346
Fig. 3. a) Study location of literature cited; b) Categorisation of evidence used and c) Citations by ecosystem service.
9C. Hattam et al. Ecosystem Services 51 (2021) 101346
Table 4 environment do not capture the horizontal and vertical movement of
Habitat-ecosystem service combinations scored. species through the water column, nor the temporal differences in use of
Provisioning Regulating Cultural Total habitats by species at different stages of their lifecycle (Townsend et al.,
2018; Hooper et al., 2019). Culhane et al. (2018) therefore recommend
Possible habitat-ecosystem 120 90 60 270
service combinations the use of both habitats and biotic taxa as SPUs. Being flexible, the
Combinations assessed 66 68 40 174 matrix approach can accommodate this suggestion (e.g. Potts et al.,
% combinations assessed 55.0 75.6 66.7 64.4 2014), and this may be a useful approach for assessing areas and eco
systems with shared species.
score, the assignment of confidence scores to ecosystem service potential
4.1.2. Resolution and location of evidence
scores and a validation stage. However, not all aspects of uncertainty can
The literature review was the main source of evidence used to score
be removed in this way. While Müller et al. (2020) and Hou et al. (2013)
the matrix. Despite extensive searches, data could not be found relevant
discuss potential uncertainties associated with matrix approaches at
to all habitats and ecosystem services, and hence the quality and
length, we focus on four areas of particular relevance to this study.
coverage of the literature found was variable. While care was used to
check the appropriateness of the studies for inclusion, differences in the
4.1.1. Absence of habitat information
species, environmental conditions or cultural circumstances of each
The accuracy of matrix-based assessments depends not only on the
study increase the uncertainty in the matrix scores. Where possible, this
judgment of the experts completing the scoring, but also on the quality
uncertainty is reflected in the confidence scores and the validation stage,
of baseline data on the habitats for which the scores are assigned.
but inconsistencies may remain.
Ideally, information on the habitats supplying the ecosystem services
The gaps in the evidence base indicate clear research needs for
should be gathered in as detailed manner as possible, in a resolution and
advancing ecosystem service assessments for the SE Asian marine
scale appropriate to the context for which the assessment is made
environment. Sedimentary habitats require particular attention. Marine
(Burkhard et al., 2012). The general absence of habitat data faced by this
soft sediments are among the largest habitats globally and in SE Asia, but
project, beyond knowledge of the location of the broad biogenic habi
little is known about the species assemblage and associated ecological
tats, resulted in the need to generate a generic habitat classification. It
role (Gray, 2002; De Brauwer et al., 2019). Elsewhere, the biota within
has not been possible to ground truth this classification beyond
marine sediments is recognised for its role in ecosystem service provi
consultation with local stakeholders. Considerable uncertainty exists
sion, especially regulating services (Weslawski et al., 2004; Hope et al.,
about the sedimentary habitats in particular, yet despite these habitats
2020). In terms of ecosystem services, provisioning services are well
generally receiving low ecosystem service potential scores, combined
documented especially when the focus is on food from marine animal
they form the majority of the marine habitats in the case study sites in
species, but cultural services, other than recreation are poorly repre
spatial terms. Their overall contribution to ecosystem services by these
sented in the evidence found. This is not uncommon (Liquete et al.,
habitats may therefore be substantial.
2013); Garcia Rodrigues et al. (2017) highlighted an absence of cultural
Whether habitats are the most appropriate service providing unit
ecosystem service research in SE Asia.
(SPUs) can also be questioned. Spatial approaches in the marine
Fig. 4. Matrix of potential ecosystem service scores by habitat. Shading indicates service score while numbers represent confidence scores. Scoring for places for
ceremonial activities differed from other ecosystem services with shading indicating potential presence of the service; a blank cell means no known potential or
evidence for ceremonial activities in this habitat. A single country is noted when the distinct score from one case study could not be harmonised with scores from
other case studies.
10C. Hattam et al. Ecosystem Services 51 (2021) 101346
Fig. 5. Visualisation of the potential for provisioning service delivery from the Biton Island, Tay Tay, Palawan in the Philippines. a) Location of the site; b) Habitat
map; c) Food from demersal fish; d) Food from pelagic animals; e) Food from plants; f) Other materials from plants.
4.1.3. Modified habitats: Pressure or ecosystem service providers? g. Macura et al., 2019). This negative impact, however, should not be
In terrestrial applications of the matrix approach, modified habitats overlooked. A subsequent stage in this ecosystem service assessment will
such as agricultural land and urban areas are included in the matrices as add an additional layer into the GIS to illustrate how human pressures
land cover types, following the use of land use land cover (LULC) geo are influencing the ability of habitats to provide ecosystem services
spatial mapping approaches to define the ecosystem SPUs. The absence (section 4.2.1).
of an analogous marine mapping approach has meant that previous
marine matrix applications have used either natural, unmodified habitat 4.1.4. Interdependencies and overlaps between services
types (e.g. Geange et al., 2019) or seabed biotopes (e.g. Salomidi et al., One of the biggest challenges when scoring the matrix arose from the
2012), or a mixture of habitats and key species (e.g. Potts et al., 2014) as interdependency and overlap between ecosystem services. Although the
SPUs. Given the focal applications of these studies on marine protected definition of each individual ecosystem service is designed to reduce
areas (e.g. Potts et al., 2014; Geange et al., 2019) or marine planning of overlap and avoid double counting (Fisher et al., 2009), some overlaps
whole seas (e.g. Galparsoro et al., 2014; Depellegrin et al., 2017), still exist, especially with cultural services. Cultural services are an
modified habitats may not form a large proportion of the habitat types in accumulation of human experiences tied to the environment, many of
these areas. In SE Asia, however, coastal environments such as those of which are location specific (Chan et al., 2012) and the overlap between
the case study sites can contain large numbers of artificial structures provisioning and cultural services is particularly striking. While it is
such as fish cages, seaweed farms, pearl farms, jetties and seawalls tempting, for ease, to remove cultural services from the matrix (e.g.
(Chung et al., 2017; IPBES, 2018). Typically, these structures and Geange et al., 2019), Chan et al. (2012) explicitly recognise that cultural
associated activities are viewed as pressures on the marine environment ecosystem services overlap with other services and suggest that, where
(Holmer, 2010) but there is growing evidence that these structures act as valuation is not the end point, this overlap is not problematic. Under
fish aggregating devices (e.g. Oakes and Pondella II, 2009, Sudirman standing the cultural complexities associated with marine resource and
et al., 2009) and are likely to be rapidly colonised by marine organisms ecosystem service use may be essential to the success of marine man
that can contribute to the provision of ecosystem services (Alleway et al., agement measures (FAO, 2001). Where such measures are introduced, it
2019). may not be possible to trade cultural ecosystem services off against other
The inclusion of artificial structures as modified habitats is not services. Impacts need to be examined discursively alongside differential
without challenge due to the three dimensional nature of the marine access of groups to these services (Chan et al., 2012; Fish et al., 2016).
environment. Some artificial structures are found in the water column These interdependencies are not unique to provisioning and cultural
above coral reefs, seagrass beds or sedimentary habitats. It is not services. Regulating services (e.g. maintaining nursery habitats) are
possible, given the evidence available, to entirely disentangle the essential to the supply of provisioning services (e.g. food from demersal,
contribution of the artificial structures to the provision of ecosystem pelagic and invertebrate species) and, in some cases should be consid
service from the natural habitat below or the water column (pelagic ered as supporting services. Ecosystems are inherently complex with
habitat) itself. This introduces an additional layer of uncertainty into the multiple species contributing to multiple functions supporting multiple
modified habitat scores. Formal inclusion within the assessment of these services. While the matrix can provide an overview of the importance of
modified habitats, which are increasingly dominating coastal seascapes different habitats to the provision of different services, management
in SE Asia, acknowledges their positive contribution to ecosystem ser actions that build upon the matrix model need to take this complexity
vices, in contrast to the negative impacts often associated with them (e. into consideration (Townsend et al., 2018).
11You can also read