ECONOMIC IMPACT OF THE PURCHASING FROM PEOPLE WITH DISABILITIES PROGRAM ON TEXAS
←
→
Page content transcription
If your browser does not render page correctly, please read the page content below

ECONOMIC IMPACT OF
THE PURCHASING FROM
PEOPLE WITH DISABILITIES
PROGRAM ON TEXAS

Analysis of Contributions, Costs, and
Effectiveness of the State Use Program
on the Texas Economy

Prepared for the
Texas Workforce Commission

Rebecca Davis
Mikhail Kouliavtsev
Mark Scanlan

Department of Economics and Finance
Stephen F. Austin State University

February 2022

About the Authors

 Rebecca Davis is an Assistant Professor of Economics in the Department of Economics
 and Finance at Stephen F. Austin State University. Her research is primarily in the field
 of energy economics. Dr. Davis has extensive experience in economic impact studies
 from her work at the Howard H. Baker Jr. Center for Public Policy at the University
 of Tennessee. Her articles have been published in Energy Economics. At SFA, she
 teaches courses in microeconomics and statistics. Her undergraduate degree is a BS in
 Economics from West Virginia Wesleyan College and her MA and PhD degrees are from
 the University of Tennessee.

 Mikhail Kouliavtsev is a Professor of Economics and currently serves as chair of the
 Department of Economics and Finance at Stephen F. Austin State University. He teaches
 courses in microeconomics, managerial economics and statistics. Dr. Kouliavtsev’s
 research is in the areas of industrial organization, antitrust policy, international trade,
 and the economics of education. His articles have been published in Economic Inquiry,
 Review of Industrial Organization, Empirical Economics, and Review of International
 Economics. Prior to joining the faculty at SFA, Mikhail was an Assistant Professor in the
 School of Business at Philadelphia University. He holds a BA in Economics from Lyon
 College, and an MA and PhD degrees in Economics from Temple University.

 Mark Scanlan is a Professor of Economics in the Department of Economics and Finance
 at Stephen F. Austin State University. His research interests are in public economics,
 particularly the impact of taxing internet purchases. Dr. Scanlan has published his
 research in Fiscal Studies, Journal of Business, Industry, and Economics, and Review of
 Business Research as well as other economics journals. At SFA, he teaches courses in
 macroeconomics, public economics, money and banking, and international trade. He
 holds a BA in Economics from Lyon College, and an MA and PhD degrees in Economics
 from the University of Florida.

 The authors gratefully acknowledge cooperation and assistance from the staff at WorkQuest, The Office of
 Texas Comptroller of Public Accounts, and Texas Workforce Commission.

                                                 2
IMPACT BY THE NUMBERS
2019

$304.4 million              $167.3 million                     Over 9,400                     $7.5 million
 of output added         of total personal income         jobs created, including       in additional state and local

to Texas’ state gross     generated in the state          those both directly and       sales tax revenue generated

                                                           indirectly supported           by program spending

IMPACT BY THE NUMBERS
2020

$296.6 million              $162.8 million                     Over 8,800                     $7.3 million
 of output added         of total personal income         jobs created, including       in additional state and local

to Texas’ state gross     generated in the state          those both directly and       sales tax revenue generated

                                                           indirectly supported           by program spending

Total Economic Benefits of the State Use Program
2019   and 2020
$296.6 million

The following table summarizes the State Use Program’s impact on the Texas economy in 2019 and 2020:

 Impact                                                 2019                               2020

 Output                                    $304,390,336                           $296,632,846

 Income                                     $167,320,514                            $162,756,691

 Employment                                         9,425                                  8,873

                                                    3
0. Executive Summary

The Texas Purchasing from People with Disabilities program was first implemented in 1978 with the goal of
enhancing the lives of Texans with disabilities by providing them with employment opportunities and ways to achieve
independence. The program is overseen by the Texas Workforce Commission (TWC), but its daily operations are
administered by WorkQuest (formerly known as TIBH), a non-profit agency. The program, commonly known as the
“State Use Program” establishes the process whereby state agencies purchase certain goods and services from
Community Rehabilitation Programs (CRPs), which hire people with disabilities to produce and supply those goods and
services.

The Department of Economics and Finance at Stephen F. Austin State University (SFA) was engaged by TWC staff
to perform a study of the program’s contributions to the Texas economy, specifically addressing issues and concerns
raised in the 2015 Sunset Advisory Commission report. The current report is the result of this study which uses data
provided by WorkQuest, Texas Comptroller’s Office, TWC, individual CRPs, and several state agencies.

In fiscal year (FY) 2019, the State Use Program:

•    Added approximately $304.4 million of output to Texas’ state gross domestic product (SGDP).
•    Generated roughly $167.3 million of total personal income in the state. Each in-state dollar of income directly
     paid by the program translated into a total of $2.23 in personal income for Texas residents.
•    Created over 9,400 jobs, including those both directly and indirectly supported; this means that for every one
     program job, an average of 1.29 other jobs were created in Texas.
•    Spending by the program generated about $7.5 million in additional state and local sales tax revenues.

In FY 2020, the program:

•    Added approximately $296.6 million to Texas’ state gross domestic product (SGDP).
•    Generated about $162.8 million in total personal income; each in-state dollar of income directly paid by the
     program translated into a total of $2.20 in personal income for Texas residents.
•    Created nearly 8,900 total jobs, implying that for every one program job, 1.29 additional jobs were created.
•    Spending by the program generated about $7.3 million in additional state and local sales tax revenues.

The following table summarizes the State Use Program’s impact on the Texas economy in 2019 and 2020:

    Table E1: Total Economic Benef its of the State Use Program in 2019 and 2020

    Impact                                                      2019                                  2020

    Output                                          $304,390,336                           $296,632,846

    Income                                            $167,320,514                           $162,756,691

    Employment                                                  9,425                                 8,873

                                                            4
Regionally, the program had the greatest impact in the
following areas:

•   In the Capital, Gulf Coast, Metroplex, and South                                        Regionally,
    Texas regions, the program generated the most
    output and income for both fiscal years 2019 and
    2020; in these areas, the program also employed
                                                                                           all areas of
    the highest number of individuals in 2019.
•   In fiscal year 2020, the greatest number of                                   the state were
    individuals were employed in the Capital, Central,
    Metroplex, and South Texas regions.                                              significantly
In addition to the immediate economic impact on the
state and regional economy of Texas, the program
                                                                                             positively
benefited Texans in other ways. In particular, it:
                                                                                               impacted
Æ Generated an additional influx of federal funds into
    the state through earned income tax credits (EITC);
Æ Decreased the burden on state and federal public
                                                                                         by program
    assistance programs;
Æ Supplied competitively priced products and services                                           activities.
    to 237 state agencies;
Æ Positively impacted all areas of the state.

Many other nonpecuniary benefits can be attributed to the program, such as the added value employment provides in
improving individuals’ with disabilities health outcomes, social ties, sense of identify and belonging.

The remainder of the report is organized as follows. Section 1 provides some background and an overview of the State
Use Program; Section 2 describes the landscape of disability across the US and in Texas; the main analysis of the
economic contribution of the program is in Section 3, which includes an assessment of tax implications, potential costs of
the program, a discussion of impacts on minority operated businesses, and a detailed breakdown of the economic impact
by region of Texas. Data from both 2019 and 2020 are used to investigate any recent trends and analyze the effects of
COVID-19. Section 4 addresses each of the concerns identified in the 2015 Sunset Advisory Commission Report with
respect to various metrics of the program’s effectiveness and performance, and Section 5 concludes.

                                                             5
Kenneth Ming: Making
purchasing a priority                                              “ It just makes sense to

Kenneth Ming has been in the business of state                    put money back into the
procurement for almost 20 years, and he says TIBH
(WorkQuest) and its WorksWonders Program have                   community and help make
been constants in his work life. “Wherever I’ve been
employed, I’ve made it a priority to support these                  those with disabilities
programs,” he said. “They provide benefits to individuals
who would otherwise not have those opportunities.”
                                                                   contributing members
Ming is director of business operations and contracts at
the Texas Juvenile Justice Department (TJJD). Before                of the Texas economy,”
that, he spent many years working for the state at the
Texas Department of Criminal Justice and the Texas                    he said. “They get to
Youth Commission.
“WorksWonders is part of the culture among public               experience independence
purchasers at state agencies,” Ming said. “We’re always
sharing notes on how to maximize our use of the
                                                                        and improve self-
program and are active in suggesting new improvements
to the buying experience. TIBH is almost always
discussed at purchasing meetings.”                              esteem by being gainfully

Ming said he learned the benefits of using the program              employed. Purchasing
early on in his purchasing career.
“It just makes sense to put money back into the                  through TIBH allows us to
community and help make those with disabilities
contributing members of the Texas economy,” he said.
                                                                        be a part of that. ”
“They get to experience independence and improve self-
esteem by being gainfully employed. Purchasing through
TIBH allows us to be a part of that.”

                                                            6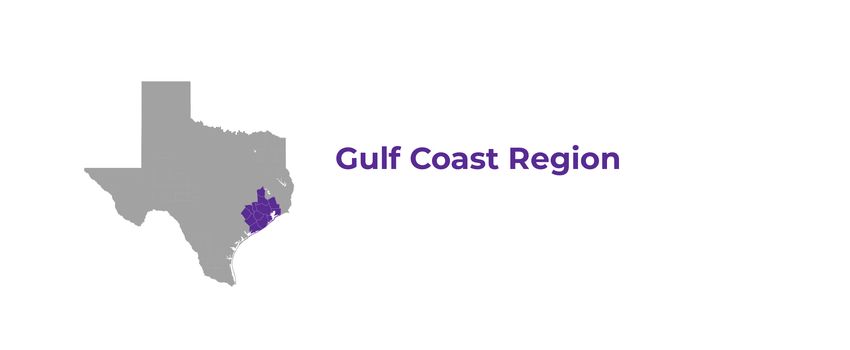
Ming, who has been with TJJD for 10 years, oversees warehouse operations and assets. He manages the
agency’s nearly 400 active contracts and approximately 12,000 yearly purchase orders––most of these with
TIBH. His agency has a large custodial contract with TIBH through which they purchase office supplies, janitorial
supplies, bed and bath items, furniture and temporary employment services. Although TJJD currently purchases
as much as it can through WorksWonders, if TIBH were to add more products that TJJD could use, Ming said
he would consider expanding the contract.

“Purchasing through TIBH and the WorksWonders Program is mandatory for state agencies, but TJJD still aims
to purchase as much as possible from the program to support its greater cause,” Ming said.
Ming credits purchasers Deb Baize, Jackie Schmaltz, Patrick Koll, Brittany Williams and Brenda Medack, as well
as warehouse manager Noel Ruiz, for TJJD’s dedication to the program.

“My purchasing staff understands the importance of buying from TIBH and supporting the WorksWonders
Program,” Ming said. “They’re certified, well-trained and are the main reason why TJJD has been recognized by
TIBH as one of its Top 10 purchasing agencies for the past four years.”

Before his state purchasing career, Ming provided direct care to patients at Southeast Louisiana State Hospital.
That experience sparked his affinity for supporting programs such as WorksWonders.
“They didn’t see themselves as different,” he said. “I saw that they were happy and wanted to be involved. That
shaped me as I entered the job market. TIBH provides a way to do the job I love––purchasing––and use it to
help better someone else’s life.”

                                                            “ TIBH provides a way to do

                                                            the job I love––purchasing––

                                                            and use it to help better

                                                            someone else’s life. ”

                                                        7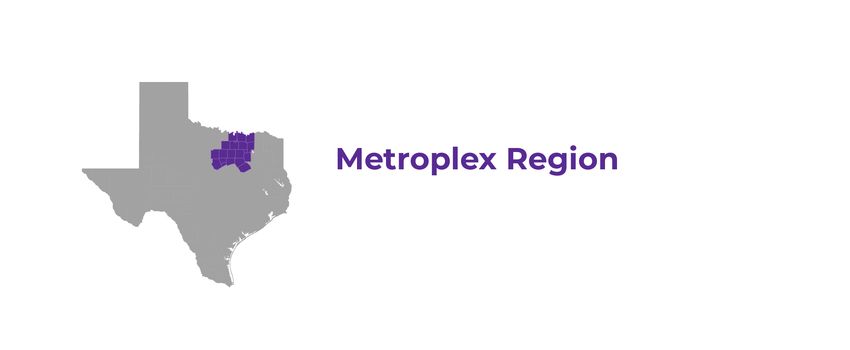
1. Overview of the Texas Purchasing
     from People with Disabilities Program

In Texas, the Purchasing from People with Disabilities program, also commonly known as the State Use Program, is
an initiative whereby individuals with disabilities are provided opportunities for employment, personal and professional
growth and development, and a pathway to attaining independence. These individuals are employed in their own
communities through a Community Rehabilitation Program (CRP) to produce products and perform services, which
are purchased by all state agencies. While some exceptions are allowed, state agencies must purchase goods and
services made available through the State Use Program.

The Texas Workforce Commission (TWC) has the statutory authority to oversee the State Use Program, and it
contracts with a Central Nonprofit Agency (CNA) to manage and administer the program’s operations. Since 1978,
WorkQuest has been TWC’s choice of CNA; WorkQuest markets the program as Works Wonders. As of 2020, there
are 106 CRPs actively operating within the program.

State agencies, such as municipalities, courts, school districts, higher education institutions, and others make
required purchases, in accordance with state law, of products and services provided by the State Use Program;
purchases are made through an online portal, Texas SmartBuy. Exceptions allowing state agencies to purchase
these products outside of the program are allowed for one of five reasons: quality, quantity, delivery time, life cycle
cost or testing/inspection. Agencies requesting exceptions must report them and specify the reason(s) for going
outside of the program. Exception reports are filed monthly with the Texas Comptroller of Public Accounts.

The following page is a list of goods and types of services the program provided in 2019.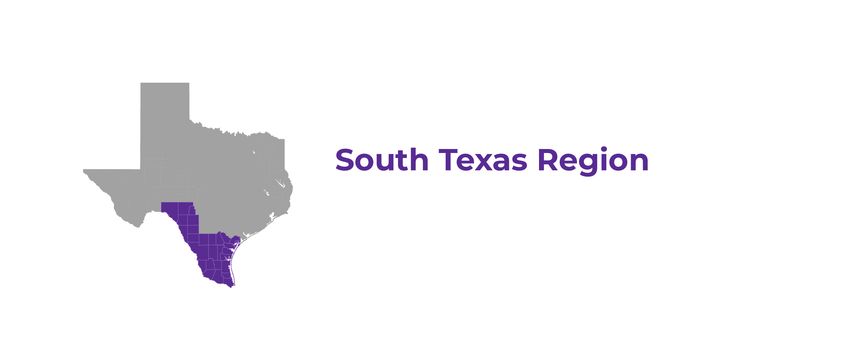
Products:
  Absorbent                         Delineator                      LED beacon
  Air filters                       Desk diaries/day planners       LED light bulbs
  Air freshener                     Dessert, snack                  Litter pickup sticks
  Almonds                           Dip, packaged                   Napkins, dispenser type
  Auxiliary light                   Disinfectant pine oil           Neck lanyard
  Award items                       Diskettes, 3.5                  Nitrile examination gloves
  Bag, paper                        DNA collection kit              Note pad/self stick/ legal
  Bags, rock sample                 Drug test kit                   Nylon laundry bag
  Bar soap                          Dry erase starter kit           Nylon scrubbing pads
  Bathroom sissue                   Dust mask                       Odor eliminator
  Binders, 3 ring pressboard        Dustpan set                     Panties
  Binding, wide back plastic        DVD and CD sleeves              Paper towel wipe
  Biodegradable cleaners            Engineering stakes/ wood-       Paperboard mailer
  Blood alcohol test kit booster    laths                           Pencils, mechanical
  Cables                            File organizer                  Pens, all types
  Bottled water                     First aid kit                   Portion Pac cleaning products
  Brassieres                        Flash drive                     Protective helmets
  Cable ties                        Floor maintenance pads          Rakes
  Caps, baseball                    Glass cleaner                   Reflective sheeting
  Carbon paper                      Glasses, safety                 Restraints Shredder oil
  Chair mats                        Gloves, drivers                 Spices
  Chairs                            Hand sanitizer – instant        Sponge scrubbers
  Clam clips and refills cleaner,   Hand soap                       Spring rake, heavy duty
  grille                            Hand trucks, platforms,         Steel toe rubber boot
  Clips, paper & binder             dollies                         Tech wipe
  Clocks, battery                   Hanging wall pocket             Tile cleaner
  Coffee, instant                   Headphones                      Toner cartridges
  Compact discs                     Highlighters & markers          Towels, 100% cotton muslin
  Copy paper                        ID card reel, card holder       Urinal screen kit
  Correction stick/tape             Illuminator stick highlighter
  CorrectPac cleaning products      Index tabs
  Coveralls                         Labels

Services:
  Air filter service                Grounds maintenance             Power washing
  Bat guano removal                 Guard rail repair Janitorial    Recycling maintenance Right of
  Bus cleaning                      maintenance Janitorial/         way mowing Roadside
  Cabinet installation              grounds maintenance             maintenance Roadside mowing
  Carpet cleaning                   Landscape maintenance           Service station attendant
  Carport installation              Linen folding                   Shipping Logistics
  Data entry service                Litter barrel pickup            Sign installation
  Debris pickup                     Litter pickup                   Sump pump cleaning Technical
  Delineator replacement            Mail room services              assistance
  Drain inlet cleaning              Maintenance                     Tree & brush control
  Edging/trimming                   Mechanical mulching             Tree pruning/trimming
  maintenance                       Moving maintenance              Tree removal
  Facility maintenance              Mowing maintenance Paint        Vegetation control
  Floor maintenance                 maintenance                     Vehicle cleaning
  Furniture                         Pest control
  cleaning/reupholster              Picnic area maintenance
  General construction

                                                   9
Criteria for Certification of CRPs

    Community Rehabilitation Programs (CRPs) are government or private nonprofit entities that must be certified by
    the TWC in order to participate in the State Use Program. Recertification is required every three years. To be
    certified, a CRP must comply with various data collection and reporting requirements (including human resources
    and accounting documentation, establishing and documenting presence of disabilities among individuals
    employed, and so on). Additionally, CRP staff is charged with developing a person-centered plan for each
    individual with a disability that establishes employment goals and matches the individual’s skills and desires.

    Program’s Stated Goals and Purpose

    One of the two goals of the State Use Program, according to Texas Administrative Code,1 is to

         […] further the state's policy of encouraging and assisting individuals with disabilities to achieve maximum
         personal independence by engaging in useful productive employment activities […]

    which falls under the purview of the TWC. Therefore, the goals of the program are not to simply employ
    individuals with disabilities, but to provide them with meaningful work, assist them in developing workplace skills
    and abilities, and encourage them to eventually seek and secure competitive integrated employment outside of
    the program.

40 Tex. Admin. Code § 806.1 (2017).
1

                                                                10
2. Disability in Texas and the US
In 2019, according the US Census Bureau, there were 323,205,854 civilians living in the community2 in the United States.
Of this number, 41,156,238 individuals or 12.7 percent had some kind of disability. For Texas, these numbers are:
28,522,630 civilians living in the community; 3,282,543 people or 11.5 percent living with a disability.
With respect to gender, there are about equal numbers of men and women with disabilities in Texas. People with disabilities
largely tend to live in urban centers – nearly 80 percent live in or near a major population center.
Poverty
In the US, 11.4 percent of adults without disabilities aged 18-64 lived in poverty in 2019. In Texas, this proportion was
11.7 percent, which ranks the state 25th. Among people with disabilities, the proportion of US adults in poverty is
25.9 percent, while in Texas it is 22.8 percent; Texas ranks 41st (only nine states have lower poverty rates among those
with disabilities). However, the poverty gap – the difference between the percentage of those with disabilities living in
poverty and those without disabilities – is 14.5 percent for the US and only 11.1 percent for Texas. The state ranks third
in this regard; only Montana and Utah have lower poverty gaps.
Employment
In general, employment rates among those with disabilities are markedly lower than employment of people without
disabilities. However, the rate of employment in Texas is slightly higher than in the US overall, 41.9 percent in the state
versus 38.8 percent nationwide. Employment is particularly low among individuals with cognitive disabilities, somewhat
higher for those with vision disabilities, and higher yet for people with hearing disabilities. This holds for both Texas and
the United States as a whole.
Earnings
In terms of earnings, Texas ranks 29th among states in annual median earnings for civilian adults and 25th in median
earnings for adults with disabilities. The earnings gap – the difference between median earnings for those without
disabilities and those with disabilities – is lower in Texas than in the US as a whole; Texas ranks 23rd in this regard.
While the state compares somewhat favorably to the nation as a whole on several metrics of well-being of adults with
disabilities, it is a recognized fact that people with disabilities face many obstacles on their journey to independence:
securing meaningful and gainful employment is challenging and often impossible. That in itself leads to further problems of
poverty, food insecurity, lack of skills and work experience making future employment uncertain.
This measure excludes those on active military duty and those institutionalized.
2
113. Economic Impact of the State Use
Program on Texas Economy
Figure 1: Total Program Sales
In 2020, State Use Program sales
as reported by WorkQuest totaled
$169,640,034, which represents
a four percent growth over
2019 and approximately 19
percent growth over the five-year
period 2016-2020.
Below, “2019” and “2020” are used
to refer to fiscal year 2019 and
fiscal year 2020 respectively.
Statewide Contribution to Economic Activity: 2019 vs 2020
I. Introduction
Since the creation of the Texas State Use Program in 1978, its operations have contributed to the state of Texas, its
residents, and local governments. The program yields significant benefits to the state economy through the creation
of jobs and income, increases in state output, and expansions in state and local tax bases. These economic benefits
span the entire state, with the Capital, Gulf Coast, Metroplex, and South Texas regions seeing the most activity.3
3
Texas economic regions are defined by the Comptroller and include the following: Alamo, Capital, Central
Texas, Gulf Coast, High Plains, Metroplex, Northwest, South Texas, Southeast, Upper East, Upper Rio
Grande, and West Texas. Each region is made up of a subgroup of adjacent counties within the state.
12II. Output, Income, Job, and Sales Tax Benefits of the State Use
Program in Texas for 2019
The analysis below estimates the economic benefits of the program based on fiscal year 2019 spending figures from
four types of contracts: services, statewide services, temporary services, and products. The economic impact model
uses detailed expenditure data provided by the State Use Program as inputs to generate impact estimates. Steps
were taken in the data collection process to prevent the double counting of expenditures for contracts that span
multiple fiscal years (Appendix C provides the relevant details).
There are three main components of the analysis: the direct effects of the program, the indirect effects, and the
multiplier (or induced) effects. As the program provides jobs and pays their employees, income from employment is
created directly. In addition, income and employment are generated indirectly when the program purchases goods
and services from Texas manufacturers, service providers, and vendors – firms that in turn hire workers, earn profits,
and generate income. The multiplier process results in the creation of income and employment as workers spend
their incomes in-state and as other firms generate sales, earn profits, and hire new employees. Translating direct
effects into total effects through multiplier analysis requires the use of Regional Input-Output Modeling System (RIMS
II) multipliers, which are specific to Texas, based on 2019 regional data, and come from the US Bureau of Economic
Analysis.
The direct, indirect, and multiplier effects are aggregated to yield the total income, employment, and tax revenue
impacts of the State Use Program. Direct effects are attributable to the actual operation of the program, including
hiring of CRP staff (the direct employment impact) and payments to these workers (the direct income effect). Indirect
effects result from program purchases of goods and services. Lastly, the multiplier effect occurs as the direct and
indirect incomes are spent and re-spent within the state. For example, program employees spend a portion of their
wages and salaries in the local community on goods and services, such as housing, clothing, and food. Likewise, the
owners of businesses receiving these payments will use a portion of the proceeds to pay their employees and earn
profits, continuing the cycle. Throughout each of these subsequent rounds of spending, a portion of the direct and
indirect income leaks out of the local economy through federal taxes, payments to non-residents, savings, and
spending outside of the local area. As a result, this diminishes additional impacts on the state economy and its
residents.
Expenditures were disaggregated into 64 major industrial sectors for input into the model. Table 1 displays State Use
Program spending in Texas by sector for 2019. Total direct spending in the state totaled $154.5 million. The largest
expenditure category was payroll and benefits spending, accounting for $75.0 million, or 48.5 percent of total direct
in-state spending. Other notable spending categories include administrative and support services, which reached
$30.9 million in 2019.
See Appendix C for an overview of the model used to generate these results.
4
13Table 1: State Use Program Expenditures in Texas by Industrial Sector, 2019
Sector Direct Expenditures
Payroll and benef its $75,005,614
Administrative and support services $30,910,102
Paper manufacturing $12,981,242
Waste management and remediation services $6,893,260
Food and beverage and tobacco product manufacturing $5,688,964
Chemical manufacturing $5,617,089
Miscellaneous manufacturing $4,167,226
Construction $4,051,709
Apparel, leather, and allied product manufacturing $2,804,772
Plastics and rubber products manufacturing $1,852,285
Other transportation and support activities $1,432,982
Textile mills and textile product mills $767,083
Electrical equipment, appliance, and component manufacturing $417,829
Furniture and related product manufacturing $384,466
Computer and electronic product manufacturing $378,867
Fabricated metal product manufacturing $318,057
Primary metal manufacturing $246,525
Wood product manufacturing $230,859
General merchandise stores $217,524
Machinery manufacturing $75,325
Nonmetallic mineral product manufacturing $68,854
Other services $21,384
Printing and related support activities $5,309
Professional, scientif ic, and technical services $5,249
Other transportation equipment manufacturing $3,064
Data processing, hosting, and other information services $1,836
Performing arts, spectator sports, museums, and related activities $1,333
Total $154 ,54 8 , 811
Summary of Benefits
A total of $75.0 million was directly paid to 7,324 employees5 in the form of payroll and benefits expenditures
related to program activities in 2019. The average pay rate was $12.85 per hour.6 An additional $79.5 million was
disbursed on direct non-payroll expenditures, bringing the total direct output spending to $154.5 million. After these
monetary portions were injected into the state economy, additional income and employment effects were generated
via the indirect and multiplier processes discussed previously.
5
There is a slight disagreement between figures found in the 2019 TWC Annual Report (7,320 total
employees) and WorkQuest’s data (7,324 employees).
This rate excludes benefits.
6
14Table 2 shows that the overall economic benefits of program spending in Texas in 2019 were substantial. The total
impact includes direct, indirect, and multiplier effects. As a result of program operations, output across the state
increased by $304.4 million. The output multiplier, which is calculated by dividing the total output benefit by direct
spending on output by the program, was 1.97. This suggests that for every dollar directly spent by the State Use
Program in Texas, SGDP increased by $1.97.
Table 2: Summary of Economic Benef its of the State Use Program in Texas, 2019
Impact Direct Total
Output (SGDP) $154,548,811 $304,390,336
Income $75,005,614 $167,320,514
Employment 7,324 9,425
Another important measure of economic benefits created by the State Use Program is personal income, which
includes all wages, salaries, profits, interest, rents, and other forms of income earned by residents in the state. This
measure is noteworthy because it reflects gains that accrue directly to Texans. Total income benefits from program
activities totaled $167.3 million in 2019. This number is split into two categories: direct effects, which totaled $75.0
million (44.8 percent) and indirect and multiplier effects, totaling $92.3 million (or 55.2 percent). Among the indirect
effects that arise from program-related purchases of goods and services, $34.2 million (or 20.4 percent) was
generated from payroll and benefits and $58.1 million (or 34.7 percent) was created from non-payroll spending.
Table 3 and Figure 2 summarize these benefits.
Table 3: State Use Program Income Benef it by Source, 2019
Direct Effects
Payroll & Benef its Spending $75,005,614
Indirect & Multiplier Effects
Payroll & Benef its Spending $34,172,558
Non-payroll Spending $58,142,342
Total Income Benefit $167, 320,514
15Figure 2: State Use Program Income
Benefit by Source, FY19
The implicit multiplier associated
with income benefits, calculated
by dividing the total income benefit
by direct spending on payroll and
benefits, is 2.23 for 2019. In other
words, for every dollar the program
spent on wages, salaries, and
benefits, $2.23 was created in total
income in the state.
Table 4 summarizes the direct
employment figures by CRP for
2019. There are 106 CRPs included
in this analysis, with direct employment totaling 7,324. Goodwill Temporary Services, Inc. employed the most workers at
689, while Peak Performers had the second most employees at 533. These two CRPs combined to account for 16.7
percent of all program employment. The total employment benefit of State Use Program expenditures in 2019 was
9,425. In addition to the 7,324 direct hires, 2,101 jobs were created indirectly and through the multiplier effect,
accounting for 22.3 percent of the overall employment impact. The employment multiplier for program operations in
2019 is 1.29. This suggests that for every job directly created by the program, an additional 1.29 jobs were supported
across the Texas economy.
Table 4: State Use Program Employment Benef it in Texas by CRP, 2019
Community Rehabilitation Program (CRP) Employees
Goodwill Temporary Services, Inc. - Temporary Services 689
Peak Performers - St. Vincent DePaul Rehabilitation Service of Texas, Inc. 533
Texas House - Texas Alcoholism Foundation, Inc. 410
On Our Own Services, Inc. 333
World Technical Services, Inc. 331
Relief Enterprise of Texas, Inc. 327
Lieutenant's House - David & Ivory Ministries, Inc. 257
Goodwill Temporary Services, Inc. - Service Contracts 198
Liberty Proclaimed Ministry 183
Xceed Resources - Border TM Industries, Inc. 176
Easter Seals Central Texas, Inc. 152
Goodwill Industries of Fort Worth - Temporary Services 137
Goodwill Industries of Houston - Temporary Services 132
16Table 4: State Use Program Employment Benef it in Texas by CRP, 2019 cont.
Community Rehabilitation Program (CRP) Employees
Marian Moss Enterprises 132
E.Q.U.I.P. Enterprises, Inc. 130
Work Services Corporation 125
Reliable Facilities Service, Inc. 115
Burke Center 110
San Antonio Lighthouse for the Blind 106
Rucon, Inc. 95
Travis Association for the Blind 82
VRC Industries - Austin State Supported Living Center 74
West Texas Lighthouse for the Blind 69
Rising Star Resource Development 68
Woodcreek Outreach Rehabilitation Development 67
A Lift for Life Outreach Center 65
Southeast Keller Corporation 62
Goodwill Services, Inc. 60
Professional Contract Services, Inc. 60
The EB Foundation 58
Goodwill Industries of South Texas, Inc. 57
The Lighthouse for the Blind of Houston 57
ABG Fulf illment - MHMR of Tarrant County 54
Opportunities for Deserving Individuals, Inc. 53
Goodwill Industries of South Texas, Inc. - Temporary Services 52
Second Chances - Starting Over Again 51
Abilene Goodwill Industries, Inc. 50
Gateway Community Partners, Inc. 48
Goodwill Industries of East Texas, Inc. - Temporary Services 48
Horizon Industries - East Texas Lighthouse for the Blind 47
Oak Creek Day Habilitation/Vocational Center 45
Goodwill Contract Services, Inc. 44
West Texas Centers for MHMR 44
Dallas Lighthouse for the Blind 43
Endeavors Unlimited, Inc. 41
Wilson County IDD Work Center/ Camino Real Community Services 41
Rising Star Resource Development - Temporary Services 40
Fresh Start of Monroe, Inc. 39
Andrews Diversif ied Industries 38
Enterprise Professional Services, Inc. 38
Link Labor and Construction 37
Center for Life Resources/ Janie Clements 35
Maverick County IDD Work Center/ Camino Real Community Services 35
Camp County Developmentally Disabled 34
Atascosa County IDD Work Center/ Camino Real Community Services 33
Austin Task, Inc. 33
Woods Etc.- Corpus Christi State Supported Living Center 32
17Table 4: State Use Program Employment Benef it in Texas by CRP, 2019 cont.
Community Rehabilitation Program (CRP) Employees
I Am Works Association 31
Permian Basin Community Centers for MHMR - Midland Vocational Services 31
RGR Industries, Inc. 31
Bootstraps Occupation Services, Inc. 30
Cen-Tex Association for Remarkable Citizens 29
Goodwill Industries of East Texas, Inc. 29
Goodwill Services, Inc. - Temporary Services 29
Dimmit/Zavala County IDD Work Center/ Camino Real Community Services 27
Tex-Spice - Medina County Shelter Workshop, Inc. 26
Aldersgate Enrichment Center 25
EXPANCO, Inc. 24
Goodwill Industries of Dallas, Inc. 24
Bluebonnet Trails Community MHMR Center 23
Center for Recovery and Wellness Resources 23
South Texas Lighthouse for the Blind 23
Heart of Texas Goodwill - Temporary Services 22
StarCare Specialty Health System, StarAbilities - Lubbock Regional MHMR 22
G & H EQUITAS Foundation 21
Frio County IDD Work Center/ Camino Real Community Services 20
Lighthouse for the Blind of Fort Worth - Tarrant County Association for the Blind 20
Goodwill Industries of Lubbock Contract Services 19
Precious Gems Services, Inc. 19
San Antonio State Supported Living Center 18
Beaumont Products and Services 17
Redirection Opportunities 16
Vocational Opportunity Center of Northeast Texas, Inc. 16
SDR & Associates, Inc. 15
Texana Center 15
Beacon Lighthouse, Inc. 14
Lending Helping Hands To Others 14
Junction Five-O-Five 13
Nueces Center for Mental Health & Intellectual Disab. /MHMR of Nueces County 13
Achieve - Citizens Development Center 11
Goodwill Industries of Central East Texas - Temporary Services 11
Goodwill Industries of Dallas, Inc. - Temporary Services 11
Upper Valley Helpsource, Inc. 11
Southeast Vocational Alliance 10
Spindletop Center 10
Goodwill Industries of San Antonio Contract Services, Inc. - Temporary Services 9
Daniel Pest Control and Professional Services - St. Dominic of Silos Rehab. 7
Goodwill Industries of Central East Texas 6
NBT Public Services Inc. 6
Goodwill Industries of Northeast Texas 5
Goodwill Industries of Northeast Texas - Temporary Services 5
ReadyOne Industries 5
18Table 4: State Use Program Employment Benef it in Texas by CRP, 2019 cont.
Community Rehabilitation Program (CRP) Employees
Xtra Spark Cleaning Services 5
D&D Helping Others, Inc. 4
ODJ, Inc. 3
Worship Anointed Ministries 1
Total Direct Employment 7,324
State Use Program spending also created a significant amount of state and local sales tax revenue in 2019, which
is highlighted in Table 5. The state sales tax rate is 6.25 percent, and the average local sales tax rate for the state is
1.94 percent. More than $7.5 million was paid in sales taxes in Texas from program expenditures. Of this amount,
$3.4 million (44.8 percent) was generated from direct expenditures and $4.2 million (55.2 percent) was generated from
indirect and multiplier effects of those expenditures. Most of this revenue went to the state government (76.3 percent),
but a sizeable portion – the remaining 23.7 percent – was contributed to local governments across the state.
Table 5: Summary of Sales Tax Benef its of the State Use Program in Texas, 2019
Impact Direct Total
State $2,578,318 $5,751,643
Local $800,310 $1,785,310
Total $3,378,628 $7,536,953
It is important to note that program-related activities also offer other fiscal benefits for state and local governments
such as property tax revenue, business tax revenue, and payments-in-lieu-of-taxes. For example, program employees
pay taxes on their homes, just as other businesses contribute to the property tax base. Since the analysis in this
study only considers sales tax revenue generated by the State Use Program, the total fiscal benefits to Texas are
understated.
III. Output, Income, Job, and Sales Tax Benefits of the State
Use Program in Texas for 2020
Similar to the above analysis, estimates of the economic benefits of the program are based on FY2020 (hereafter,
“2020”) spending figures from four types of contracts: services, statewide services, temporary services, and products.
The economic impact model and methods utilized here function the same way as those for 2019 described above.
State and local tax rates come from the Tax Foundation: https://taxfoundation.org/state/texas/.
7
19Table 6 shows the overall economic benefits of the program on the Texas economy in 2020. As a result of program
operations, direct output produced was $150.9 million, income totaled $73.9 million, and employment was 6,865.
Fiscal year 2020 saw a decrease across all three impact categories when compared to 2019. This is due, in large
part, to COVID-19: the Texas economy experienced the “steepest and fastest” decrease in economic activity in recent
history due to the pandemic.8 In April 2020, Texas’ unemployment rate reached 12.9 percent, the highest it had been
in the past several decades.9 According to the Federal Reserve Bank of St. Louis, the Texas economy, measured by
SGDP, contracted by 4.7 percent from 2019 to 2020.10
Table 6: Summary of Economic Benef its of the State Use Program in Texas, 2020
Impact Direct Total
Output (SGDP) $150,891,749 $296,632,846
Income $73,894,974 $162,756,691
Employment 6,865 8,873
The program saw a decrease in output but proportionally a smaller one than the state’s economy; in 2020 total program
output decreased by just 2.5 percent relative to 2019. Total income generated by the program amounted to $162.8 million
in 2020, a 2.7 percent decrease compared to 2019. The program’s total employment impact fell by 5.9 percent – to 8,873
jobs in 2020 from 9,425 in 2019.
State Use Program expenditures created 2.7 percent less in state and local sales tax revenue in 2020 than the prior year,
which is highlighted in Table 7. Over $7.3 million was paid in total sales taxes in Texas from spending caused by program
expenditures. Of this amount, $3.3 million or 45.4 percent was generated from direct expenditures made in the state and
$4.0 million was generated from indirect and multiplier effects. Similar to 2019, most of the revenue went to the state
government. Again, because the multiplier analysis only considers sales tax revenue generated by the program, the total
fiscal benefits to Texas are understated. Additional estimates of these benefits are discussed in the next section.
Table 7: Summary of Sales Tax Benef its of the State Use Program in Texas, 2020
Impact Direct Total
State $2,540,140 $5,594,761
Local $788,459 $1,736,614
Total $3,328,599 $7,331,375
8
Information derived from the Federal Reserve Bank of Dallas:
https://www.dallasfed.org/research/swe/2020/swe2003/swe2003c.aspx.
9
Unemployment rate data come from the Federal Reserve Bank of St. Louis: https://fred.stlouisfed.org/series/TXUR.
10
Texas state gross domestic product data originated from the Federal Reserve Bank of St. Louis: https://fred.stlouisfed.org/
series/TXNGSP#0.
20COVID-19 Pandemic and its Effects
In response to a request for an assessment of the impact the COVID-19 pandemic has had on the State Use
Program, WorkQuest staff submitted a detailed narrative, which is included in its entirety as Appendix B. Below,
in the Program Performance, Effectiveness, and Assessment section, a review of various metrics suggests that
while certain aspects of CRP operations were undoubtedly affected (for example, on-site training and professional
development provided by WorkQuest to CRP staff), the program managed to weather the storm and even improve
along several dimensions of performance.
Impact on Federal and State Tax Revenues and Public Assistance
Federal Taxes and Earned Income Tax Credit
Generally, people with disabilities employed through CRPs will have no federal income tax liabilities due to not
earning sufficient levels of income. In 2019, the minimum annual income level that would cause one to owe federal
taxes was $12,200, and in 2020 it was $12,400.
Additionally, CRPs are not required to pay federal unemployment insurance (UI) due to their status as not-for-profit
entities. Therefore, no UI withholding from employees’ paychecks is done. Further, the Earned Income Tax Credit
(EITC) provision of the tax code allows low-to-moderate income earners to receive a refundable tax credit. The
EITC is intended as a measure to promote and support work, and is one of the leading and most effective tools in
the fight against poverty.
For 2019, the average annual income for people with disabilities employed through the State Use Program was
$8,441.11 For 2020, this figure rose to $9,280. The maximum amounts of EITC that an individual earning these
amounts and with no qualifying children for 2019 and 2020 are, respectively, $529 and $538. Given that there were
5,804 such workers in 2019, the total amount of EITC that could have been received is $3,070,316. In 2020, there
were 5,475 such individuals working in the program, so the total amount of tax credit received could have been
$2,945,550.
It is important to note that the amounts above are “wages and benefits,” so they may somewhat overstate the true
earned income amounts. Also, the individual amount of EITC depends heavily on one’s personal earnings, marital
status, number of children,12 and whether the individual is claimed as a dependent by others.
Nonetheless, the amounts estimated above represent a net inflow of federal dollars into Texas, and therefore
contribute to the program’s economic impact on the state’s economy.
11
Calculated using the total number of Texans with disabilities in the program and total amount of wages and benefits paid
to people with disabilities.
12
If a worker has a qualified child, their credit amount increases from $529 to $3,526 for 2019 and from $538 to $3,584 in
2020. No detailed data are available on workers’ families, but this aspect would substantially increase benefits to workers.
21On the other hand, employment of people through the program spurs additional economic activity outside of the state
through additional federal tax revenue generated. Given that the Social Security tax rate in both 2019 and 2020 was 6.20
percent, and the Medicare tax rate was 1.45 percent, for a combined rate of 7.65 percent, and workers’ annual wages
(and benefits) in 2019 of $48,994,181, the additional federal tax revenue generated equals $3,748,055. Given annual
wages (and benefits) in 2020 of $50,806,443, the additional federal tax revenue generated equals $3,886,693.
While non-profits are not required to pay federal unemployment insurance taxes, CRPs do have to comply with state UI
regulations. In particular, during certification, CRPs in Texas are required to
“maintain compliance with requirements […] related to Unemployment Insurance tax, wage claims, state licensing,
regulatory, and tax requirements. Failure to maintain compliance shall result in revocation of the CRP's certification […];”13
In Texas, the UI taxable wage base was $9,000 in 2019, and new companies were subject to a minimum tax rate of 2.7
percent, while the average tax rate for existing companies was 1.25 percent in 2019.
Using the above information, the CRPs generated between $612,427 and $1,322,843 in additional state tax revenue in
2019.14
Reduced Reliance on Public Assistance
A significant consequence of individuals being employed by CRPs on State Use Program contracts is the reduced
burden on the state and federal public assistance programs: people with disabilities earning income that they otherwise
would not be able to earn often means less need for support.
While it is difficult to estimate the extent to which employment of people with disabilities at CRPs lightens the burden on the
public sector in aggregate – many factors at the individual level determine whether and how much public assistance each
person continues to qualify for, the following informal feedback was received from several CRPs.
Program employees generally earn competitive wages, with the average hourly wage in 2021 being over
$15. Because of these wages, many employees would no longer qualify for WIC, Food stamps (SNAP),
TANF (for families), Medicaid/CHIP or any other state-funded programs or dollars that are allocated to
private contracts (free clinics, assistance networks, etc.) simply due to their income exceeding the set
threshold(s).
Some CRPs offer benefits to employees, in which case they would not be relying on government-funded
programs assisting with meeting medical, dental, vision, life/disability or retirement expenses.
13
40 Tex. Admin. Code § 806.41 (2017).
14
https://www.twc.texas.gov/businesses/unemployment-insurance-tax-rates.
22Finally, because many employees in the program are no longer eligible for Vocational Rehabilitation (TWC-
VR) services, TWC would not have to allocate resources or funds towards the Vocational Services to
assist these individuals in finding employment or job training. A number of CRPs provide these services
free of charge to individuals in their service area as well.
A possible downside to the above described prospect of reduction in benefits facing many employees is that it is not
uncommon to see “bunching” of workers’ wages just under the $15 hourly level – or whatever threshold may make
them ineligible for certain public benefits. While no definitive data on this phenomenon exist, it is anecdotally confirmed
as having occurred, though this issue is not unique to the CRPs, the State Use Program or even employment of people
with disabilities generally.
The following discussion presents several scenarios, based on stated assumptions, in an attempt to calculate a range of
estimates of potential savings that can be attributed to the program.
Temporary Assistance for Needy Families (TANF)
Through TANF, a state-funded program designed to support low-income households with children under the
age of 18, families can receive payments for up to 60 months (five years). A family of two adults and one child earning
less than $188 a month would qualify for TANF and can receive monthly payments of $312.
The average monthly salary of people with disabilities working in the State Use Program in 2019 was $703,
meaning the majority would not qualify for TANF as a direct result of their employment.
Because no data on the number or proportion of people with disabilities earning less than certain wage thresholds
nor data on family sizes of those workers are available, some assumptions must be made.
For example, if one-quarter of the 5,804 employees with disabilities no longer receive TANF, the savings would
total $452,712. If, instead, one-half of them no longer qualify, the savings would be $905,424, and if 75 percent were
to “wage-out,” the payments from TANF would be reduced by $1,358,136.
These amounts would be larger if a typical family is assumed to have five people (two adults and three children):
the savings would range from $644,244 to $1,932,732.
Therefore, while a precise estimate is impossible to produce, a reasonable approximate range of savings to
state finances from lower TANF payouts is between about $450,000 and $2 million, with the higher end of this
range more likely.
23Supplemental Nutrition Assistance Program (SNAP)
The initiative, formerly known as “food stamps,” is federally funded and administered by the state, with the
cost of administration split evenly between state and federal funds. Nationally, about one-third of SNAP
recipients reside in a household with seniors or people with disabilities.
To qualify, a family of three must earn less than $3,020 per month, with the amount of benefit not fixed but
phased out at higher incomes. The maximum amount of monthly benefit for a three-person household is
$658; the average benefit paid out is $520.15
Because of a lack of precise data on individual’s exact wages, household size and program participation, the
following assumptions are made:
1. One half of all State Use Program employed workers rely less on SNAP than they would in
the absence of the program;
2. People whose reliance on SNAP is reduced, move from receiving the maximum benefit to
receiving the mean (average) benefit;
3. If an individual qualifies for SNAP, they are assumed to participate and receive the benefit.
In other words, if 50 percent of the 5,804 workers begin to receive $520 rather than $658 monthly, the
total savings from SNAP would amount to $536,638. These are savings to a federally funded program, so
direct savings to Texas may be rather small and stem primarily from lower administration costs (from fewer
participants).
Children’s Medicaid and CHIP
Children’s Medicaid covers healthcare costs for children from low-income households, while Children’s Health
Insurance Program (CHIP) covers healthcare costs for those who earn too much to receive Children’s Medicaid.
Both programs are state-funded but matched with federal dollars.
Older individuals and those with disabilities make up about 25 percent of Medicaid cases but require about 61
percent of all Medicaid spending.16 People with disabilities can qualify for Medicaid if they qualify for Supplemental
Security Income (SSI). As their incomes increase, recipients of CHIP must contribute more to copays and other
costs of care.
An additional program, STAR+PLUS, covers Texans over the age of 21 with disabilities or special needs. The
program provides basic medical services and long-term services and support; most children with disabilities who
receive Medicaid transition to STAR+PLUS when they turn 21. Currently, a family of three must earn less than
$2,434 monthly to qualify for Children’s Medicaid and no more than $3,679 to qualify for CHIP.
15
https://www.cbpp.org/research/food-assistance/a-quick-guide-to-snap-eligibility-and-benefits.
16
Texas Medicaid and CHIP Reference Guide, 13th ed., 2020, Texas Health and Human Services Commission.
24Average annual per capita spending by Medicaid on children in Texas is $3,885; for people with disabilities
this amount is much higher at $27,600 annually.17
As was the case with other programs described above, it is difficult to obtain estimates of savings without
data on individual income levels, household sizes, and healthcare needs. However, there are two potential
sources of savings that can be at least roughly approximated:
1. Workers earning enough through their employment in the State Use Program to no longer
qualify for Medicaid or CHIP or to at least have to contribute to covering costs of their care;
2. Workers who receive medical coverage provided by CRPs and are no longer using Medicaid,
CHIP or STAR+PLUS.
The first category of workers is likely small in number (because income qualification thresholds are quite high
relative to wages earned by people with disabilities) but still produces large savings. Assuming that only two
percent of the 5,804 people employed in the State Use Program in 2019 earn too much to continue receiving
Medicaid and CHIP benefits, the reduction in payments produced would be $3,203,808, of which half or
$1,601,904 would be savings for Texas.
The second category in 2019 had 788 people with disabilities whom CRPs provided with medical benefits.
Assuming that only half of these individuals qualified for Medicaid/CHIP/STAR+PLUS and no longer need it, the
total savings would be $10,874,400, half of which or $5,437,200 is Texas’ share.
While these estimates are inherently uncertain, even under the most conservative assumptions, the savings
to the state from lower medical and healthcare expenditures on individuals employed through the State Use
Program are substantial.
Special Supplemental Nutrition Program for Women, Infants, and Children (WIC)
A program designed to improve the health of nutritionally at-risk pregnant women, new mothers, infants and
children under age five by providing healthy foods, nutrition education, and access to basic health services,
WIC is fully funded by the federal government. The savings arising from removing workers from this program
are likely small, as the typical monthly benefit is $26.45 per person.18 Nonetheless, it represents a reduced
need for public assistance for individuals who gain greater independence and self-sufficiency.
17
https://www.medicaid.gov/state-overviews/scorecard/how-much-states-spend-per-medicaid-enrollee/index.html.
18
https://fns-prod.azureedge.net/sites/default/files/resource-files/25wifyavgfd$-10.pdf.
25Non-pecuniary Benefits
The above estimates, even when imprecise, are directly quantifiable – i.e., they represent real savings of
taxpayer dollars, either at the state or federal level. However, many other benefits are nonmonetary or cannot
be easily assigned a dollar value. Below is a summary of two aspects of working that generate sizable non-
pecuniary benefits for the employed individuals.
Benefits of Employment
Unemployment among individuals with disabilities can be especially painful since it can amplify feeling of
isolation and result in a greater disconnect from society as a whole. Employment provides a variety of
benefits beyond helping individuals with disabilities move out of poverty; it can provide: a routine to everyday
life, exposure to new and differing people, and meaningful daily activities that allow workers to feel like
they are positively contributing to society. The increased feelings of self-worth and purpose are not directly
measurable but represent a benefit to those who may usually feel marginalized in society. There is also
evidence that employment leads to greater civic engagement for people with disabilities, making them more
likely to take part in political activities and to advocate for themselves through the political process.19
Sheltered employment provided by CRPs within the State Use Program can also provide a bridge for many
people with disabilities into competitive integrated employment. While supported employment in privately
owned businesses with appropriate accommodations is ideal it is not always initially practical or preferred by
people with disabilities. Having access to sheltered employment opportunities can be beneficial for those
who are not ready for competitively integrated employment. It can provide work experience, confidence, and
can help in determining the most appropriate work accommodations given the individuals specific disability.
Health Benefits
In addition to direct savings to state funding from less reliance on public support for healthcare expenses
– that is, workers earning income that allows them to self-support rather than rely on the taxpayer funded
support for medical expenses – there is an indirect effect, whereby employment is associated with better
worker health. It is well documented that people who are employed are measurably healthier than those
who are not. The positive health effects of employment are driven by the increased social capital, greater
psychological well-being, and avoidance of the economic hardships that are associated with poverty.20
19
Schur, Lisa. "The difference a job makes: The effects of employment among people with disabilities." Journal
of Economic Issues 36.2 (2002): 339-347.
20
Goodman, Nanette. "The impact of employment on the health status and health care costs of working-age
people with disabilities." LEAD Cent Policy Br (2015).
26Studies have attempted capture the magnitude of the health benefits provided to people with disabilities
from employment with varying degrees of success. One such study found clear evidence that employment
improved health outcomes and lowered health care expenditures by as much as $166,350 over ten years for
those with mental health disabilities. Their findings “suggest that cost savings to the mental health system
for high service users accrue rapidly after the first year and continue to increase for many years. The ten-year
cost reduction appears to be dramatic, certainly enough to justify offering supported employment to all
persons who use high levels of services and express interest in working.”21
Impact on Minority Owned or Operated Businesses
Minority owned businesses in Texas, as defined by the Texas Small Business Administration (SBA), are
businesses with 51 percent or more of the ownership interest held by a member of a “socially disadvantaged
group.” The latter category includes individuals who identify as Black, Hispanic, Native American, Asian
Pacific, or Subcontinent Asian. These businesses are eligible for the Minority-Owned Business Certification;
other certifications made available by the Texas SBA include Woman Owned Business Certification, Veteran
Owned Business Certification, and LGBT Owned Business Certification, among others.
In 2020, approximately 16.4 percent of US small businesses were minority owned. For Texas, this proportion
is considerably higher, at over 25 percent.22 This ranks Texas 4th among all states in proportion of small
businesses owned by minorities.23
CRPs operating within the State Use Program are either private non-profit corporations or government (i.e.,
public) entities. Therefore, they are not owned by any one individual. However, data on minority managed
and operated CRPs indicates that in 2019, 37 percent of CRPs were managed by members of racial
minority groups; 35 percent were managed by women, and three percent were managed by individuals with
disabilities.
It is evident that a significantly larger proportion of CRPs are managed or operated by members of socially
disadvantaged groups than is the case for the state and especially the US broadly. Moreover, many if
not all businesses and organizations (CRPs) would likely not exist if not for the State Use Program and its
provisions, whereby the output of these businesses is assured to have a steady demand.
21
Bush, P. W., Drake, R. E., Xie, H., McHugo, G. J., & Haslett, W. R. (2009). The long-term impact of employment
on mental health service use and costs for persons with severe mental illness. Psychiatric Services, 60(8),
1024-1031.
22
“2020 Small Business Profile”, Office of Advocacy, US Small Business Administration.
23
https://patch.com/texas/downtownaustin/texas-among-best-small-business-diversity-report.
27You can also read