ECONOMIC CURRENTS - Grant Thornton
←
→
Page content transcription
If your browser does not render page correctly, please read the page content below
ECONOMIC CURRENTS
January 04, 2022

Omicron and the Economy:
Two Scenarios
Diane C. Swonk, Chief Economist

Omicron’s spread has underscored one truism: The health
of the economy is ultimately dependent upon the health       Boom/Bust
of the population. The more people who are ill due to
                                                             Real GDP is expected to end 2021 on a high note with
COVID, the harder it is to keep the economy operating.
                                                             growth of 6.7% in the fourth quarter; growth for all
Fear of contagion and an aversion to in-person events        of 2021 is estimated to average 5.7%. That marks the
is no longer the primary driver of economic losses. We       fastest pace of growth since 1984.
now face acute worker shortages that will prompt some
                                                             The economy was firing on all cylinders before the
venues to close for a period of time.
                                                             onset of Omicron. Consumer spending picked up
                                                             as travel and tourism returned and the Delta wave
The spread has been so fast and is affecting so many         abated. Home buyers scrambled to lock in low
people that the number of those out sick will be a hurdle    rates and investors snapped up properties to rent.
to growth in the first quarter. The slowdown could be        Supply chain bottlenecks eased, business investment
                                                             accelerated and inventories finally started to rebuild.
much more pronounced and broad-based than we saw
during the Delta wave over the summer.                       The only negatives were government spending
                                                             and trade. State and local government spending
It is hard to imagine a sector that will be unaffected by    essentially flatlined, while federal spending
                                                             plummeted with the end of supplements to
staffing shortages. Thousands of flights have already
                                                             unemployment insurance. The trade deficit widened,
been canceled. Restaurants are closing. Fire departments     as imports picked up more rapidly than exports. Much
don’t have enough workers to respond to emergencies in       of what we imported ended up in inventories.
hot spots. State and local government offices are closing.
                                                             Prospects for the first quarter are significantly
Many school districts have delayed reopening to ensure
                                                             weaker. Our baseline is for 1.5% growth, which is a
students get negative tests. They will face challenges       bit slower than we saw during the Delta wave in the
staying open given staffing shortages and outbreaks.         fourth quarter. Omicron has collided with the Delta
                                                             wave to cause disruptions to demand and supply.
The whole health care system is being overwhelmed. Risk
                                                             Consumer spending is the most vulnerable, but
of hospitalization is smaller with Omicron but the number
                                                             disruptions could extend well beyond the service
of people infected, including children, is pushing up the    sector. Businesses are expected to hesitate on
number of those seeking emergency care. This is at the       executing investment plans until the dust settles.
same time that burnout and resignations have already         Inventories are expected to be drained and the trade
                                                             deficit is expected to widen. Exports fall more rapidly
left many hospitals short of staff.
                                                             than imports as lockdowns abroad are already in
                                                             place. Government spending should rebound but
The CDC’s pivot to shorten quarantines from ten to five      school closures will stunt those gains.
days was a red flag. The sheer number of people likely to
be out sick threatened to hobble the economy.
Supply chains are at risk given the global spread of the Scenario 1
virus. China’s zero tolerance for outbreaks is already
disrupting trade. The push to idle factories to clean the air The Omicron surge is expected to be short-lived and
ahead of the Winter Olympics in Beijing will exacerbate abate quickly; it receded as rapidly as it spread in South
those problems. This is at the same time that tensions Africa. Fear of contagion, coupled with a loss in hours
between China and Taiwan, which has a chokehold on worked, will slow but not derail consumer spending.
computer chips, are escalating. Production is temporarily disrupted. Supply chain
problems will resurface but demand will be weaker than it
The only silver lining is the speed with which Omicron was through the Delta wave last summer.
receded in South Africa. That drop was enhanced by
mitigation efforts and summer weather; we lack both. We Real GDP slows to a 1.5% pace in the first quarter, the
are also struggling with a collision of Delta, Omicron and weakest since the start of the recovery in May 2020:
a surge in other respiratory illnesses, including the flu. • Employment hits a speed bump in January as firms are
forced to idle and schools move back online. Leisure
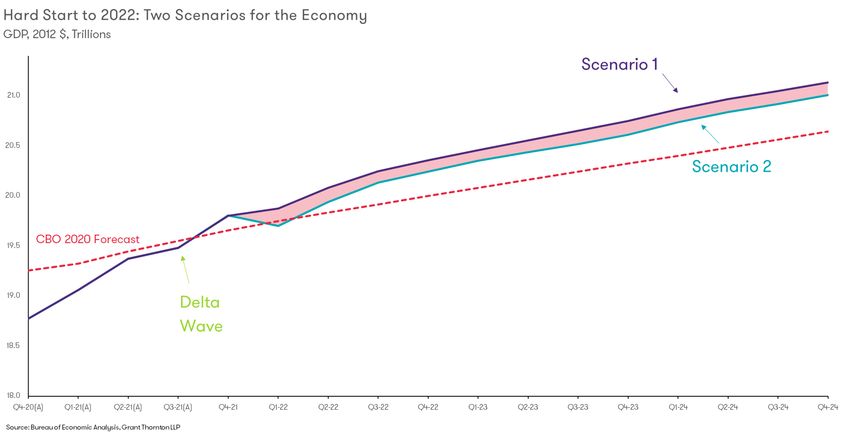
This edition of Economic Currents takes a closer look at and hospitality are hardest hit.
the first quarter and how Omicron could play out. There
• Large online retailers are likely to retain seasonal
are two scenarios. Scenario 1 shows our base case, which
workers to cover for those out ill; they also may
includes a temporary slowdown in consumer spending.
leverage layoffs elsewhere to fill openings.
Scenario 2 shows a more dramatic pullback, as closures
due to staffing shortages and contagion migrate from the • Small and midsize firms lose as idled workers seek
service sector to the broader economy. (See Chart 1.) employment elsewhere.
• Participation in the labor market falls in response to
Neither scenario includes additional stimulus but stranger
fear of contagion, school closures and the need to care
things have happened in election years. The absence of
for ill family members. Women tend to bear the brunt of
fiscal support delineates Omicron from previous waves.
child and elder care.
Chart 1
2 Monthly Economic Outlook: Omicron and the Economy• The upward pressure on wages is not likely to abate, The Fed watches core inflation because overall measures
given the yawning gap between job openings and of inflation tend to converge toward the core over time.
those actually looking for work. Large online retailers The Fed has less control over food and energy prices
are creating a floor for wages, while quit rates hit a (which can swing with changes in the weather) than it
record in November. has on other kinds of inflation.
• Inventories will be drained but not to the lows we saw
in 2021. Risks: Additional fiscal stimulus would likely keep prices
elevated for longer. Stimulus checks are more immediate
Real GDP is expected to rebound at a 4.2% pace in the but not well targeted and tend to fuel price hikes; they
second quarter. Growth for 2022 is expected to average are quickly spent and could exacerbate shortages in the
3.7%, a half percentage point weaker than we were goods sector.
expecting a month ago, but well above the tepid 2.3%
Fed Executes on Rate Hikes
annual rate in the decade leading up to the pandemic.
The Federal Reserve has concluded that variants are
Risks: The Congressional Budget Office’s scoring of the
more inflationary than disinflationary. The disruptions
most recent iteration of the administration’s plan gets
to supply have been greater than the disruptions to
the economy back to the growth path we were on pre-
demand, thus far. That may not be the case now that the
Omicron in 2022. Emergency aid via stimulus checks
fiscal stimulus has lapsed. The slowdown in inflation that
would more rapidly blunt the blow of Omicron. Spending
we have forecast is still too little too late to hold off rate
on goods would pick up more than spending on services.
hikes by the Fed.
The hardest part to tackle is lifelines for small businesses.
New Peak for Inflation That said, the Fed is expected to wait for the pace of
infections to abate before it attempts a liftoff in rates.
The core personal consumption expenditures (PCE) Our forecast for three rate hikes in 2022 has not changed.
index, which takes out the volatile food and energy An additional four rate hikes are expected in 2023, as long
components, is expected to rise 4.6% from a year ago in as the Fed doesn’t panic on overheating. The Fed has
the first quarter. That is cooler than we expected a month become more hawkish regarding inflation.
ago, but still the highest quarterly rate since 1989:
Risks: Fiscal stimulus that is short-lived but poorly
• Moderating demand will reverse the upward pressure targeted, such as stimulus checks, could force the Fed to
on airfares, hotel rooms and car rentals. raise rates more rapidly in 2022.
• Trucking costs should fall with lower prices at the gas
pump but driver shortages are likely to remain acute.
• Shelter costs are expected to continue to accelerate.
Investors buying properties sight unseen are pushing
up prices and crowding out first-time buyers.
“Every time it seems we have
A surge in inflation in the spring of 2021 set the stage for a tether to pull us out, the
a moderation in year-over-year measures for the rest of
the year. That does not mean the level of prices will fall; ground beneath us shifts again
rather, the pace at which prices rise will slow. in response to a new wave of
In response, the core PCE index is forecast to drop to a
infections.”
2.5% pace in the fourth quarter. This is still well above
the Federal Reserve’s 2% target. The Fed’s goal is to
get inflation low enough that it doesn’t distort spending
decisions.
3 Monthly Economic Outlook: Omicron and the EconomyScenario 2 Real GDP bounces back at a 4.9% rate in the second
quarter. Growth for the year comes in at 3%, more than
The Omicron wave collides with the Delta wave on a a full percent slower than we expected last month.
global scale. Parts of Europe have followed the CDC and
shortened quarantine times for those infected because Risks: Congress gives in to election-year pressure and
of the threat to economic activity. Outbreaks last longer passes additional stimulus. That fortifies the rebound in
and trigger losses in manufacturing and construction as growth during the remainder of the year.
well as the service sector. Businesses and government
offices are forced to close, mimicking a mandated Inflation Moderates
lockdown.
Chart 2 compares the path of inflation under the two
Real GDP contracts by 2.2% in the first quarter, the first scenarios. The core PCE index peaks sooner and cools
drop since the onset of the recovery: faster in scenario 2:
• Employment drops in January and February and • The contraction acts as a hard stop on the economy,
rebounds in March. derailing some of the upward pressure on inflation in
• Layoffs mount and unemployment rises. both goods and services.
• Participation in the labor market suffers a setback. • Inventories built during the fourth quarter of 2021
provide a buffer to shortages due to idled production.
• Recruiting slows as uncertainty about when and how
fully the economy will reopen escalates. • The exception is shelter costs, which continue to
accelerate.
• Small business failures rise; employment becomes even
more concentrated in large firms. This could amplify Core PCE inflation ends the year close to the Fed’s 2%
the power of large monopsony firms. target. Inflation could cool further in 2023.
• Shortages mount but are partially offset by disruptions
to demand.
Chart 2
4 Monthly Economic Outlook: Omicron and the Economy“The demand for workers is still Fed Delays Rate Hikes
so far above the number of The Fed will put rate hike discussions on ice if the
workers looking for work that economy contracts in the first quarter. Watch for Fed
Chairman Jay Powell to underscore the uncertainty
the upward pressure on wages surrounding the outlook at his press conference following
could persist, even with a the January meeting. He will be walking a tightrope.
He will want to signal patience on rate hikes in the near
setback in employment.” term, while reassuring the Fed will deal with any residual
inflation when the Omicron wave recedes. The Fed is
expected to raise rates twice instead of three times in
2022 and only two more times in 2023.
Risks: Fiscal stimulus could put a floor under how much
inflation cools over the course of 2022. The rebound in Risks: The Fed is put in the hard position of raising rates
demand could amplify surge pricing and exacerbate sooner and faster in the wake of a contraction in growth.
price hikes due to shortages in the goods sector. This underscores the need by Congress to target carefully
any aid it doles out, which is nearly impossible given the
The wild card is the labor market. The demand for workers gaping holes in our safety nets.
is still so far above the number of workers looking for
work that the upward pressure on wages could persist, Bottom Line
even with a setback in employment. This will compress
profit margins and trigger price hikes as firms pass those Forecasting during the pandemic has been akin to
costs onto consumers. The risk of a more sustained and standing in quicksand. Every time it seems we have a
entrenched inflation is still a possibility, even with a hard tether to pull us out, the ground beneath us shifts again in
stop to the economy in the first quarter. response to a new wave of infections. It is exhausting.
The one thing that distinguishes this pandemic from its Hope is in the science that delivered us vaccines,
predecessors has been its impact on inflation. Pandemics treatments and ways to curb infections. The thought that
tend to trigger wage gains because of the blow they one of my next jabs might thwart all variants is especially
deal to labor supply, but not inflation. This time is truly encouraging. The prospect that the pandemic morphs
different. Technology and the shift to working from into an endemic, or something that is less of a threat and
home, combined with massive infusions of fiscal stimulus, more manageable, is still high in 2022. One can dare to
supported demand through repeated waves of infection. dream.
The result was a surge in both wages and prices.
5 Monthly Economic Outlook: Omicron and the EconomyEconomic forecast — January 2022
2021 2022 2023 2021:3(A) 2021:4(E) 2022:1 2022:2 2022:3 2022:4 2023:1 2023:2 2023:3
National Outlook
Chain-Weight GDP1 5.7 3.7 2.3 2.3 6.7 1.5 4.2 3.4 2.2 2.0 1.9 1.9
Personal Consumption 8.0 3.2 2.2 2.0 4.9 1.3 3.2 2.3 2.0 2.0 2.3 2.2
Business Fixed Investment 7.4 5.1 4.0 1.7 3.1 7.0 5.8 5.6 4.1 3.7 3.5 3.4
Residential Investment 9.1 -3.6 -3.8 -7.7 0.1 -1.5 -4.4 -3.5 -3.9 -4.6 -3.8 -3.0
Inventory Investment (bil $ ‘12) -55 111 118 -67 103 62 110 135 136 137 124 112
Net Exports (bil $ ‘12) -1272 -1306 -1297 -1308 -1324 -1312 -1308 -1301 -1303 -1300 -1299 -1294
Exports 4.0 5.3 7.8 -5.3 13.3 -0.3 7.8 9.7 8.8 8.4 6.9 6.3
Imports 13.5 4.4 4.8 4.7 10.1 -1.5 4.5 5.3 5.9 5.2 4.4 3.6
Government Expenditures 0.5 0.9 1.6 0.9 -2.1 2.1 1.9 2.8 2.0 1.3 1.2 1.0
Federal 0.6 -1.6 -0.1 -5.1 -4.5 1.9 -0.8 0.2 -1.2 0.1 0.3 0.1
State and Local 0.5 2.5 2.6 4.9 -0.6 2.2 3.6 4.5 4.0 2.0 1.6 1.5
Final Sales 5.4 2.8 2.3 0.1 3.3 2.3 3.2 2.9 2.2 2.0 2.2 2.1
Inflation
GDP Deflator 4.2 3.8 2.0 5.9 6.9 2.5 2.5 1.9 1.9 2.2 1.8 2.1
CPI 4.7 3.9 2.1 6.6 8.0 0.4 3.3 2.0 2.1 2.1 1.7 2.0
Core CPI 3.6 3.9 2.2 5.3 5.1 3.4 2.7 2.4 2.2 2.1 2.2 2.2
Special Indicators
Corporate Profits2 14.1 0.2 -0.7 19.7 14.1 6.9 -1.0 -3.7 0.2 1.3 -1.3 -1.9
Disposable Personal Income 2.1 -3.6 2.6 -4.3 -6.6 -2.1 2.3 3.3 1.5 3.0 2.7 2.5
Housing Starts (mil.) 1.59 1.47 1.34 1.56 1.60 1.53 1.49 1.44 1.41 1.37 1.35 1.33
Civilian Unemployment Rate 5.4 3.7 3.5 5.1 4.3 4.1 3.8 3.6 3.4 3.4 3.5 3.5
Total Nonfarm Payrolls (thous.)3 5151 957 400 1694 1761 872 1230 961 766 825 498 238
Vehicle Sales
Automobile Sales (mil.) 3.4 3.8 4.0 3.1 2.7 3.1 3.7 4.1 4.1 4.2 4.0 3.9
Domestic 2.2 2.4 2.5 2.0 1.8 2.0 2.4 2.6 2.6 2.6 2.5 2.5
Imports 1.1 1.4 1.5 1.1 0.9 1.1 1.3 1.5 1.5 1.6 1.5 1.4
Lt. Trucks (mil.) 11.7 11.7 12.6 10.3 10.5 10.7 11.7 12.1 12.3 12.5 12.7 12.6
Domestic 9.1 9.1 9.7 7.8 8.2 8.4 9.2 9.4 9.5 9.6 9.7 9.7
Imports 2.7 2.6 2.9 2.5 2.3 2.3 2.5 2.7 2.8 2.9 3.0 2.9
Combined Auto/Lt.Truck 15.1 15.5 16.6 13.3 13.2 13.8 15.4 16.2 16.4 16.7 16.7 16.5
Heavy Truck Sales 0.5 0.5 0.4 0.4 0.5 0.5 0.5 0.5 0.5 0.4 0.4 0.4
Total Vehicles (mil.) 15.6 16.0 17.0 13.8 13.7 14.3 15.9 16.7 16.9 17.1 17.1 16.9
Interest Rate/Yields
Federal Funds 0.1 0.4 1.3 0.1 0.1 0.1 0.2 0.4 0.8 0.9 1.2 1.4
10-Year Treasury Note 1.4 1.7 2.3 1.3 1.5 1.5 1.6 1.7 1.9 2.1 2.2 2.4
Corporate Bond BAA 3.5 3.6 4.3 3.3 3.4 3.4 3.6 3.7 3.9 4.0 4.2 4.4
Exchange Rates
Dollar/Euro 1.18 1.15 1.19 1.18 1.14 1.13 1.14 1.15 1.17 1.18 1.19 1.20
Yen/Dollar 109.8 113.0 110.4 110.1 113.6 113.6 113.2 112.7 112.2 111.5 110.7 110.0
1.
in 2021, GDP was $19.4 trillion in chain-weighted 2012 dollars.
2.
Corporate profits before tax with inventory valuation and capital consumption adjustments, quarterly data represents four-quarter percent change.
3.
Total nonfarm payrolls, quarterly data represents the difference in the average from the previous period. Annual data represents 4Q to 4Q change.
Quarterly data are seasonally adjusted at an annual rate. Unless otherwise specified, $ figures reflect adjustment for inflation. Total may not add up due to rounding.
Copyright © 2021 Diane Swonk – All rights reserved. The information provided herein is believed to be obtained from sources deemed to be accurate, timely and reliable. However, no assurance is
given in that respect. The reader should not rely on this information in making economic, financial, investment or any other decisions. This communication does not constitute an offer or solicitation, or
solicitation of any offer to buy or sell any security, investment or other product. Likewise, this communication serves to provide certain opinions on current market conditions, economic policy or trends
and is not a recommendation to engage in, or refrain from engaging, in a particular course of action.
“Grant Thornton” refers to Grant Thornton LLP, the U.S. member firm of Grant Thornton International Ltd (GTIL), and/or refers to the brand under which the GTIL member firms provide audit, tax and
advisory services to their clients, as the context requires. GTIL and each of its member firms are separate legal entities and are not a worldwide partnership. GTIL does not provide services to clients.
Services are delivered by the member firms in their respective countries. GTIL and its member firms are not agents of, and do not obligate, one another and are not liable for one another’s acts or
omissions. In the United States, visit grantthornton.com for details.
© 2021 Grant Thornton LLP | All rights reserved | U.S. member firm of Grant Thornton International Ltd
6 Monthly Economic Outlook: Omicron and the EconomyrYou can also read