Economic and Carbon Impacts of Potential Illinois Nuclear Plant Closures
←
→
Page content transcription
If your browser does not render page correctly, please read the page content below

Economic and Carbon
                                Impacts of Potential
                              Illinois Nuclear Plant
                                           Closures
                                                      The Cost of Closures

                                                       Prepared by:
 Prepared for:                                 Samuel G. D OTSON
 N UCLEAR M ATTERS                          Amanda M. B ACHMANN
                                                   Zoë R. R ICHTER
 Principal Investigators:                      Nataly R. PANCZYK
 Prof. Kathryn D. H UFF                           Nathan S. RYAN
 Dr. Madicken M UNK                                Anna C. B ALLA
                                                 Erin R. FANNING

                 UIUC-ARFC-2021-02
                             May 6, 2021

 A DVANCED R EACTORS AND F UEL C YCLES
D EPT.   OF N UCLEAR , P LASMA , & R ADIOLOGICAL E NGINEERING
         U NIVERSITY OF I LLIOIS AT U RBANA -C HAMPAIGN

 This research was performed using funding received from Nuclear Matters.
1    Summary
On August 27, 2020, Exelon Generation announced planned premature clo-
sures of two Illinois nuclear plants (4 reactor units), which compete eco-
nomically with fossil fueled plants within the Pennsylvania-New Jersey-
Maryland (PJM) interconnection [1]. This report quantitatively explores
how these closures would undermine economic and decarbonization goals
in the state of Illinois, such as an aggressive target to achieve a zero carbon
electric grid by 2030.
    Previous energy systems research has shown that such clean energy
goals cannot be reached if nuclear plants prematurely retire [2, 3, 4]. In
particular, the February 2021 National Academy of Sciences, Engineering,
and Medicine consensus report, “Accelerating Decarbonization of the U.S.
Energy System,” determined unequivocally that U.S. decarbonization will
require keeping existing nuclear plants open [2]. Consistent with that liter-
ature, our simulations indicate that decarbonization in Illinois will require
not only maintenance but expansion of nuclear energy capacity. The simu-
lations in this report minimize future Illinois electric system cost in the
context of potential policy constraints and demonstrate that:

    • nuclear energy is necessary to reach Illinois’ carbon reduction goals;

    • without existing nuclear power, reaching zero carbon would require
      solar deployments to displace 10, 000km2 of critical Illinois farmland;

    • and deploying new advanced nuclear generation is the least expen-
      sive way to allow Illinois farmland to remain farmland while reach-
      ing zero-carbon by 2030.

   These simulations also revealed many specific, complementary con-
clusions, such as:

    • Keeping Illinois’ existing nuclear plants open through 2050 avoids
      25 million metric tons of life-cycle CO2 emissions and 600,000 metric
      tons of e-waste.

    • Even if advanced nuclear deployments experienced 200% capital cost
      overruns, total system cost impacts would be negligible.

    • Deploying advanced nuclear avoids approximately 900,000 metric tons
      of e-waste.

                                      1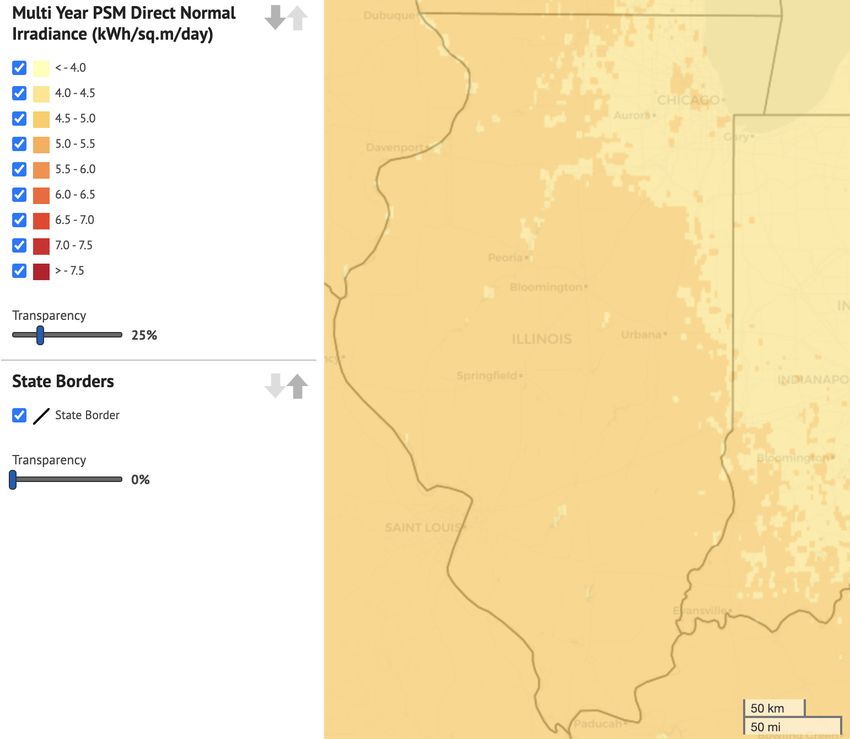
• Extraordinary, possibly infeasible, grid-scale battery storage capacity
      is required to meet any zero-carbon target with significant renewable
      penetration.

2    Introduction
Eleven (11) emissions-free nuclear reactors at six (6) sites produce the ma-
jority of electricity in Illinois and critically underpin its clean energy future.
Four (4) of these reactors, representing over 4GWe of electric capacity, are
at the Byron and Dresden plants, which face premature closure. This report
quantitatively demonstrates the role nuclear energy must play in minimiz-
ing cost while meeting Illinois’ carbon goals through 2050, with a particular
focus on those plants.
     We have modeled the Illinois electric grid and conducted optimization
simulations of key policy scenarios. These simulations establish the least
costly energy generation mixtures with and without the at-risk plants in the
context of various policy factors, such as zero-emissions targets. With these
solutions, we compared the economic and carbon implications of these en-
ergy futures. In addition to emissions, this report also considers other envi-
ronmental impacts of available energy choices, such as land use and solid
waste generation. Other recent work has reviewed the potential health im-
pacts of these closures [5].
     We built a computational model of Illinois’ electric system that lever-
ages high fidelity data from a variety of sources to explore various poten-
tial policy scenarios in the 2020-2050 time frame. Comparison among opti-
mal solutions quantified the economic and emissions impacts of decisions
such as: prematurely closing nuclear plants, capping emissions, aggres-
sively installing renewable generation, or deploying advanced nuclear re-
actors. The following sections describe the methods, data, and assumptions
used in the modeled scenarios (Section 3), the resulting optimal solutions
(Section 4), and a discussion of the key findings (Section 5). Details of the
models and calculations are further described in Appendix A

3    Methods
This work collected data from multiple sources to populate a model of the
Illinois electric grid, including existing generation capacities, potential gen-
eration technologies, the costs and wastes associated with each, and the
electricity demand profile. This simulated representation of the state of

                                        2
Illinois relies on the Temoa framework, an open source tool built by re-
searchers at North Carolina State University (NCSU), which enables energy
system optimization and techno-economic analysis [6, 7, 8].
The technology models in Temoa representing energy source are config-
ured with data regarding fundamental techno-economic parameters such
as their capacity, capacity factors, seasonal generation profiles, auxiliary
products, waste generation metrics, and costs (fixed, capital, variable, and
otherwise). The Appendix A describe the key assumptions about electric-
ity generation and storage technologies in the Illinois model built for this
report.
3.1 Optimization Analysis
This work established optimal solutions to various scenarios which illumi-
nate the potential impact of nuclear plant closures and other policy options
on the cost of power in Illinois. These simulations also explore Illinois’
ability to meet aggressive proposed carbon goals with and without main-
tenance and expansion of nuclear power capacity.
Assumptions and constraints in these simulated scenarios differentiate
them. Each optimized scenario is the solution to a linear programming
problem comprised of two key components. First, the objective function
minimizes the total system cost of the energy grid in the state of Illinois.
Such an objective function is stated thus:
minimize
G Z t=2050
∑ c g (t) (1)
g=1 t=2020
3where
G = number of generation technologies
x g (t) = capacity of technology g in year t [ TW ]
$
c g (t) = total cost of technology g in year t
TW
= (l g (t) + f g (t) + v g (t)c f g (t)t) x g (t)
$
l g (t) = loan cost of technology g in year t
TW
$
f g (t) = fixed cost of technology g in year t
TW
$
v g (t) = variable cost of technology g in year t
TW − year
c f g (t) = capacity factor of technology g in year t [%].
Second, a set of constraints limit the model solutions. In this case, such
constraints include balancing electric supply with electric demand, reduc-
ing carbon to zero by 2030, specifying renewable energy and energy storage
deployment speeds, and limiting land use based on availability. All begin
with the same initial condition which reflects the present energy generation
infrastructure in Illinois. Then, optimization proceeds by varying all free
parameters within the scope of the defined constraints in order to meet the
objective. Ultimately, the simulation solution gives the energy generation
mix, x~g , for the Illinois electric grid that minimizes system cost. In this case,
Temoa varies the deployed ratio of generation technologies on the Illinois
electric grid, within the constraints of various policies, to minimize cost.
The simulations each begin in the year 2020 and proceed through 2050.
The initial condition in 2020 represents the true 2020 electricity generation
mix in the state of Illinois.
3.2 Data
Robust data from a variety of national and regional databases populate
the model of Illinois’ electric generation in the Temoa framework. Primar-
ily, this work relied on federal and international databases from the En-
ergy Information Administration [9, 10, 11, 12], the U.S. Geological Survey
[13], International Energy Agency [14], the Nuclear Energy Agency [15],
the Nuclear Regulatory Commission [16], the Intergovernmental Panel on
4Climate Change [17, 18, 19, 20], the Interstate Renewable Energy Coun-
cil [21, 22, 23, 24, 25, 26, 27], the Department of Energy’s EERE and NE
offices [28], and the National Renewable Energy Laboratory [29, 30]. In-
dustry sources included the World Nuclear Association [31] , the Nuclear
Energy Institute [32, 33, 34, 35], Rockland Capital Generation [36], Sargent
& Lundy [37], Lazard [38], and others [39, 40, 41].
In particular, the costs assumed in the model configuration for each
technology drove the cost optimization. Table 1 shows the cost assump-
tions in the models while Table 2 shows the emissions assumptions.
Table 1: Cost Data for Each Technology
Technology Investment Fixed Variable Source
(M$ /MW) (M$ /GW-year) (M$ /GWh)
Coal (Existing) 3.6663 40.7032 0.0213 [29]
Coal (New) 6.0353 59.0197 0.0366 [29]
Natural Gas (Existing) 0.9596 11.1934 0.0224 [29]
Natural Gas (New) 2.7129 27.4747 0.0275 [29]
Nuclear (Existing) 0.0500 177.7374 0.0058 [33]
Nuclear (New) 6.2326 121.0922 0.0092 [29]
Solar (Utility) 1.5935 19.3340 0.0 [29]
Solar (Residential) 3.1077 22.3868 0.0 [29]
Wind (Utility) 1.8780 43.7560 0.0 [29]
Storage (Li-Battery) 1.6080 34.1100 0 [29]
This work was conducted in the open under a BSD-3 open-source li-
cense by the Advanced Reactors and Fuel Cycles group at the University
of Illinois. All data, models, and assumptions used in his work can all
Table 2: Emissions Data for Each Technology
Technology SO2
MT NO x CO2 Hg CO2eq Source
MT
MT MT MT
GWh GWh GWh GWh GWh
Coal (Existing) 1.5477E-10 1.2382E-10 3.2594E-07 6.7496E-15 8.2000E-04 [37, 17]
Coal (New) 8.5898E-11 1.3155E-10 3.2656E-08 6.7496E-16 2.2000E-04 [37, 17]
Nat. Gas (Existing) 5.1074E-12 3.0954E-11 1.8108E-07 0.0 4.9000E-04 [37, 17]
Nat. Gas (New) 5.1074E-12 3.0954E-11 1.8108E-08 0.0 1.7000E-04 [37, 17]
Nuclear (Existing) 0.0 0.0 0.0 0.0 1.2000E-05 [37, 17]
Nuclear (New) 0.0 0.0 0.0 0.0 1.2000E-05 [37, 17]
Solar (Utility) 0.0 0.0 0.0 0.0 4.8000E-05 [37, 17]
Solar (Residential) 0.0 0.0 0.0 0.0 4.1000E-05 [37, 17]
Wind (Utility) 0.0 0.0 0.0 0.0 1.1000E-05 [37, 17]
Storage (Li-Battery) 0.0 0.0 0.0 0.0 2.3164E-05 [37, 17, 42]
5be found and explored at open source repository at https://github.com/
arfc/2021-04-nm-illinois.
3.3 Scenarios Simulated
Table 3 describes the scenarios we conducted. All share the same objective
function, which seeks to minimize total system cost. They are clustered
in four major categories. First, the business-as-usual (BAU) cases assume
no carbon limit, while the constrained carbon (CC) cases assume a zero
carbon target in 2030. Comparing these two simulation categories reveals
the potential impact of carbon limits and premature nuclear energy closure
on the minimum achievable cost. These simulations make conservative
assumptions about the cost and availability of advanced nuclear power.
To explore the importance of these assumptions, two additional classes
of simulations were explored. In the expensive nuclear (XN) cases, ad-
vanced nuclear reactors are assumed to be twice as expensive to build than
the best conservative estimates. In the zero advanced nuclear (ZN) cases,
advanced nuclear power is not available in time to contribute to carbon re-
ductions in Illinois before 2050. These scenarios are summarized in Table
3.
ID Byron Other Zero Renewable
& Dresden Nuclear Carbon Growth
Closures Closures Target Rate
BAU1 premature scheduled none limited
BAU2 scheduled scheduled none limited
BAU3 none none none limited
CC1 premature scheduled 2030 optimistic
CC2 scheduled scheduled 2030 optimistic
CC3 none none 2030 optimistic
XN1 premature scheduled 2030 optimistic
XN2 scheduled scheduled 2030 optimistic
XN3 none none 2030 optimistic
ZN1 premature scheduled 2030 unlimited
ZN2 scheduled scheduled 2030 unlimited
ZN3 none none 2030 unlimited
Table 3: A summary of the scenarios simulated in this work, differentiated
by their primary constraints.
63.4 Constraints
Some constraints are shared among all scenarios:
• The initial conditions reflect the true 2020 energy mix in Illinois.
• Power supply must meet power demand in each time step.
• Strategic planning reserve must be greater than 15% of demand.
• Technology models are identical across all simulations with the ex-
ception of the capital cost of advanced nuclear, which is altered for
the XN scenarios.
The simulations diverge due to their differing treatment of constraints
related to the timing of nuclear plant closures, inclusion of carbon targets,
and land-use limits for the growth of renewables.
3.4.1 Byron and Dresden Closures
In each family of scenarios, the impact of closing Byron & Dresden was
explored by assuming one of three assumptions. The two plants either:
• close prematurely, in 2021,
• close as scheduled, when their current licenses expire in 20 and 10
years, or
• receive license extensions and continue operating through 2050.
3.4.2 Other Existing Nuclear
In each family of scenarios, the other existing nuclear power plants in Illi-
nois were either:
• decommissioned as scheduled according to their current licenses, or
• awarded license extensions and continue operating through 2050.
3.4.3 Zero Carbon Target
In the business as usual cases (BAU1-3), the simulations were not carbon
limited. In all other simulations, a linear reduction in carbon emissions
beginning in 2020 and reaching zero carbon emissions by 2030. This con-
strains energy deployment options in those simulations.
73.4.4 Renewable Growth Rate
In the business-as-usual cases, the growth rate for renewable energy is lim-
ited by economics, primarily. In the carbon constrained and expensive nu-
clear scenarios, an optimistic growth rate is enabled. In those cases, utility
scale solar is allowed to grow to 10 GWe by 2030, reflecting the aggressive
and optimistic build out proposed in the Illinois Clean Energy Jobs Act.
Similarly, wind turbine deployments grow to 13.8 GWe by 2030. Finally,
residential solar is allowed to increase at a steady rate, but is capped at
75% of the technical resource availability to reflect deployment on 75% of
Illinois buildings [43].
Without preserving existing nuclear or deploying advanced reactors,
the required land use for solar and wind generation is infeasible, since the
Illinois land appropriate for wind and solar is already in use as vital farm-
land. The southern and central regions of Illinois most suitable for solar
power installations are the same regions the nation currently relies on for
15% of its corn and 14% of its soybeans [44].
Specifically, strategies which allow nuclear plants to close before 2050
require 10,000km2 of this land to be dedicated to solar as well as 4% of Illi-
nois’ land area in use for rooftop solar. Keeping the nuclear plants open
through 2050 halves this requirement. The constraints on utility scale wind
and solar are lifted. It is not possible to achieve zero carbon without ad-
vanced nuclear under the above constraints.
8Figure 1: Corn (bottom left) and soybean (bottom right) crops in Illinois lie
predominantly in the same portion of the state corresponding to the region
of highest solar panel suitability (top) [44, 45, 30].
93.5 Demand Model
Illinois electricity demand has remained steady at approximately 140.7 TWh
per year for the last decade [12]. All scenarios simulated in this report as-
sume that this demand remains steady annually. If Illinois transportation
is fully electrified by 2050, this assumption will not be valid. However,
postulating such growth scenarios is beyond the scope of this report.
As part of model configuration, the Temoa framework accepts demand
profiles capturing seasonal and daily fluctuations. The typical Illinois hourly
demand profile and seasonal variation in hourly demand were both re-
trieved from the U.S. Energy Information Administration (EIA) [12]. Figure
2 shows the variation in hourly demand. In our simulations, the demand
is seasonally modulated by this information.
Figure 2: The seasonal variation in hourly demand in Illinois was retrieved
from the EIA [12] and loaded into Temoa [7].
4 Results
We report the deplioyed generation mixes that minimize cost, cumulative
carbon equivalent emissions, cumulative solid waste produced, and to-
10tal land use change for each of the twelve scenarios considered. Figure
3 shows the mixture of Illinois electricity resources in 2050, the final year of
each simulation.
Figure 3: The mixture of electric generation in Illinois by 2050 for each sce-
nario.
In the first two scenarios, BAU1 and BAU2, existing nuclear capacity is
phased out by 2050 and replaced almost entirely by natural gas capacity,
without carbon capture. 2.7 GW of rooftop solar further displaces coal gen-
eration. Existing wind turbines are also phased out by 2045 in these scenar-
ios. In scenario BAU3, all existing nuclear plants are maintained through
2050, halving the required natural gas capacity.
Scenarios CC1, CC2, CC3, XN1, XN2, and XN3, simulate a strong cli-
mate policy by forcing zero carbon emissions from electricity generation
in 2030 and aggressively pursuing renewable energy per the goals of the
Clean Energy Jobs Act [46]. However, even optimistic deployment of re-
newable energy sources is insufficient to replace all of the current coal
and natural gas generation, let alone generation lost from retiring nuclear
plants. Advanced nuclear technology is required to achieve net- zero car-
bon electricity generation by 2030 in each of these scenarios.
The final three scenarios, ZN1, ZN2, and ZN3, show the solar, wind,
and battery capacity required to replace electricity generation from all other
technologies. If the existing Illinois nuclear fleet is phased out, Illinois will
have to build 34 GW of rooftop solar, 77 percent of the technical limit [43],
along with 56 GW of utility scale solar by 2030.
In every scenario, Illinois will need, at minimum, 45.7 GW of 4.87 hour
duration energy storage to ensure grid reliability according to NERC rec-
11ommendations [47]. With zero firm capacity from nuclear generation, 65.2
GW of battery storage is required. Since the current total utility-scale batter
storage capacity in the US is just over 1.5GW, such battery storage capacity
deployment is unrealistic.
In these optimization simulations, all of the carbon-constrained scenar-
ios were more expensive than business-as-usual. In scenarios XN1, XN2,
and XN3, which simulated significant cost overruns for advanced nuclear
technology, the total system cost was, at most, 0.06% higher than in CC1,
CC2, and CC3. Thus, the effect of cost overruns in new nuclear builds is
negligible. The ZNx scenarios were at most 5.5% percent cheaper than sce-
narios with advanced nuclear, which is well within uncertainty for these
analyses.
4.1 CO2 Equivalent Emissions
The lifecycle carbon equivalent emissions for each year in the simulation is
shown in Figure 4 and the cumulative lifecycle emissions for each scenario
are shown in Figure 5
Figure 4: A comparison of the lifecycle carbon equivalent emissions for
each simulation year and across all scenarios.
12Figure 5: A comparison of the total lifecycle carbon emissions in each sce-
nario. Red bars denote scenarios without a carbon constraint. Green bars
denote scenarios that constrained carbon emissions during operation.
Table 4 shows that keeping existing nuclear plants open while invest-
ing in both advanced nuclear technology and renewable energy generates
the lowest lifecycle carbon emissions. The scenario with the lowest carbon
emissions is listed in bold in Table 4.
Table 4: Cumulative Lifecycle CO2 eq Emissions
Scenario CO2 eq Existing Nuclear
[Million Tons] Closures
BAU1 499.25 Premature
BAU2 442.50 Scheduled
BAU3 296.51 After 2050
CC1/XN1 91.46 Premature
CC2/XN2 72.32 Scheduled
CC3/XN3 65.83 After 2050
ZN1 105.54 Premature
ZN2 84.00 Scheduled
ZN3 75.07 After 2050
134.2 Solid Waste
Solid waste forms are a key benefit of solar, wind, and nuclear technology
since society can decide how and where the waste will be stored or recy-
cled. Solid waste is advantageous when compared to liquid or gaseous
effluents (e.g. NOx , SOx , CO2 , and air particulates) which are more chal-
lenging to manage. Figure 6 shows the total waste that must be handled by
2050.
Figure 6: The total solid waste accumulated from each clean technology by
2050.
The solid waste generated in scenarios BAU1, BAU2, and BAU3 are
lower than all other scenarios because most of the electricity generation in
those scenarios comes from fossil fuels. Which, of course, produces gaseous
waste. Implicit to handling solid waste are unmodeled energy and trans-
portation requirements. In every carbon-constrained scenario, keeping the
existing nuclear plants open through 2050 avoids the most solid waste pro-
duction. Table 5 shows the total accumulated waste. Once again, the sce-
nario that generates the least solid waste is CC3/XN3, where the existing
nuclear fleet is kept open, renewable energy is built aggressively, and ad-
vanced nuclear technology is pursued. In Table 5, the scenario with the
lowest accumulated waste is in bold.
14Table 5: Solid Waste Accumulated by 2050
Scenario Solid Waste Existing Nuclear
[Million Tons] Closures
BAU1 0.0481 Premature
BAU2 0.0485 Scheduled
BAU3 0.0500 After 2050
CC1/XN1 1.0765 Premature
CC2/XN2 1.1254 Scheduled
CC3/XN3 0.7569 After 2050
ZN1 2.0623 Premature
ZN2 1.9363 Scheduled
ZN3 1.3873 After 2050
4.3 Land Use Change
Land use is another important consideration for sustainable development.
Figure 7 shows the required land use in each scenario. Conventional elec-
tricity generation requires very little land to operate due to the high power
density of those generators.
Figure 7: The percentage of land use required for each scenario.
15Table 6 shows the breakdown of land use change for each renewable
energy source as a percentage of Illinois’ land area. In each of the carbon-
constrained cases, keeping the nuclear plants open through 2050 reduces
the land use change by half.
Table 6: Land Use Requirements as a Percentage of Illinois’ Area
Scenario Wind Farms Solar Farms Rooftop Solar Existing Nuclear
[%] [%] [%] Closures
BAU1 0.0000 0.0000 0.3891 Premature
BAU2 0.0000 0.0000 0.3891 Scheduled
BAU3 0.0000 0.0000 0.3891 After 2050
CC1/XN1 0.8687 3.2818 4.8227 Premature
CC2/XN2 1.8731 3.8973 4.8227 Scheduled
CC3/XN3 0.1676 1.5625 2.7486 After 2050
ZN1 4.6948 6.4962 4.0922 Premature
ZN2 4.6948 6.2401 4.4083 Scheduled
ZN3 0.5685 4.5510 1.9208 After 2050
5 Discussion
This work constructed a techno-economic model of the Illinois electric grid
using the Temoa framework [7]. With this framework, we simulated twelve
(12) potential economic and policy futures for this energy system spanning
the 2020-2050 timeframe. The linear programming model identified energy
mixtures that minimized total system costs in the context of those potential
technology, economic, and policy constraints.
This work accordingly adds to the growing body of research demon-
strating how decommissioning existing, emissions-free nuclear power plants
endangers the feasibility of near-term zero-emissions targets. Our conclu-
sions are consistent with and confirmatory of such literature, in particu-
lar, the February 2021 National Academy of Sciences, Engineering, and
Medicine consensus report, “Accelerating Decarbonization of the U.S. En-
ergy System,” which determined unequivocally that U.S. decarbonization
will require keeping existing nuclear plants open [2].
Specifically, our simulations indicate that decarbonization in Illinois will
require not only maintenance but expansion of nuclear energy capacity.
When the 2020-2050 cost of the Illinois electric system is minimized, com-
parison of these twelve (12) scenarios showed that :
16• Nuclear energy is necessary to reach Illinois’ carbon reduction goals.
• Without existing nuclear power, reaching zero carbon would require
solar deployments to displace 10, 000km2 of critical Illinois farmland.
• Deploying new advanced nuclear generation is the least expensive
way to allow Illinois farmland to remain farmland while reaching
zero-carbon by 2030.
• Keeping Illinois’ existing nuclear plants open through 2050 avoids
25 million metric tons of life-cycle CO2 emissions and 600,000 metric
tons of e-waste.
• Even if advanced nuclear deployments experienced 200% capital cost
overruns, total system cost impacts would be negligible.
• Deploying advanced nuclear avoids approximately 900,000 metric tons
of e-waste.
• Extraordinary, possibly infeasible, grid-scale battery storage capacity
is required to meet any zero-carbon target with significant renewable
penetration.
References
[1] Aaron Larson. Exelon Makes Plans to Retire Byron and Dresden Nu-
clear Plants in 2021, August 2020. Section: Nuclear.
[2] National Academies of Sciences, Engineering, and Medicine 2021. Ac-
celerating Decarbonization of the U.S. Energy System. A Consensus Study
Report. The National Academies Press, Washington D.C., February
2021.
[3] Eric Larson, Chris Greig, Jesse Jesse, Erin Mayfield, Andrew Pascale,
Chuan Zhang, and Joshua Drossman. Net-Zero America: Potential
Pathways, Infrastructure and Impacts. Interim Report, Princeton Uni-
versity, High Meadows Environmental Institute, Carbon Mitigation
Initiative, Andlinger Center for Energy+the Environment, Princeton,
NJ, December 2020.
[4] Steven J. Davis, Nathan S. Lewis, Matthew Shaner, Sonia Aggarwal,
Doug Arent, Inês L. Azevedo, Sally M. Benson, Thomas Bradley,
17Jack Brouwer, Yet-Ming Chiang, Christopher T. M. Clack, Armond
Cohen, Stephen Doig, Jae Edmonds, Paul Fennell, Christopher B.
Field, Bryan Hannegan, Bri-Mathias Hodge, Martin I. Hoffert, Eric
Ingersoll, Paulina Jaramillo, Klaus S. Lackner, Katharine J. Mach,
Michael Mastrandrea, Joan Ogden, Per F. Peterson, Daniel L. Sanchez,
Daniel Sperling, Joseph Stagner, Jessika E. Trancik, Chi-Jen Yang,
and Ken Caldeira. Net-zero emissions energy systems. Science,
360(6396):eaas9793, June 2018.
[5] CATF. Potential Human Health Impacts Associated with Re-
tirement of Nuclear Power Plants in Illinois. White Paper,
Clean Air Task Force, Washington D.C. United States, April
2021. https://www.catf.us/wp-content/uploads/2021/04/Illinois-
Nuclear-Study-Revised-2-and-4-plants-FINAL-April-14-2021.pdf.
[6] Joseph DeCarolis, Kevin Hunter, and Sarat Sreepathi. The TEMOA
project: tools for energy model optimization and analysis. Stockholm,
Sweden, 2010.
[7] J.F. DeCarolis, S. Babaee, B. Li, and S. Kanungo. Modelling to generate
alternatives with an energy system optimization model. Environmental
Modelling & Software, 79:300–310, May 2016.
[8] Joseph DeCarolis, Hannah Daly, Paul Dodds, Ilkka Keppo, Francis Li,
Will McDowall, Steve Pye, Neil Strachan, Evelina Trutnevyte, Will
Usher, Matthew Winning, Sonia Yeh, and Marianne Zeyringer. For-
malizing best practice for energy system optimization modelling. Ap-
plied Energy, 194:184–198, May 2017.
[9] U.S. Energy Information Administration (EIA). Preliminary Monthly
Electric Generator Inventory. Technical report, March 2021.
[10] Energy Information Administration. State Electricity Profiles - Energy
Information Administration, November 2020.
[11] U.S. Energy Information Administration (EIA). Electric Power
Monthly. Technical report, EIA, 2021.
[12] U.S. Energy Information Administration (EIA). Illinois - State Energy
Profile Overview. Technical report, May 2020.
[13] Ben Hoen, James E Diffendorfer, Joseph Rand, Louisa A. Kramer,
Christopher P Garrity, Aaron D. Roper, and Hannah Hunt. United
States Wind Turbine Database, 2018. type: dataset.
18[14] S Lorenczik and Jan Horst Keppler. Projected Costs of Generating
Electricity - 2020 Edition. Technical report, IEA, France, 2020.
[15] Matt Crozat. The Full Costs of Electricity Provision. Technical Report
7298, OECD, 2018.
[16] United States Nuclear Regulatory Commission. Illinois Nuclear
Power Reactors. Technical report, July 2020.
[17] Intergovernmental Panel on Climate Change. Annex III: Technology-
specific Cost and Performance Parameters. In Climate Change 2014 Mit-
igation of Climate Change: Working Group III Contribution to the Fifth As-
sessment Report of the Intergovernmental Panel on Climate Change. Cam-
bridge University Press, Cambridge, 2014.
[18] Intergovernmental Panel on Climate Change and Ottmar Edenhofer,
editors. Climate change 2014: mitigation of climate change: Working Group
III contribution to the Fifth Assessment Report of the Intergovernmental
Panel on Climate Change. Cambridge University Press, New York, NY,
2014. OCLC: ocn892580682.
[19] Intergovernmental Panel on Climate Change and Ottmar Edenhofer,
editors. Climate change 2014: mitigation of climate change: Working Group
III contribution to the Fifth Assessment Report of the Intergovernmental
Panel on Climate Change. Cambridge University Press, New York, NY,
2014. OCLC: ocn892580682.
[20] Intergovernmental Panel on Climate Change. Climate Change 2014 Mit-
igation of Climate Change: Working Group III Contribution to the Fifth As-
sessment Report of the Intergovernmental Panel on Climate Change. Cam-
bridge University Press, Cambridge, 2014.
[21] Larry Sherwood. U.S. Solar Market Trends 2008. Technical report,
Interstate Renewable Energy Council, July 2009.
[22] Larry Sherwood. U.S. Solar Market Trends 2009. Technical report,
Interstate Renewable Energy Council, July 2010.
[23] Larry Sherwood. U.S. Solar Market Trends 2010. Technical report,
Interstate Renewable Energy Council, June 2011.
[24] Marilyn A Brown, Daniel D’Arcy, Melissa Lapsa, Isha Sharma, and
Yufei Li. SOLID WASTE FROM THE OPERATION AND DECOM-
MISSIONING OF POWER PLANTS. page 104, 1996.
19[25] Larry Sherwood. U.S. Solar Market Trends 2011. Technical report,
Interstate Renewable Energy Council, August 2012.
[26] Larry Sherwood. U.S. Solar Market Trends 2012. Technical report,
Interstate Renewable Energy Council, July 2013.
[27] Larry Sherwood. U.S. Solar Market Trends 2013. Technical report,
Interstate Renewable Energy Council, July 2014.
[28] U.S. Department of Energy. Capital Cost Estimates for Utility Scale
Electricity Generating Plants. page 141, November 2016.
[29] NREL. 2020 Annual Technology Baseline. Technical report, National
Renewable Energy Laboratory, Golden, CO, United States, 2020.
[30] Manajit Sengupta, Yu Xie, Anthony Lopez, Aron Habte, Galen
Maclaurin, and James Shelby. The national solar radiation data base
(NSRDB). Renewable and Sustainable Energy Reviews, 89:51–60, 2018.
Publisher: Elsevier.
[31] World Nuclear Association. Nuclear Power Economics and Project
Structuring. Technical Report 2017/001, World Nuclear Association,
January 2017.
[32] Harsh Desai. Nuclear Costs in Context. Technical report, Nuclear
Energy Institute, October 2018.
[33] Harsh Desai. Nuclear Costs in Context. Technical report, Nuclear
Energy Institute, October 2020.
[34] Dean Murphy and Mark Berkman. Impacts of Announced Nuclear
Retirements in Ohio and Pennsylvania. Nuclear Matters Report 20,
The Brattle Group and Nuclear Matters, One Beacon St., Suite 2600,
Boston, MA, April 2019.
[35] Christopher W. Tessum and Julian D. Marshall. Air quality and health
impacts of potential nuclear electricity generator closures in Pennsyl-
vania and Ohio. Prepared for the Nuclear Energy Institute 22, Univer-
sity of Washington and Nuclear Matters and the National Caucus and
Center on Black Aging, Seattle, WA, United States, April 2019.
[36] Rockland Capital. Natural Gas Combined Cycle – Rockland Capital.
Technical report, April 2021.
20[37] Sargent & Lundy. Capital Costs and Performance Characteristics for
Utility Scale Power Generating Technologies. Capital Cost Study SL-
014940, February 2020.
[38] Douglas Ray. Lazard’s Levelized Cost of Energy Analysis—Version
13.0. page 21, 2020.
[39] The Solar Foundation. National Solar Jobs Census 2019. Technical
report, The Solar Foundation, February 2020.
[40] Solar Energy Industries Association. Illinois Solar. Technical report,
SEIA, 2020.
[41] J. Rutovitz, E. Dominish, and J. Downes. Calculating global energy
sector jobs: 2015 methodology. Report, Institute for Sustainable Fu-
tures, UTS, January 2015.
[42] Erik Emilsson and Lisbeth Dahllöf. Lithium-Ion Vehicle Battery Pro-
duction – Status 2019 on Energy Use, CO2 Emissions, Use of Metals,
Products Environmental Footprint, and Recycling. Technical Report C
444, Swedish Environmental Research Institute, Sweden, 2019.
[43] Peter Gagnon, Robert Margolis, Jennifer Melius, Caleb Phillips, and
Ryan Elmore. Rooftop Solar Photovoltaic Technical Potential in the
United States: A Detailed Assessment. Technical Report NREL/TP-
6A20-65298, National Renewable Energy Laboratory, United States,
January 2016.
[44] Mark Schleusener and Harvey Roemer. Illinois Agricultural Statis-
tics 2019 Annual Bulletin. Illinois Annual Bulletin, United States De-
partment of Agriculture National Agricultural Statistics Service Illi-
nois Field Office, 801 Sangamon Ave, Room 62 IL Dept of Ag Bldg
Springfield, IL 62702, October 2020.
[45] EISPC. Energy Zones Mapping Tool, 2021.
[46] Illinois Clean Jobs Coalition. Clean Energy Jobs Act, April 2021.
[47] Michael Milligan. Methods to Model and Calculate Capacity Con-
tributions of Variable Generation for Resource Adequacy Planning.
Technical report, North American Energy Reliability Corporation,
Princeton, NJ, March 2011.
[48] BLS. Consumer Price Index (CPI) Databases. Average Price Data, U.S.
Bureau of Labor Statistics, Washington D.C., 2021.
21A Technology Models
The technology models in Temoa representing energy source are config-
ured with data regarding fundamental techno-economic parameters such
as their capacity, capacity factors, seasonal generation profiles, auxiliary
products, waste generation metrics, and costs (fixed, capital, variable, and
otherwise). The following subsections describe the key assumptions about
electricity generation and storage technologies in the Illinois model built
for this report.
A.0.1 Solar Energy Model
Existing solar power capacities and cost data were averaged over the state
and based on the the National Renewable Energy Laboratory (NREL) An-
nual Technology Baseline for 2020 [29]. However, power generation pro-
files loaded into Temoa representing the variability of solar power, such
as the seasonal variation in Figure 9, were derived from a reference solar
farm, the University of Illinois at Urbana-Champaign (UIUC) Solar Farm
1.0, located in Champaign, IL. The data was provided by the University of
Illinois Facilities and Services Department.
Figure 8:
Figure 9: The seasonal variation in hourly generation from Solar Farm 1.0
at UIUC, used as a scaled reference in the Temoa model of the Illinois grid.
22A.0.2 Wind Energy Model
Existing wind power capacities, capacity factors, and cost data were aver-
aged over the state and based on the NREL Annual Technology Baseline
for 2020 [29]. However, power generation profiles loaded into Temoa rep-
resenting the variability of wind generation, such as the seasonal variation
in Figure 10, were derived from a reference wind farm, Railsplitter Wind
Farm, located in Lincoln, IL. The data was provided by the University of
Illinois Facilities and Services Department. F&S Department. UIUC has a
power purchase agreement with Railsplitter Wind Farm.
Figure 10: The seasonal variation in hourly generation from the Railsplitter
Wind Farm, used as a scaled reference in the Temoa model of the Illinois
grid.
A.0.3 Nuclear Energy Model
Existing nuclear plants in Illinois were specified in the model in accordance
with their power levels, licensed lifetimes, capacity factors, and costs. Ad-
vanced nuclear power plants, when available to the model, used pricing
from the NREL Annual Technology Baseline as well as the the Nuclear En-
ergy Institute (NEI) Nuclear Costs in Context report series [33, 32, 29].
23A.0.4 Battery Technology
Grid operators must plan for resource adequacy, and these simulations
adopted the standard North American Electric Reliability Corporation (NERC)
recommendation for planning reserve margin, defined as:
Cfirm − Dpeak
PRM = (2)
Dpeak
where
Cfirm = The firm capacity [GW]
Dpeak = The peak demand [GW].
Firm capacity is sometimes considered the amount of power guaran-
teed to be available for the duration of a commitment. We consider firm
capacity to be the amount of power that is available “on-demand.” Thus,
renewable energy sources do not contribute to firm capacity. In simulations
requiring carbon free electricity by 2030 in, the only technologies available
to contribute to firm capacity are nuclear power and battery storage.
A.0.5 Coal Energy Model
Coal emissions (NOx , SOx , and CO2 ) data were retrieved from the 2020
Sargent and Lundy report, “Capital Costs and Performance Characteristics
for Utility Scale Power Generating Technologies” [37].
A.0.6 Natural Gas Energy Model
Natural gas emissions (NOx , SOx , and CO2 ) data were retrieved from the
2020 Sargent and Lundy report on Capital Costs and Performance Charac-
teristics for Utility Scale Power Generating Technologies [37].
A.1 Cost Modeling
Where available price and cost data could only be found for previous years,
we accounted for the time value of money by adjusting for inflation using
the consumer price index from the Bureau of Labor Statistics [48]. The ad-
justed price becomes:
24P2020 = adjusted price in 2020 dollars [$] (3)
Pn · CPI2020
= (4)
CPIn
where
Pn = price in year previous year, n [$] (5)
CPI2020 = consumer price index for 2020 [−] (6)
CPIn = consumer price index for year n [−]. (7)
25You can also read