Coordinated Operation of Gas and Electricity Systems for Flexibility Study - ORCA
←
→
Page content transcription
If your browser does not render page correctly, please read the page content below

ORIGINAL RESEARCH
                                                                                                                                                  published: 07 July 2020
                                                                                                                                          doi: 10.3389/fenrg.2020.00120

                                             Coordinated Operation of Gas and
                                             Electricity Systems for Flexibility
                                             Study
                                             Hossein Ameli 1*, Meysam Qadrdan 2 and Goran Strbac 1
                                             1
                                              Control and Power Group, Imperial College, London, United Kingdom, 2 Institute of Energy, Cardiff University, Cardiff,
                                             United Kingdom

                                             The increased interdependencies between electricity and gas systems driven by gas-fired
                                             power plants and gas electricity-driven compressors necessitates detailed investigation
                                             of such interdependencies, especially in the context of an increased share of renewable
                                             energy sources. In this paper, the value of an integrated approach for operating gas
                                             and electricity systems is assessed. An outer approximation with equality relaxation
                                             (OA/ER) method is used to deal with the optimization class of the mixed-integer non-linear
                                             problem of the integrated operation of gas and electricity systems. This method
                                             significantly improved the efficiency of the solution algorithm and achieved a nearly 40%
                                             reduction in computation time compared to successive linear programming. The value
                           Edited by:
             Francois M. A. Marechal,        of flexibility technologies, including flexible gas compressors, demand-side response,
      École Polytechnique Fédérale de        battery storage, and power-to-gas, is quantified in the operation of integrated gas and
                Lausanne, Switzerland
                                             electricity systems in GB 2030 energy scenarios for different renewable generation
                       Reviewed by:
                       Fabrizio Bezzo,
                                             penetration levels. The modeling demonstrates that the flexibility options will enable
            University of Padova, Italy      significant cost savings in the annual operational costs of gas and electricity systems (up
                      Denny K. S. Ng,
                                             to 21%). On the other hand, the analysis carried out indicates that deployment of flexibility
      Heriot-Watt University Malaysia,
                              Malaysia       technologies appropriately supports the interaction between gas and electricity systems.
                  *Correspondence:           Keywords: integrated gas and electricity systems, operation, renewable generation variability, electricity and
                        Hossein Ameli        flexibilities, contingency
              h.ameli14@imperial.ac.uk

                    Specialty section:       1. INTRODUCTION
          This article was submitted to
         Process and Energy Systems          The share of variable Renewable Energy Sources (RES) in the power generation mix is increasing
                           Engineering,
                                             significantly in Great Britain (GB) to meet de-carbonization targets (National Grid Plc, 2016).
                a section of the journal
          Frontiers in Energy Research
                                             Gas plants are expected to contribute to the management of the variability of renewable energy
                                             generation, which consequently will increase the interaction between gas and electricity systems
       Received: 11 November 2019
                                             and increase challenges associated with the management of gas storage and linepack in the gas
           Accepted: 19 May 2020
           Published: 07 July 2020
                                             transmission system. Therefore, operating the gas and electricity systems as an integrated energy
                                             system is increasingly important.
                              Citation:
    Ameli H, Qadrdan M and Strbac G
                                                Battery storage, Demand-Side Response (DSR), power-to-gas (P2G), and flexible compressors
 (2020) Coordinated Operation of Gas         can enhance the system flexibility needed to support more cost-effective balancing of electricity
   and Electricity Systems for Flexibility   demand and supply. Furthermore, these options can participate in the provision of various ancillary
      Study. Front. Energy Res. 8:120.       services, including reserve and frequency regulation (Qadrdan et al., 2017b). Battery storage
       doi: 10.3389/fenrg.2020.00120         facilitates the integration of wind into the grid through managing variation of the peak plants,

Frontiers in Energy Research | www.frontiersin.org                                  1                                                    July 2020 | Volume 8 | Article 120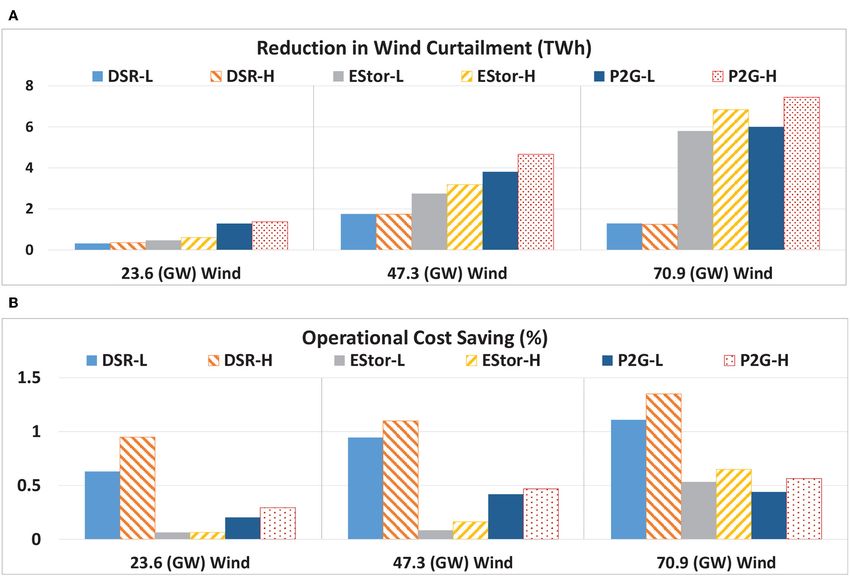
Ameli et al.                                                                                          Flexibility in Integrated Gas and Electricity Systems

such as gas-fired plants. The employment of DSR helps to deal              penetration of renewables and an increase in system flexibility.
with the variability of RES better, as energy consumption can              The effectiveness of the proposed method (i.e., solved by the
be shifted, which can act as a virtual power plant (Ameli et al.,          Newton-Raphson method) was analyzed on an IEEE-9 test
2017a,b). Furthermore, P2G technologies would make use of                  system and a 7-node gas system. In Correa-Posada and Sanchez-
a surplus of renewable electricity by producing hydrogen via               Martin (2015), a coupled model of natural gas and power systems
electrolyzers that would be injected into the gas system or stored         aimed at providing energy adequacy was presented. Non-linear
in hydrogen storage facilities. Afterward, the hydrogen can be             equations and constraints were linearized to solve a Mixed-
transported to the demand centers or provided to Combined                  Integer Linear Programming (MILP) problem. A weak point
Cycle Gas Turbines (CCGTs) to produce free-carbon electricity.             of this study was that linearizing the non-linearities piecewise
In the gas system, flexible gas compressors improve gas delivery           causes a significant increase in the probability of data loss.
to the demand centers through changing the gas flow direction.             In Gil et al. (2016), two coupling methodologies for gas and
Several studies, such as Troy et al. (2012) and Pudjianto et al.           electricity markets in a European regulatory framework were
(2014), have evaluated the role of flexibility options in addressing       presented. The first methodology was based on maximizing the
the electricity balancing challenges caused by RES.                        profit of the electricity market, and the second approach was
    From whole energy system perspectives, by taking flexibilities         based on minimizing the operational cost of the natural gas
into account, the interaction of gas and electricity systems was           system. It was demonstrated that if the modeling is accurate, the
studied in Correa-Posada and Sanchez-Martin (2015), He et al.              difference between these two methodologies may be negligible. In
(2017), Zlotnik et al. (2017), Qadrdan et al. (2017a), Ameli et al.        addition, in Zlotnik et al. (2017), different coordinated scheduling
(2017c,d), and Wu et al. (2019). Zlotnik et al. (2017) developed           scenarios of natural gas and power systems were presented. The
coordinated modeling of interdependent gas and electricity                 Unit Commitment (UC) problem of the generation units was
systems for day-ahead scheduling of power dispatch and gas                 not considered. This was done in order to reduce the model
compressor operation. The efficiency of the model was validated            complexity by preventing binary variables in the optimization
by improvement in system operation and cost reduction. In                  procedure, which may lead to inaccuracy. The authors of Deane
Ameli et al. (2017d), the role of multi-directional compressors            et al. (2017) built and applied an integrated electricity and
as one of the options in making the gas system more flexible               gas model for the European Union system. In this research,
was investigated in different operation methodologies of gas and           gas supply interruption scenarios were derived to examine the
electricity systems. It was demonstrated that increased flexibility        impacts on power system operation. As an example, it was shown
in the gas system is beneficial for the whole energy system.               that interruption of the Russian gas supply to the EU enhanced
In Sheikhi et al. (2015), an integrated demand-side response               the average gas price by 28% and the electricity price by 12%.
framework as a part of a smart energy hub was proposed.                    In Sardou et al. (2018), the role of microgrid aggregators in a
In this framework, the customer can modify the use of gas                  coordinated operation strategy for gas and electricity systems was
or electricity based on the gas and electricity prices. It was             investigated. In Zhang et al. (2016), the role of demand response
shown that this approach offers benefits for both customers and            in providing energy balance was considered. A coordinated MILP
utilities in terms of costs and profits. In Yang et al. (2019), the        strategy for natural gas and power systems was proposed. In this
coordination of different P2G conversions, including electrolysis          strategy, the power system was optimized, and then the natural
and Steam Methane Reforming (SMR), and gas-fired plants in                 gas constraints were checked for the feasibility of the solution.
an integrated operation of gas and electricity networks was                It was shown that this model increased the social welfare of the
proposed. It was shown how this combined model can improve                 scenarios. However, through linearizing the gas flow equation
energy efficiency and reduce carbon emissions compared to                  piecewise, the complexity of the model is reduced, and accuracy
the power-to-hydrogen-to-methane-to-pipeline approach. From                may be lost. In the literature, different methods have been applied
a modeling point of view, it was not mentioned in detail how               to linearize the general gas flow and propose a MILP formulation
this optimization problem may be solved. In He et al. (2017),              for the operation of a gas network (Correa-Posadaa and Sanchez-
coordinated scheduling of gas and electricity systems considering          Martin, 2014; He et al., 2017; HU et al., 2017; Sirvent et al.,
P2G was investigated. Furthermore, another study (Akhtari and              2017). Although piecewise linearization affects the time required
Baneshi, 2019) showed how the excess electricity generated by              to solve the problem considerably, the accuracy of each method
renewables can be used in the electrolysis process to produce              (i.e., ability to find the optimal solution) significantly relies on the
hydrogen. The proposed method was tested in five different                 generating segments. On the other hand, some methods are not
cities, and a decrease in carbon emissions was reported. In Wu             scalable and can only be used for a problem of a predetermined
et al. (2019), a hybrid multi-objective optimization approach              size (Correa-Posadaa and Sanchez-Martin, 2014).
was developed for the operation of integrated energy systems                   The coupling of the binary variables representing the
considering gas and electricity. In this approach, the price of            On/Off states of generating units and non-linear equations
electricity and cooling demands are considered. The results                of gas flow in pipes and compressor power consumption
indicated fair treatment for all the players in the integrated             makes the optimization of the integrated operation of gas and
energy system. In Zeng et al. (2016), a bi-directional energy flow         electricity systems a Mixed-Integer Non-Linear Programming
between gas and electricity systems was proposed to realize high           (MINLP) problem, which is complex and challenging to

Frontiers in Energy Research | www.frontiersin.org                     2                                               July 2020 | Volume 8 | Article 120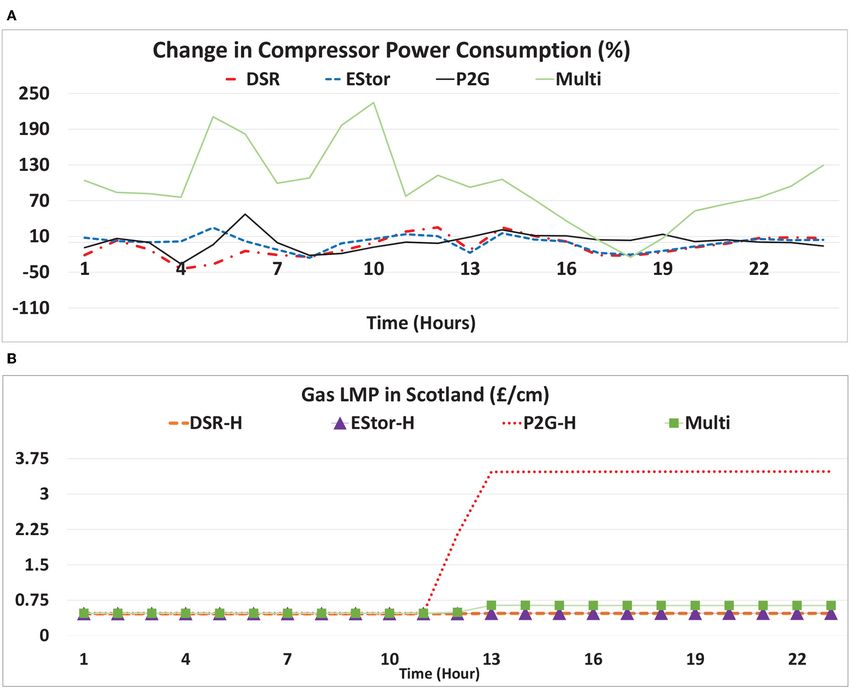
Ameli et al. Flexibility in Integrated Gas and Electricity Systems
solve from the computational perspective (Floudas, 1995). In so that, through this method, the entire year is represented
order to deal with the aforementioned complexity in solving by 12 days.
the MINLP problem, several algorithms, such as Generalized
Benders Decomposition (GBD), Outer Approximation (OA), 2. GAS AND ELECTRICITY SYSTEMS
Outer Approximation with Equality Relaxation (OA/ER),
and generalized cross decomposition, have been developed
INCLUDING A FLEXIBILITY OPERATIONAL
(Floudas, 1995). Deterministic methods, such as Lagrangian MODEL
Relaxation (LR) (Ongsakul and Petcharaks, 2004) and Benders 2.1. Formulation of Electricity System
Decomposition (BD) (Nasri et al., 2016), and also heuristic
methods, such as an evolutionary algorithm (Chung et al., 2011)
Operation
The constraints governing the electricity system over the time
have been applied to solve MINLP problems in power systems. In
horizon (t ∈ T ) are represented by equations (1)–(11). These
Shabanpour-Haghighi and Seifi (2015), a solving technique based constraints include: minimum and maximum power generation
on a modified teaching–learning method for optimal power limits for generators (1), Minimum Stable Generation (MSG)
flow taking electricity, gas, and heat into account was proposed. for thermal generators (2), maximum limit for power generation
This method was evaluated and compared with conventional and provision of reserve by thermal generators (3), Minimum
evolutionary algorithms to highlight the effectiveness of the Up/Down Time (MUT/MDT) of generators (4)–(5), ramp
method. In He et al. (2017), co-optimization scheduling of gas up/down limits of generators (6), start-up cost of generators
and electricity systems was proposed. A decomposition method (7) (8), minimum reserve requirement (including the unserved
was applied to solve the electricity system sub-problem and gas reserve) (9) (Ameli et al., 2019), capacity of power transmission
system sub-problem separately. lines (10), and power balance at each time step (11).
The OA approach, which is the fundamental technique in this
Pmin
i ≤ Pi,t ≤ Pmax
i , ∀i ∈ G − K, t ∈ T (1)
study, has been implemented in a few studies for dealing with
the Unit Commitment (UC) problem (Yang et al., 2017) with AC Pi,t ≥ σi,t · Pmin
i , ∀i ∈ K, t ∈ T (2)
power flow (Castillo et al., 2016) as well as security-constrained Pi,t + ri,t ≤ σi,t · Pmax
i , ∀i ∈ K, t ∈ T (3)
UC (Dai et al., 2016). The OA/ER decomposition method solves a up
σi,t́ − σi,t́−1 ≤ σi,t ; t́ = [t − Ŵi + 1, t − 1], ∀i ∈ K, t ∈ T (4)
binary relaxed primal problem [Non-Linear Problem (NLP)] and
a relaxed master problem (MILP). The OA/ER decomposition σi,t́−1 − σi,t́ ≤ 1 − σi,t ; t́ = [t − Ŵidown + 1, t − 1], ∀i ∈ K, t ∈ T
method copes with non-linear inequalities and consequently (5)
creates sequences of lower and upper bounds. In the OA/ER Pi,t − Pi,t−1 ≤ µi , ∀i ∈ K, t ∈ T (6)
approach, the non-linear equalities are converted to linear su
≥ Csu
wi,t i · (σi,t − σi,t−1 ), ∀i ∈ K, t ∈ T (7)
inequalities based on their associated Lagrangian multipliers. It su
wi,t ≥ 0, ∀i ∈ K, t ∈ T (8)
is worth mentioning that the integrated operation of gas and
electricity systems is solved by Successive Linear Programming K
X P
X XB
pump
(SLP) (Default solver of Xpress FICO, 2013) and investigated ri,t + rp,t + urt ≥ max Pmax
i +α· wind
Pb,t , ∀t ∈ T
i=1 p=1 i∈K
b=1
from different aspects in a few papers, such as Qadrdan et al.
(2017a) and Ameli et al. (2017d). The MINLP problem of (9)
line line,max
integrated operation of gas and electricity is non-convex, which Px,t ≤ Px , ∀x ∈ Le , t ∈ T (10)
implies the potential existence of multiple local optima. G B P
X X X pump,with pump,inj
Hence, in this paper, in order to deal with the complexity of the Pi,t + wind
Pb,t + Pp,t − Pp,t
above-mentioned model, a solution algorithm is implemented i=1 b=1 p=1
based on the OA/ER approach to model the integrated (11)
B
operation of gas and electricity systems. The efficiency of =
X
Peload
ecomp
+ Pb,t eshed
− Pb,t , ∀t ∈ T
b,t
this decomposition method is validated by comparing the
b=1
computational performance in terms of optimization time
and objective function with the SLP method. Furthermore, where
the role and value of the flexibility options, including DSR,
electricity storage, flexible gas plants, P2G, and multi-directional B set of Busbars
compressors, in the cost-effective operation of the integrated G set of generation units
systems for intact and contingency configurations (i.e., gas
supply interruption) on a 2030 GB system are investigated. K set of thermal generation units
In this regard, to evaluate the sensitivity of the renewable Le set of electricity transmission lines
penetration level to the flexibility options, different renewable
P set of pump-storage units
generation and gas supply development scenarios in the
presence of different installed capacities of flexibility options T time horizon
are defined to quantify the operation of the energy systems.
Pline,max
x maximum capacity of line x (MW)
To model the entire year, a demand clustering method is
developed to reduce the size of the optimization problem, Pmin
i minimum power of generation unit i (MW)
Frontiers in Energy Research | www.frontiersin.org 3 July 2020 | Volume 8 | Article 120
Ameli et al. Flexibility in Integrated Gas and Electricity Systems
Z t
Pmax maximum power of generation unit i (MW) Lx,t = Lx,t−1 + Qin out
x,τ −1 − Qx,τ −1 .dτ , ∀x ∈ Lg , t ∈ T
i
Pi,t power output of generation unit i at time t (MW) | t−1 {z }
ecomp ∂Lx,t
Pb,t power consumption of electrically driven
compressors at busbar b and time t (MW) (15)
Peload electrical power demand at busbar b and time t pmin
x ≤ px,t ≤ pmax
x , ∀x ∈ M, t ∈ T (16)
b,t
(MW)
eshed
Pb,t electrical load shedding at busbar b and time t (MW) !
supp
W
P
gstor,with gstor,inj
line
Px,t power flow of line x and time t (MW) Qx,t + Mflow
w,x · Qw,t + Qx,t − Qx,t
w=1
pump,with !
Pp,t power withdrawal of pump storage p to the grid at C
P comp comp
CP
−Ce
ecomp
time t (MW) + Mc,x · Qc,t − Mc,x · ζc,t
c=1 c=1
pump,inj
Pp,t power injection to pump storage p from the grid at
gload gen gshed
time t (MW) = Qx,t + Qx,t − Qx,t , ∀x ∈ M, t ∈ T
wind
Pb,t wind power feed to the grid at busbar b and time t (17)
(MW)
where
ri,t reserve provided through generation unit i at time t
(MW) C set of compressor nodes
pump
rp,t reserve provided through pump unit p at time t Ce set of electrically driven compressors
(MW)
Lg set of gas pipelines
urt unserved reserve at time t (MW)
su M set of nodes
wi,t start-up cost function of generation unit i at time t
(£) W set of flows
α proportion of wind for reserve requirements Dx diameter of the pipe x (mm)
comp
Ŵidown minimum up time of generation unit i (h) Mc,x compressor-node incident matrix of compressor c and
Ŵi
up
minimum down time of generation unit i (h) node x
ecomp
µi maximum ramp up/down power of generation unit Mc,x electrical compressor-node incident matrix of
i (MW/h) compressor c and node x
Csu start-up cost coefficient of generation unit i (£) Mflow
w,x flow-node incident matrix of flow w and node x
i
σi,t On/Off state of generation unit i at time t (1/0) Lx,t linepack within pipeline x at time t (m3 )
Lex length of pipe x (m)
2.2. Formulation of Gas System Operation
The operation of the gas system over the time horizon (t ∈ T ) is pmax
x upper bound of pressure at node x (Pascal)
modeled via constraints for gas flow along a pipe (12) (Osiadacz, pmin lower bound of pressure at node x (Pascal)
x
1987) (detailed formulation is presented in Ameli et al., 2019),
power consumption by the compressors (14), changes in the gas px,t pressure at node x and time t (Pascal)
comp
system linepack (15), minimum and maximum pressure limits Pc,t consumption power of compressor at node c and
(16), and gas balance at each node and time step (17). In order to time t (MW)
model a bi-directional gas flow, in the gas flow equation in (12),
avg 1.854 avg avg pdis
c,t discharge pressure of compressor at node c and time t
the term Qx,t is replaced by Qx,t · |Qx,t |0.854 (13). (Pascal)
2 2 18.43 Lex avg 1.854 pin pressure at in-take of pipeline x at time t (Pascal)
pin
x,t − pout
x,t = Qx,t , ∀x ∈ Lg x,t
pipe 2
(12)
ηx · D4.848
x
pout
x,t pressure at off-take of pipeline x at time t (Pascal)
2 2 18.43 Lex avg avg psuc
c,t suction pressure of compressor at node c and time t
pin
x,t − pout
x,t = Qx,t · |Qx,t |0.854 , (Pascal)
pipe 2
ηx 4.848
· Dx (13)
Qw,t volumetric gas flow w at time t (m3 /h)
∀x ∈ Lg , t ∈ T avg
Qx,t average gas flow through pipeline x at time t (m3 /h)
comp
!(1/β) Qc,t gas flow through compressor at node c and
comp
comp β.Qx,t pdis
x,t time t (m3 /h)
Px,t = comp . suc − 1 , ∀x ∈ C, t ∈ T (14)
η px,t Qin gas flow rate into pipeline x at time t (m3 /h)
x,t
Frontiers in Energy Research | www.frontiersin.org 4 July 2020 | Volume 8 | Article 120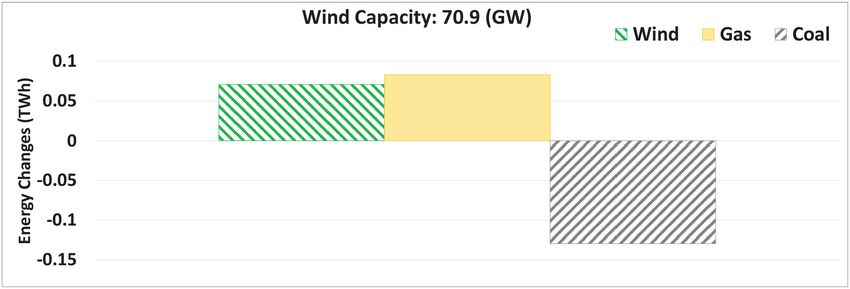
Ameli et al. Flexibility in Integrated Gas and Electricity Systems
gen estor,inj inj,max
Qx,t required gas flow for power generation at node x and Pb,t ≤ Pb , ∀b ∈ B, t ∈ T (20)
time t (m3 /h) estor,with
Pb,t ≤ Pwith,max
b , ∀b ∈ B, t ∈ T (21)
gload
Qx,t gas demand at node x and time t (m3 /h) estor
≤ Emax
Eb,t b , ∀b ∈ B, t ∈ T (22)
gstor,inj estor,inj
Qx,t injected gas to storage facility at node x and Pb,t estor
· ts + rb,t estor
· ts ≤ Eb,t−1 , ∀b ∈ B, t ∈ T (23)
time t (m3 /h)
K
X P
X B
X
gstor,with pump estor
Qx,t gas withdrawn from storage facility at node x and time ri,t + ri,t + rb,t + urt ≥ max Pmax
i
i∈K
t (m3 /h) i=1 i=1 b=1
gshed B
Qx,t gas load shedding at node x and time t (m3 /h) X
wind
+α· Pb,t , ∀t ∈ T (24)
Qout
x,t gas flow rate out of pipeline x at time t (m3 /h) b=1
supp
Qx,t gas flow rate of terminal at node x and time t (m3 /h)
β polytropic exponent of a gas compressor (4.70 MJ/m3 ) G
X B
X P
X
wind pump,with pump,inj
Pi,t + Pb,t + Pi,t − Pi,t
ηcomp efficiency of compressor units
i=1 b=1 i=1
pipe
ηx efficiency factor of pipe x (92%) B
X ecomp
∂Lx,t changes in linepack at pipeline x and time t (m3 ) = Peload
b,t + Pb,t
eshed
− Pb,t
b=1
ζc,t amount of gas tapped by a compressor at node c and
estor,with estor,inj
time t (m3 /h). −Pb,t + Pb,t , ∀t ∈ T
(25)
2.3. Coupling Components
The gas and electricity systems are coupled via gas-fired where
generators and electrically driven compressors. The electric
power consumption of electrically driven compressors and the estor
Eb,t energy level of electricity storage at busbar b and time
gas required for power generation are calculated by (14) and t (MWh)
(18), respectively. Emax maximum energy level of electricity storage at busbar
b
b (MWh)
K estor,with
X Pi,t Pb,t power withdrawal of electricity storage to the grid at
gen
Qx,t = νg Mconn
x,i · , ∀x ∈ M, t ∈ T (18) busbar b and time t (MW)
ηi
i=1 estor,inj
Pb,t power injection to electricity storage from the grid at
where busbar b and time t (MW)
Pmax,with maximum power withdrawal of electricity storage to
Mconn
x,i node-generator incident matrix at node x and b
the grid at busbar b (MW)
generation unit i
max,inj
ηi efficiency of generation unit i Pb maximum power injection to electricity storage from
the grid at busbar b (MW)
νg energy conversion coefficient estor
rb,t reserve provided through electricity storage at busbar
2.4. Flexibility Options Modeling b and time t (MW)
2.4.1. Battery Storage ηestor round-trip efficiency of electricity storage.
The operational characteristics of battery storage are modeled
using equations (19)–(23) (Pudjianto et al., 2014; Ameli et al., 2.4.2. Demand-Side Response (DSR)
2020). A round trip efficiency of 80% is assumed for the A set of generic DSR constraints are implemented in the
battery storage. In this case, the reserve requirements and power proposed model: the maximum amount of load that could be
balance equations of (9) and (11) are changed to (24) and (25), shifted (26), the change in load profile due to DSR (27), and
respectively. It is worth mentioning that, since the model is a temporal shifting of demand while considering potential losses
least-cost optimization and attempts to minimize the cost, when (28) through the presented efficiency, as shifting demand could
an optimal solution is achieved, no simultaneous charge and require an increase in overall energy consumption (Pudjianto
discharge is happening. et al., 2014). In the presence of DSR, (11) is replaced by (29).
dneg
estor,inj
estor
Eb,t estor
= Eb,t−1 estor,with
+ ηestor .Pb,t − Pb,t · ts, Pb,t ≤ ψ · Peload
b,t , ∀b ∈ B, t ∈ T (26)
dsr dneg dpos
∀b ∈ B, t ∈ T (19) Pb,t = Peload
b,t − Pb,t + Pb,t , ∀b ∈ B, t ∈ T (27)
Frontiers in Energy Research | www.frontiersin.org 5 July 2020 | Volume 8 | Article 120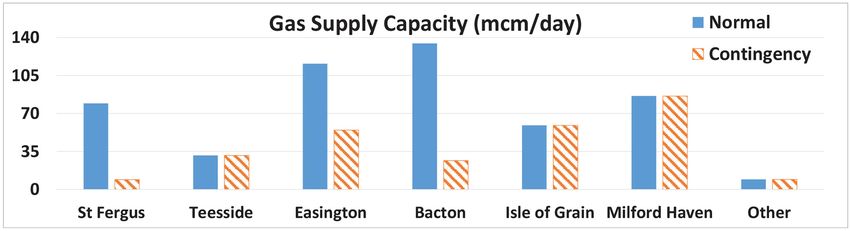
Ameli et al.                                                                                                                                Flexibility in Integrated Gas and Electricity Systems

        T
        X                             T
                                      X
                  dneg                        dpos
                Pb,t      ≤ ηdsr ·          Pb,t , ∀b ∈ B                                          (28)
        t=1                           t=1
        G
        X                 B
                          X                 P
                                            X
                                 wind                    pump,with            pump,inj
                Pi,t +          Pb,t  +                 Pi,t            − Pi,t
        i=1               b=1                 i=1
                                                                                                   (29)
             B
             X
                        dsr      ecomp         eshed
        =              Pb,t   + Pb,t        − Pb,t                 , ∀t ∈ T
             b=1

where
 dneg
Pb,t              reduction in electricity demand due to DSR at busbar
                  b and time t (MW)
 dpos
Pb,t              increase in electricity demand due to DSR at busbar b
                  and time t (MW)
 dsr
Pb,t              actual demand due to DSR at busbar b and
                  time t (MW)
ηdsr              DSR efficiency
ψ                 ratio of flexible electricity demand to total demand
2.4.3. Power-to-Gas (P2G)
Equations (30)–(32) describe the modeling of the P2G
option with an efficiency of 70% (ITM Power, 2013).
In (30), the energy content of hydrogen production
by electrolyzer to its equivalent natural gas volume is
                                                                                                               FIGURE 1 | Rolling planning structure of the gas and electricity system model.
presented. The amount of electricity used for hydrogen
production is limited to the capacity of the electrolyzer
(31). The amount of hydrogen that can be injected into
the gas pipelines cannot exceed the maximum allowance                                                         Mbus.node bus-node incident matrix of busbar b and node x
                                                                                                               b,x
(32). In this case, (11) and (17) are changed to (33) and                                                              max
(34), respectively.                                                                                           Pbe→H2         maximum capacity of electrolyser at busbar b (MW)
                                                                                                               e→H2
                               M
                               P                                      H →g
                                                                                                              Pb,t           injected electric power to electrolyser at busbar b and
     e→H2
    Pb,t  · ts = ν                   Mbus,node
                                      b,x      · ηP2G · Qx,t2                 , ∀b ∈ B, t ∈ T                                time t (MW)
                               x=1
                                                                                                   (30)       Qavailable
                                                                                                               x,t       available gas in node x and time t (mcm)
                                                                                                                H →g
                     max
                                                                                                              Qx,t2          injected hydrogen from electrolyser to node x and time
        e→H2
       Pb,t  ≤ Pbe→H2 , ∀b                    ∈ B, t ∈ T                                           (31)                      t (mcm)
        H →g
       Qx,t2 ≤  · Qavailable
                    x,t       ,               ∀x ∈ M, t ∈ T                                        (32)       ηP2G           electrolyser efficiency
       G
       X                 B
                         X                  P
                                            X                                                                νH2            constant to convert energy content of hydrogen to its
                                wind            pump,with    pump,inj
             Pi,t +            Pb,t  +         Pi,t       − Pi,t                                                             equivalent natural gas volume (90.9 m3 /MWh)
       i=1               b=1                i=1
                                                                                                   (33)                     maximum allowance of hydrogen injection to the
           B
           X                                                                                                                natural gas system
                                      ecomp               e→H2
       =               Peload
                        b,t + Pb,t
                                                 eshed
                                              − Pb,t   + Pb,t  , ∀t ∈ T
            b=1                                                                                               2.4.4. Multi-Directional Compressors
                                                                                                              Flexible multi-directional compressor stations can enhance
                                                    !                                                         flexibility and enable the gas system to deal with growing
           supp
                          W
                          P
                                                           gstor,with    gstor,inj

       Qx,t +                   Mflow
                                 w,x · Qw,t             + Qx,t        − Qx,t                                  variability through optimally redirecting the gas flow. Detailed
                          w=1                                                                                 modeling of these units is presented in Ameli et al. (2017d).
                                                                                           !
                        C
                        P      comp        comp
                                                           CP
                                                            −Ce
                                                                      ecomp
                +             Mc,x      · Qc,t       −               Mc,x         · ζc,t
                        c=1                                    c=1                                            3. MODELING METHODOLOGY

                  gload         gen         gshed                  H →g
       = Qx,t             + Qx,t − Qx,t                  − Qx,t2          , ∀x ∈ M, t ∈ T (34)                Figure 1 illustrates the structure of the model. The model
                                                                                                              minimizes the total operational cost of the gas and electricity
where                                                                                                         systems, simultaneously. In the gas system, (a) cost of supply, (b)

Frontiers in Energy Research | www.frontiersin.org                                                        6                                                  July 2020 | Volume 8 | Article 120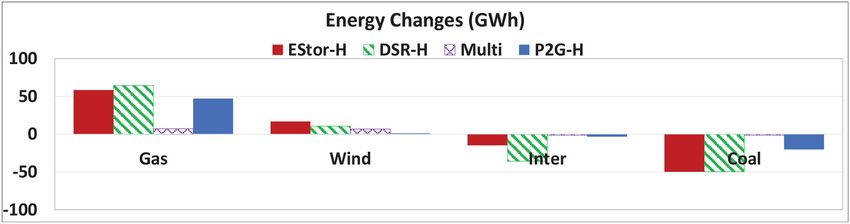
Ameli et al. Flexibility in Integrated Gas and Electricity Systems
FIGURE 2 | Twelve-hours output saving strategy.
cost of unserved gas demand, and (c) cost of storage facilities 3.1. Temporal Structure of the Model
and in the electricity system, (a) cost of power generation, (b) The operation of the gas and electricity systems is optimized
emission penalties, (c) unserved reserve, (d) cost of unserved using a day-ahead rolling planning approach. After solving the
electricity demand, and (e) start-up cost of the generators are optimization problem for each iteration (i.e., 24 h), solutions
taken into account (35). representing the state of the system, e.g., On/Off states of the
thermal generating units, linepack, and storage for the first
T X G K 12 h of the iteration are saved (Figure 2). This is carried out
X X
Z= Cfuel + Cvar
.P · ts + Cem in order to decrease the “end-of-optimization” effect and to
i .ei,t
i i i,t
t=1 i=1 i=1
model the storage facilities and unit commitment approach
more realistically. Afterward, the solution of the state variables
XB K
X is used in time-dependent constraints when considering the
+ Cur .urt · ts + Ceshed .Pb,t
eshed
· ts + su
wi,t following 24 h.
b=1 i=1
Y M
+
X supp
Cgas .Qx,t +
X gshed
Cgshed .Qx,t 3.2. OA/ER Decomposition Method
x=1 x=1 The MINLP problem of the integrated operation of gas and
Sg
electricity systems is solved using the OA/ER method. The
X structure of the OA/ER approach is presented in Figure 3.
gstor,with gstor,inj
+ Cgstor,with .Qx,t − Cgstor,inj .Qx,t
This structure represents the block “Total operational costs
x=1
minimization” in Figure 1.
(35)
In each iteration, an upper bound and a lower bound of the
where objective function are generated to solve the MILNP problem.
The upper bound is obtained from the primal problem, and
Cfuel
i fuel cost of generation unit i (£/MW)
the lower bound is obtained from the master problem. In the
Cvar
i variable cost of generation unit i (£/MW) primal problem, the binary variables are fixed. The upper bound
Ceshed cost of electrical load shedding (£/MW) and the Lagrangian multipliers associated with the non-linear
equality constraints are provided from the primal as input to
Cem cost of produced GHG emissions of generation unit i
the master problem. The master problem is derived through
(£/tons)
relaxing the non-linear equalities to linear inequalities via the use
Cgas cost of gas (£/mcm) of the Lagrangian multipliers obtained in the primal problem.
Cgstor,inj cost of gas injection to storage facilities (£/mcm) The master problem provides information about the lower bound
and the updated values for binary variables that will be used in
Cgstor,with cost of gas withdrawal from storage facilities (£/mcm)
the next iteration of the primal problem. The lower bound and
Cgshed cost of gas load shedding (£/MW) upper bound sequences converge as the iterations proceed. A
Cur cost of unserved reserve (£/MW) detailed description of this approach is presented in Ameli et al.
Y set of gas terminal nodes (2019).
For the sake of simplification, the sets of continuous variables
Sg set of gas storage facilities and integer variables in the objective function of the electricity
Z Objective function (£) system are defined as:
Frontiers in Energy Research | www.frontiersin.org 7 July 2020 | Volume 8 | Article 120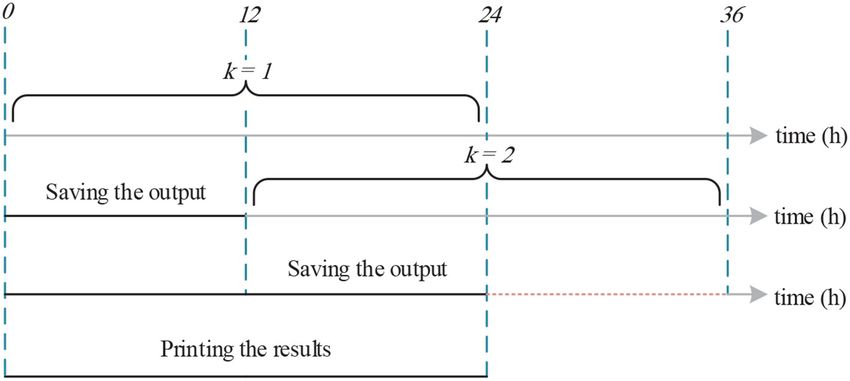
Ameli et al.                                                                                         Flexibility in Integrated Gas and Electricity Systems

 FIGURE 3 | Structure of OA/ER decomposition method.

              h                           i
                        eshed
           X = Pi,t , Pb,t    , ei,t , urt , ∀i ∈ G, b ∈ B, t ∈ T                                            avg
               su                                                                     S = pin      out
                                                                                              x,t , px,t , Qx,t , ∀x ∈ Lg , t ∈ T
           Y = wi,t   , ∀i ∈ K, t ∈ T.                                                      h                        i
                                                                                               comp
                                                                                        T = Qx,t , pdis          suc
                                                                                                          x,t , px,t , ∀x ∈ C, t ∈ T.
the sets of variables in the objective function of the gas system are
defined as:
                                                                            In this regard, in the objective function, f (X) is representing
              h                                               i             the cost of the continuous variables in the electricity system,
                supp   gstorwith    gstorinj            gshed               g(Y) is representing the cost of the integer variables in
           U = Qx,t , Qx,t       , Qx,t      , ∂Ll,t , Qx,t     ,
                                                                            the electricity system, h(U) is representing the cost of the
                ∀x ∈ M, l ∈ Lg , t ∈ T.                                     continuous variables in the gas system, q(S) is representing
                                                                            the gas flow equation, and r(T) is representing the compressor
and the sets of variables in (12) and (14) are presented by:                power consumption.

Frontiers in Energy Research | www.frontiersin.org                      8                                             July 2020 | Volume 8 | Article 120
Ameli et al. Flexibility in Integrated Gas and Electricity Systems
3.2.1. Primal Problem h i h iT
su are given as (ρ)
In the primal problem, the binary variables of wi,t 8q(S) · q S∗(ρ) + ∇q S∗(ρ) · S(ρ) − S∗(ρ)
fixed values. Therefore, the MINLP function in (35) is converted (40)
to NLP (36). For the first iteration, initial values based on the ≤ 0, ∀ρ ∈ F
iT
optimization (using Xpress SLP solver FICO, 2013) described in (ρ) ∗(ρ)
h
∗(ρ)
i h
(ρ) ∗(ρ)
Ameli et al. (2017d), were given as the values for g(Y∗ )(1) . The * 8r(T) · r T + ∇r T · T −T
(41)
represents the values that are input to the problem. This selection
≤ 0, ∀ρ ∈ F
of initial values makes the convergence process faster. For the
next iteration of the primal problem, the fixed values of binary In each iteration, the objective function of the master problem
variables are provided subsequently by the master problem. should be between the current objective function of the primal
(upper bound) and the previous objective value of the master
(lower bound) in order to proceed with convergence of the
(ρ)
Zprimal = f X(ρ) + h U(ρ) + g Y∗(ρ) , ∀ρ ∈ F (36)
problem (42). The optimization is terminated when (43) is
met or the master problem is infeasible, where ǫ is the
where F is the total number iterations. At iteration ρ, if the
convergence bound.
primal problem is feasible, then information on the continuous
variables in the gas system h(U∗(ρ) ) and in the electricity system
f (X∗(ρ) ) is provided as input to the master problem. Additionally, (ρ−1) (ρ) (ρ)
Zmaster ≤ Zmaster ≤ Zprimal , ∀ρ ∈ F (42)
(ρ)
the Lagrangian multipliers of the non-linear equations λq(S) and (ρ) (ρ)
(ρ) Zmaster − Zprimal ≤ ǫ, ∀ρ ∈ F (43)
λr(T) are calculated and given as input to the master problem. If
the primal problem is infeasible, a feasibility problem considering
penalties would be solved to identify the feasible points. 4. CASE STUDIES
(ρ) (ρ)
The elements of the 8q(S) and 8r(T) matrices are presented
in (37). These matrices provide information regarding the sign The operation of a GB gas and electricity system with
of the relaxed inequalities of the non-linear equations in the large penetration of wind generation is modeled for twelve
master problem. representative days characterizing possible conditions for net
electricity demand within the year in 2030.
(ρ)
The efficiency of the OA/ER decomposition method approach
−1 if λq(S) < 0
for solving the optimal operation problem of gas and electricity
systems is assessed by comparing it to the commercial XPRESS
(ρ) (ρ) SLP solver.
φq(S) = +1 if λq(S) > 0
The efficacy of the flexibility options, namely (a) battery
0 if λ(ρ) = 0
storage (EStor), (b) demand-side response (DSR), (c) Power-
q(S) to-Gas (P2G), and (d) multi-directional compressors (Multi),
(ρ)
−1 if λr(T) < 0 to address electricity supply-demand balancing challenges is
evaluated and compared to a reference (Ref ) case in which
(ρ) (ρ) no particular measure was considered to facilitate efficient
and φr(T) = +1 if λr(T) > 0 (37)
integration of a large penetration of renewable generation.
(ρ)
0 if λr(T) = 0
3.2.2. Master Problem TABLE 1 | Generation mix in GB 2030.
The master problem formulation is presented by equations (38)- Generation technology Capacity Electricity cost
(43). In (38), the objective function of the master problem is
(GW) (£/MWh)
presented. In (39), variable ξ is introduced to constrain the
linearized objective function of the primal at the solution points Wind 47.3 –
of continuous variables. However, since the objective function is Gas 33.7 2.2 + locational gas price
linear, it can be expressed as in (39). Solar 30.5 –
Interconnection 18.2 100
(ρ) Nuclear 10.1 7
Zmaster = g Y(ρ) + ξ , ∀ρ ∈ F (38)
Pumped storage 4.8 variable
ξ ≥ f X∗(ρ) + h U∗(ρ) , ∀ρ ∈ F (39) Coal 4.5 21.2
Biomass 3.8 70
The non-linear equalities of gas flow equation (12) and Hydro 1.3 –
compressor power consumption (14) are relaxed to inequalities Other renewables 3.1 –
of (40) and (41), respectively. Other thermals 2 80
Frontiers in Energy Research | www.frontiersin.org 9 July 2020 | Volume 8 | Article 120Ameli et al. Flexibility in Integrated Gas and Electricity Systems
4.1. GB Gas and Electricity Systems v
u T
uX 2
The power generation mix in this study is shown in Table 1 net − Pnet , k = N , ∀i, j ∈ H
1i,j = t Pi,t j,t pr (44)
and is based on the year 2030 of the “Gone Green” scenario
t=1
of the National Grid (National Grid Plc, 2016). For gas-fired
plants, variation in the cost of electricity production (2.2 /MWh)
depending on the fuel price is taken into account. • Step 2: Finding the two closest profiles.
The updated version of the GB 62-node National
Transmission System (NTS) gas network (Qadrdan et al.,
2010) and a 29-busbar electricity transmission system (Ameli ∀i, j ∈ H : 1i∗ ,j∗ = mini6=j 1i,j (45)
et al., 2017d) are modeled. The data presented in Ameli et al.
(2017d) are used as the base for hourly wind generation
and non-electric gas demand in 2030. The gas demand for • Step 3: Comparing the frequency of occurrence of the
power generation is determined endogenously by (18). The profiles in order to delete the profile with less frequency.
electricity peak demand is assumed to be 85 GW, which
• Step 4: The frequency of the deleted profile is added to the
is driven by the electrification of segments of the heat and
closest profile, and k = k − 1.
transport sectors.
In the optimization problems of integrated operation
if ̟i∗ ≥ ̟j∗ → profile j∗ is deleted
of gas and electricity systems, about 43,000 variables
including 3,500 binary variables are determined in → ̟i = ̟i∗ + ̟j∗ ,
each 24 h. if ̟ < ̟
i∗ j∗ → profile i∗ is deleted
→ ̟j = ̟i∗ + ̟j∗ .
4.2. Demand Clustering Strategy
Due to the complexity of modeling the integrated operation of
gas and electricity systems, it is computationally challenging to • Step 5: If k = Ndp then terminate. Otherwise, return to
analyze the system for an entire year with an hourly time step step 1.
(8,760 time steps in total). Instead, the net electricity demand
profiles (i.e., renewable electricity generation deducted from where,
electricity demand) for a number of characteristic days are
H set of the net demand profiles
selected, which represent the combination of electricity demand
net
Pt,i net demand at time t of profile i (MW)
and renewable electricity generation. The clustering algorithm is
presented in this section. At the beginning for each day, an equal 1i,j distance between profile i and j
1
weight of 365 is considered. The net demand clustering algorithm
is described as follows. Npr number of net demand profiles
̟i frequency of profile i
• Step 1: Calculating the distance between different net
demand profiles through (44), where k is the counter. Ndp number of desired profiles
FIGURE 4 | Net demand profiles after the demand clustering strategy.
Frontiers in Energy Research | www.frontiersin.org 10 July 2020 | Volume 8 | Article 120Ameli et al. Flexibility in Integrated Gas and Electricity Systems
TABLE 2 | Representative days for the entire year. In addition, the solution of the optimization (i.e., operational
cost) was slightly improved. A summary of the computational
Representative day Actual day Frequency
characteristics for a day is presented in Table 3.
1 16 3
2 18 7
5.2. Performance of Flexibility Options in
3 96 3
4 185 1
the Electricity System
5 201 125
5.2.1. Impacts of Increased Flexibility on Generation
6 205 28
Dispatch
7 232 7
Figure 5 shows how the use of flexibility options affects the
electricity outputs of different generation technologies through
8 241 3
the change in electricity production with respect to the Ref
9 278 38
Case. The application of flexibility options enhances the ability
10 294 53
of the system to absorb more electricity from renewable
11 338 85
sources. Consequently, due to more electricity being supplied
12 355 12
from renewables, compared to the Ref case, the power from
the expensive option (interconnection) as well as coal (i.e.,
TABLE 3 | Computational performance for optimization of a day through different characterized by high emissions) is reduced. Furthermore, the
solving approaches. share of gas-fired plants increases to complement variable
renewable generation. In Figure 5A, the significant role of high
SLP OA/ER
installation of DSR in accommodating more gas-fired plants is
Computational time (min) 12.8 8.0 presented. This is due to the fact that, since the wind penetration
Operational cost (£ m) 148.1 147.9 is low, gas plants play the main part in supplying demand, and by
shifting the demand optimally, around 5 TWh more electricity
is provided by the gas-fired plants. Due to the small penetration
of wind, electricity storage and P2G have a small impact on
In Figure 4, the net electricity demand profiles selected by the the electricity produced by different types of generators. In
clustering algorithm are presented. The actual days in the year Figure 5B, although more electricity is absorbed by the grid,
and the frequency of occurrence of the representative profiles the gas plants are generating more. This is due to the fact
are provided in Table 2. Some of the profiles that occur less that according to (23), the electricity storage is contributing
frequently pose unique characteristics, e.g., Day 4 occurs only to providing a reserve, and hence gas plants participate more
once in the whole year and represents a summer day in which in the supply-demand balance. Figure 5C shows that, due to
a significant amount of electricity is generated by RES; therefore, the flexibility provided by electricity storage through optimal
net electricity demand is negative during most hours of the day. charging and discharging, the contribution of gas-fired plants
and hydro is reduced. In P2G cases, the increased absorption of
4.3. Description of Flexibility Case Studies electricity from wind is primarily used for hydrogen production.
To investigate the role and value of the flexibility options in Furthermore, to support the operation of the gas system during
supporting the cost-effective operation of gas and electricity peak periods, up to 2.6 TWh/yr additional electricity, mainly
systems, different combinations of available flexibility and level of from hydro (i.e., limited in the Ref case because of transmission
wind generation penetration are considered. For each flexibility congestion), is used for producing and injecting hydrogen into
option, two different levels considered: low 4 GW installed the gas system. As can be seen in Figures 5B,C, more electricity
capacity and high 12 GW installed capacity. For wind generation, from hydrogen-based CCGTs is produced compared to the Ref
three different levels of installed capacity, i.e., 23.6, 47.3, and 70.9 case (up to 0.8 TWh/yr), which leads to less emissions from
GW, are assumed. gas-fired plants.
It is shown that when increasing the penetration level of
5. RESULTS AND DISCUSSIONS wind to the system, electricity storage plays a significant role
in changing the power dispatch from different technologies.
5.1. Computational Performance of the As presented in Figure 5A, this is demonstrated by integrating
OA/ER Approach more wind into the system while decreasing the electricity from
The optimization problem was run on a computer with a coal and interconnection and reducing the share of renewables,
3.20 GHz Intel(R) Xeon(R) processor and 16 GB of RAM. and there are decreases in all other generation technologies at
The computational performance of the proposed OA/ER higher shares of wind. For other flexibility options for all wind
decomposition method was benchmarked against the SLP penetration levels, the generation from wind, gas-fired, and hydro
algorithm of Xpress solver (FICO, 2013). The employment of plants increases, while the production of interconnectors and coal
the OA/ER decomposition method significantly improved the plants decreases. In P2G cases, the hydrogen produced through
efficiency of the solution algorithm, achieving a nearly 40% the excess of wind is injected into the gas pipelines as well as being
reduction in the computation time compared to the SLP method. used as a fuel for gas-fired plants.
Frontiers in Energy Research | www.frontiersin.org 11 July 2020 | Volume 8 | Article 120Ameli et al. Flexibility in Integrated Gas and Electricity Systems FIGURE 5 | Annual energy changes for different installed capacities of wind (compared to the Ref case): (A) 23.6 GW, (B) 46.7 GW, and (C) 70.9 GW. 5.2.2. Wind Curtailment 5.2.3. Operational Costs As expected, the increased level of flexibility reduces wind In Figure 6B, the annual gas and electricity operational curtailment. The highest reductions in wind curtailment are cost savings compared to the Ref case are presented for achieved in the P2G and EStor cases. The annual reduction of different levels of wind penetration and the application of wind curtailment is presented in Figure 6A. different flexibility options. The total operational costs of Frontiers in Energy Research | www.frontiersin.org 12 July 2020 | Volume 8 | Article 120
Ameli et al.                                                                                                       Flexibility in Integrated Gas and Electricity Systems

 FIGURE 6 | (A) Cumulative wind curtailment reduction, and (B) annual operational cost savings of gas and electricity systems compared to the Ref case.

TABLE 4 | Total operational costs in the Ref case.                                    is required by the system operator. In a case where demand
                                                                                      satisfaction constraints should be considered, the cost savings
Wind penetration (GW)                                              Cost (£ bn)
                                                                                      would be lower.
23.6                                                                   30.9
47.3                                                                   29.3           5.3. Performance of Flexibility Options in
70.9                                                                   28.2           the Gas System
                                                                                      If flexibility in the gas system is enhanced through multi-
                                                                                      directional gas compressors, it is possible to deliver more gas to
gas and electricity systems for the Ref case are shown in                             the gas plants. Consequently, the supply through coal decreases,
Table 4.                                                                              and therefore the overall emissions and the total operational costs
    The value of flexibility options increases when the penetration                   of the systems reduce. Figure 7 demonstrates that enhancing the
of wind generation increases. In DSR cases, due to the                                flexibility of the gas infrastructure in the integrated operation of
flexibility provided, demand is shifted mainly from peaks to                          gas and electricity systems increases the generation by gas-fired
off-peaks, which results in a significant decrease in electricity                     power plants and reduce wind curtailment, while the production
importation (Figure 5). As a result, the largest cost savings                         from coal characterized by high emissions reduces. This delivers
are achieved in DSR cases. Overall, the enhanced flexibility                          prevention of about 300 kilotonnes of CO2 production.
provided by DSR, electricity storage, and P2G increases the                               It is worth mentioning that since there is enough gas supply
efficiency of system operation by reducing the challenges caused                      to the system, under normal conditions, the multi-directional gas
by RES.                                                                               compressors do not play a major role in improving the operation
    It is worth mentioning that in the DSR modeling, the demand                       of the system. This flexibility can enhance the energy system
satisfaction constraints (i.e., related to customer behavior) is not                  resiliency. Therefore, to highlight the role of multi-directional
taken into account (Pudjianto et al., 2014), and it is assumed                        gas compressors, a stressed condition of the energy system
that the part of demand that is flexible can be shifted when it                       considering two characteristics is derived: (a) when an increase

Frontiers in Energy Research | www.frontiersin.org                               13                                                 July 2020 | Volume 8 | Article 120
Ameli et al. Flexibility in Integrated Gas and Electricity Systems
FIGURE 7 | Change in annual electricity generation in the Multi case in respect to the Ref case.
A
B
FIGURE 8 | (A) Electricity demand and available wind, and (B) gas terminal capacity on the day of supply interruption (other refers to Barrow, Burton point,
and Theddlethrope).
in demand in morning hours coincides with a reduction in wind interruption and therefore reduces the need to import electricity
generation, as presented in Figure 8A, and (b) when gas supply (which is assumed to be at highest cost) or coal plants, which are
capacities in the St Fergus, Bacton, and Easington gas terminals characterized by high emissions. As seen in Figure 9, electricity
are constrained (Figure 8B). from interconnectors and coal is reduced by up to 36 and 50
GWh compared to the Ref case in the two stress conditions,
5.3.1. Power Dispatch respectively. Hence, more accommodation of wind energy is
The employment of flexibility options enables an effective facilitated, which leads to cost savings for both natural gas and
balancing of electricity supply and demand during gas supply power systems.
Frontiers in Energy Research | www.frontiersin.org 14 July 2020 | Volume 8 | Article 120Ameli et al. Flexibility in Integrated Gas and Electricity Systems FIGURE 9 | Change in the electricity in presence of different flexibility options during the day of gas supply interruption compared to the Ref case. 5.3.2. Gas Compressor Performance injection therefore cannot help significantly to obviate the gas Multi-directional compressors play a key role in mitigating the system congestion. impacts of gas supply interruption by redirecting gas flows Overall, the modeling demonstrates that the investment in and maintaining gas supply to gas-fired power plants that flexibility in gas infrastructure will be driven by increased would be otherwise be affected by the supply interruption. requirements for flexibility in the electricity system. This will As is presented in Figure 10A, in the Multi case, especially require closer coordination of operation and investment in both in the morning hours when a demand increase and a systems in order to facilitate cost-effective de-carbonization of sudden wind drop coincide, the compressors operate more the electricity system. frequently to redirect the gas flow direction. In other cases, On the other hand, the case studies indicate that enhancing the compressor performance is almost the same as the Ref flexibility in gas and electricity networks could reduce case, as the changes are small. This is due to the fact that, in the dependency between gas and electricity systems by these cases, the flexibility of the gas system infrastructure is addressing demand-supply balancing challenges as well as not enhanced. gas supply interruptions. 5.3.3. Locational Marginal Price of Gas 6. CONCLUSION As was discussed, the large penetration of RES increases the interaction of gas and electricity networks. Therefore, changes An outer approximation with equality relaxation method is in the level of wind generation will significantly influence the proposed to effectively solve the optimization problem of the operation of the gas system. In the case of no interruption operation of integrated gas and electricity systems. The modeling of gas supply, since there is still enough gas to meet the approach developed is applied to demonstrate the benefits of an demand, gas Locational Marginal Prices (LMP) are around integrated approach to the operation of interdependent gas and the gas price (0.35 £/cm). The gas system security will be electricity systems. impacted, particularly during interruption in the gas supply In addition, the modeling indicates that significant cost system. The index considered for the gas system security is savings and corresponding emissions reduction can be achieved the amount of non-served gas demand. In the Ref case, the through enhancing the flexibility of the gas infrastructure. The gas supply interruption causes a loss of 0.033 mcm of gas value of different flexibility options (battery storage, demand- demand. This results in a significant increase in the gas LMP, side response, power-to-gas, and multi-directional compressors) especially in Scotland after 11:00 a.m., when both gas and for the operation of gas and electricity systems were investigated electricity demand are high (Figure 10B). The gas LMP in for various scenarios representing different levels of wind Scotland in the Ref case after 11 h is equal to the assumed generation penetration. It was demonstrated that flexibility Value of Lost Load (VoLL) (11.1 £/cm Chaudry et al., 2008). options would enhance the ability of the system to accommodate The use of flexibility options prevents gas load shedding during wind generation and simultaneously reduce the operating cost of the supply interruption. As is shown in Figure 10B, the use the gas and electricity systems by up to 21%. of DSR and battery storage minimize the impact of the gas It was demonstrated that during sudden drops in wind supply interruption on the gas LMP (0.46 £/cm). In the Multi generation as well as gas supply interruptions, the flexibility case, the gas LMP is 0.72 £/cm, which indicates the efficacy of options play important roles in enhancing the efficiency of multi-directional compressors in gas delivery to demand centers. system operation and the security of gas supply. The ability P2G prevents gas load shedding by producing hydrogen and of the flexibility options to reduce the interaction between gas injecting it into the gas system. However, the LMPs are high and electricity networks in an integrated strategy highlights (3.4 £/cm) given that the wind generation is low and hydrogen the importance of reforming the current regulatory and Frontiers in Energy Research | www.frontiersin.org 15 July 2020 | Volume 8 | Article 120
Ameli et al.                                                                                                  Flexibility in Integrated Gas and Electricity Systems

 FIGURE 10 | (A) Change in power consumed by the gas compressors on the day of supply interruption compared to the Ref case, and (B) gas LMP in Scotland on
 the day of supply interruption.

market framework to coordinate operation and investment in                        AUTHOR CONTRIBUTIONS
both systems for a cost-effective transition to lower-carbon
energy systems.                                                                   HA conducted the modelings and run the optimization as well as
    Future work will involve modeling of investment in different                  writing the paper. MQ and GS provided the guidance as well as
flexibility options and emission constraints in order to identify                 contributing in writing the paper. All authors contributed to the
the optimal portfolio of these technologies that would achieve                    article and approved the submitted version.
carbon targets at minimum whole-system costs. Furthermore,
integrated analysis of local and national infrastructures will be                 FUNDING
important for considering alternative evolution pathways of the
gas and electricity infrastructures.                                              The authors gratefully acknowledge the SysFlex project, which
                                                                                  has received funding from the European Union’s Horizon
DATA AVAILABILITY STATEMENT                                                       2020 research and innovation program under award number
                                                                                  773505 as well as the EPSRC-funded program Integrated
The datasets generated for this study are available on request to                 Development of Low-Carbon Energy Systems (IDLES) under
the corresponding author.                                                         award number EP/R045518/1.

Frontiers in Energy Research | www.frontiersin.org                           16                                                July 2020 | Volume 8 | Article 120
Ameli et al. Flexibility in Integrated Gas and Electricity Systems
REFERENCES Ongsakul, W., and Petcharaks, N. (2004). Unit commitment by enhanced
adaptive lagrangian relaxation. IEEE Trans. Power Syst. 19, 620–628.
Akhtari, M. R., and Baneshi, M. (2019). Techno-economic assessment and doi: 10.1109/TPWRS.2003.820707
optimization of a hybrid renewable co-supply of electricity, heat and Osiadacz, A. (1987). Simulation and Analysis of Gas Networks. Houston, TX: Gulf
hydrogen system to enhance performance by recovering excess electricity Publishing Company.
for a large energy consumer. Energy Convers. Manag. 188, 131–141. Pudjianto, D., Aunedi, M., Djapic, P., and Strbac, G. (2014). Whole-systems
doi: 10.1016/j.enconman.2019.03.067 assessment of the value of energy storage in low-carbon electricity systems.
Ameli, H., Abbasi, E., Ameli, M. T., and Strbac, G. (2017a). A fuzzy- IEEE Trans. Smart Grid 5, 1098–1109. doi: 10.1109/TSG.2013.2282039
logic based control methodology for secure operation of a microgrid in Qadrdan, M., Ameli, H., Strbac, G., and Jenkins, N. (2017a). Efficacy of options to
interconnected and isolated modes. Int. Trans. Electric. Energy Syst. 27:e2389. address balancing challenges: integrated gas and electricity perspectives. Appl.
doi: 10.1002/etep.2389 Energy 190, 181–190. doi: 10.1016/j.apenergy.2016.11.119
Ameli, H., Ameli, M. T., and Hosseinian, S. H. (2017b). Multi-stage frequency Qadrdan, M., Chaudry, M., Wu, J., Jenkins, N., and Ekanayake, J. (2010). Impact
control of a microgrid in the presence of renewable energy units. Electric Power of a large penetration of wind generation on the GB gas network. Energy Policy
Comp. Syst. 45, 159–170. doi: 10.1080/15325008.2016.1247389 38, 5684–5695. doi: 10.1016/j.enpol.2010.05.016
Ameli, H., Qadrdan, M., and Strbac, G. (2017c). Techno-economic assessment of Qadrdan, M., Cheng, M., Wu, J., and Jenkins, N. (2017b). Benefits of demand-side
battery storage and power-to-gas: a whole-system approach. Energy Proc. 142, response in combined gas and electricity networks. Appl. Energy 192, 360–369.
841–848. doi: 10.1016/j.egypro.2017.12.135 doi: 10.1016/j.apenergy.2016.10.047
Ameli, H., Qadrdan, M., and Strbac, G. (2017d). Value of gas network Sardou, I. G., Khodayar, M. E., and Ameli, M. T. (2018). Coordinated operation
infrastructure flexibility in supporting cost effective operation of power of natural gas and electricity networks with microgrid aggregators. IEEE Trans.
systems. Appl. Energy 202, 571–580. doi: 10.1016/j.apenergy.2017.05.132 Smart Grid 9, 199–210. doi: 10.1109/TSG.2016.2547965
Ameli, H., Qadrdan, M., and Strbac, G. (2019). Coordinated operation strategies Shabanpour-Haghighi, A., and Seifi, A. R. (2015). Simultaneous integrated optimal
for natural gas and power systems in presence of gas-related flexibilities. IET energy flow of electricity, gas, and heat. Energy Convers. Manag. 101, 579–591.
Energy Syst. Integr. 1, 3–13. doi: 10.1049/iet-esi.2018.0047 doi: 10.1016/j.enconman.2015.06.002
Ameli, H., Qadrdan, M., Strbac, G., and Ameli, M. T. (2020). Investing in flexibility Sheikhi, A., Bahrami, S., and Ranjbar, A. M. (2015). An autonomous demand
in an integrated planning of natural gas and power systems. IET Energy Syst. response program for electricity and natural gas networks in smart energy hubs.
Integr. 2, 101–111 doi: 10.1049/iet-esi.2019.0065 Energy 89, 490–499. doi: 10.1016/j.energy.2015.05.109
Castillo, A., Laird, C., Silva-Monroy, C. A., Watson, J. P., and O’Neill, R. P. (2016). Sirvent, M., Kanelakis, N., Geißler, B., and Biskas, P. (2017). Linearized model for
The unit commitment problem with ac optimal power flow constraints. IEEE optimization of coupled electricity and natural gas systems. J. Mod. Power Syst.
Trans. Power Syst. 31, 4853–4866. doi: 10.1109/TPWRS.2015.2511010 Clean Energy 5, 364–374. doi: 10.1007/s40565-017-0275-2
Chaudry, M., Jenkins, N., and Strbac, G. (2008). Multi-time period combined gas Troy, N., Flynn, D., and O’Malley, M. (2012). Multi-mode operation of combined-
and electricity network optimisation. Electric Power Syst. Res. 78, 1265–1279. cycle gas turbines with increasing wind penetration. IEEE Trans. Power Syst. 27,
doi: 10.1016/j.epsr.2007.11.002 484–492. doi: 10.1109/TPWRS.2011.2163649
Chung, C. Y., Yu, H., and Wong, K. P. (2011). An advanced quantum-inspired Wu, Q. H., Qin, Y. J., Wu, L. L., Zheng, J. H., Li, M. S., Jing, Z. X., et al. (2019).
evolutionary algorithm for unit commitment. IEEE Trans. Power Syst. 26, Optimal operation of integrated energy systems subject to the coupled demand
847–854. doi: 10.1109/TPWRS.2010.2059716 constraints of electricity and natural gas. CSEE J. Power Energy Syst. 6, 1–14.
Correa-Posada, C. M., and Sanchez-Martin, P. (2015). Integrated power and doi: 10.17775/CSEEJPES.2018.00640
natural gas model for energy adequacy in short-term operation. IEEE Trans. Yang, L., Jian, J., Dong, Z., and Tang, C. (2017). Multi-cuts outer approximation
Power Syst. 30, 3347–3355. doi: 10.1109/TPWRS.2014.2372013 method for unit commitment. IEEE Trans. Power Syst. 32, 1587–1588.
Correa-Posadaa, C. M., and Sanchez-Martin, P. (2014). Gas network optimization: doi: 10.1109/TPWRS.2016.2584862
a comparison of piecewise linear models. Chem. Eng. Sci. 30, 1–24. Yang, Z., Gao, C., and Zhao, M. (2019). Coordination of integrated natural
Dai, C., Wu, L., and Wu, H. (2016). A multi-band uncertainty set based robust gas and electrical systems in day-ahead scheduling considering a novel
scuc with spatial and temporal budget constraints. IEEE Trans. Power Syst. 31, flexible energy-use mechanism. Energy Convers. Manag. 196, 117–126.
4988–5000. doi: 10.1109/TPWRS.2016.2525009 doi: 10.1016/j.enconman.2019.05.109
Deane, J., Ciaráin, M. O., and Gallachóir, B. O. (2017). An integrated gas and Zeng, Q., Fang, J., Li, J., and Chen, Z. (2016). Steady-state analysis of
electricity model of the EU energy system to examine supply interruptions. the integrated natural gas and electric power system with bi-directional
Appl. Energy 193, 479–490. doi: 10.1016/j.apenergy.2017.02.039 energy conversion. Appl. Energy 184, 1483–1492. doi: 10.1016/j.apenergy.2016.
FICO (2013). Fico Xpress Optimisation Suite. San Jose, CA. 05.060
Floudas, C. A. (1995). Nonlinear and Mixed-Integer Optimization: Fundamentals Zhang, X., Shahidehpour, M., Alabdulwahab, A., and Abusorrah, A. (2016).
and Applications. Oxford, UK: Oxford University Press. Hourly electricity demand response in the stochastic day-ahead scheduling of
Gil, M., Duenas, P., and Reneses, J. (2016). Electricity and natural gas coordinated electricity and natural gas networks. IEEE Trans. Power Syst. 31,
interdependency: comparison of two methodologies for coupling large market 592–601. doi: 10.1109/TPWRS.2015.2390632
models within the european regulatory framework. IEEE Trans. Power Syst. 31, Zlotnik, A., Roald, L., Backhaus, S., Chertkov, M., and Andersson, G.
361–369. doi: 10.1109/TPWRS.2015.2395872 (2017). Coordinated scheduling for interdependent electric power
He, C., Wu, L., Liu, T., and Shahidehpour, M. (2017). Robust co-optimization and natural gas infrastructures. IEEE Trans. Power Syst. 32, 600–610.
scheduling of electricity and natural gas systems via admm. IEEE Trans. Sustain. doi: 10.1109/TPWRS.2016.2545522
Energy 8, 658–670. doi: 10.1109/TSTE.2016.2615104
Hu, Y., Lian, H., Bie, Z., and Zhou, B. (2017). Unified probabilistic Conflict of Interest: The authors declare that the research was conducted in the
gas and power flow. J. Mod. Power Syst. Clean Energy 5, 400–411. absence of any commercial or financial relationships that could be construed as a
doi: 10.1007/s40565-017-0284-1 potential conflict of interest.
ITM Power (2013). Report and Financial Statements. Technical report, Sheffield,
United Kingdom. Copyright © 2020 Ameli, Qadrdan and Strbac. This is an open-access article
Nasri, A., Kazempour, S. J., Conejo, A. J., and Ghandhari, M. (2016). distributed under the terms of the Creative Commons Attribution License (CC BY).
Network-constrained ac unit commitment under uncertainty: a The use, distribution or reproduction in other forums is permitted, provided the
benders decomposition approach. IEEE Trans. Power Syst. 31, 412–422. original author(s) and the copyright owner(s) are credited and that the original
doi: 10.1109/TPWRS.2015.2409198 publication in this journal is cited, in accordance with accepted academic practice.
National Grid Plc (2016). UK Future Energy Scenarios, GB Gas and Electricity No use, distribution or reproduction is permitted which does not comply with these
Transmission. Technical Report July, Warwick, United Kingdom. terms.
Frontiers in Energy Research | www.frontiersin.org 17 July 2020 | Volume 8 | Article 120You can also read