EBook Design Ideas and Tradeoffs for 5G Infrastructure - Qorvo
←
→
Page content transcription
If your browser does not render page correctly, please read the page content below

eBook

Design Ideas and Tradeoffs
for 5G Infrastructure
                               October 2019

     S P O N S O R E D   B Y
Table of Contents

3       Introduction
        Pat Hindle
        Microwave Journal, Editor

4       The Challenges of 5G Network Densification
        Luke Getto
        Microlab

7       Microwave Will Drive the Development of 5G
        Tamas Madarasz
        Nokia, Espoo, Finland

11      RF Front-end Technology and Tradeoffs for 5G mmWave
        Fixed Wireless Access
        Bror Peterson
        Qorvo, Greensboro, NC

17      Optimizing the Perennial Doherty Power Amplifier
        Gareth Lloyd
        Rohde & Schwarz, Munich, Germany

                                           2
Introduction

                    Design Ideas and Tradeoffs for 5G Infrastructure

    As 5G rolls out, there are many infrastructure challenges to design the critical hardware that is
needed to enable 5G to deliver on its promise. From fixed wireless access to small cells, many design
challenges will need to be overcome to achieve the performance requirements for 5G NR. This eBook
addresses some of the challenges with design solutions that were published in Microwave Journal.

    In the first article, Microlab looks at the challenges and solutions for network densification as small
cells will need to be deployed in massive numbers to achieve 5G NR goals. The second article is written
by Nokia about how microwave solutions are required to drive 5G deployment. It covers various scenarios
and how microwave solutions can address each. 5G Fixed Wireless Access technology is already being
deployed using mmWave frequencies, but there are many design challenges such as power, scan angle,
thermal heating and efficiency. Qorvo discusses the various technology tradeoffs for designing FWA
arrays including beamforming techniques, front-end components and semiconductor materials. Lastly,
Rohde & Schwarz looks at optimization techniques for Doherty power amplifier design as these are a
prime choice for basestation applications.

    This eBook aims to educate design engineers on some of the important challenges for 5G
infrastructure and some solutions to address them. Various tradeoffs are reviewed so that designers
can optimize appropriately as they create new products. The eBook is available at no cost thanks to our
sponsors RFMW and Qorvo. We hope that this spurs some key insights into your next design.

Pat Hindle, Microwave Journal Editor

                                                     3
The Challenges
of 5G Network
Densification
Luke Getto
Microlab, Parsippany, N.J.

N
          etwork densification will be an integral part        4G LTE-Advanced already require it. There is a cost as-
          of deploying 5G architecture that promises           sociated with meeting all of these requirements. These
          vastly increased data rates, from megabits per       sometimes conflicting factors are difficult to design into
second (Mbps) to gigabits per second (Gbps), and               the components; nonetheless, new products have been
ultra-reliable lower latency, from tens of milliseconds        able to solve the challenges and constraints of today’s
to milliseconds. The 4G radio access network (RAN)             deployments. Solutions for tomorrow’s rollouts will take
is roughly 10× denser than the 3G network, and that            advantage of these new techniques to satisfy the de-
densification is predicted to continue through 2022            mands of more bands and configurations.
before new 5G equipment takes over the growth                     Outdoor small cells come in many different shapes,
trend. Macro cell towers carried the bulk of 4G mobile         sizes and configurations. In this article, a small cell is
traffic, with small cells deployed where the capacity is       defined as a single geographic site and can be made up
needed most—close to the consumer. It is predicted             of radios, antennas and other equipment. They can dif-
that 5G networks will need to be 10× denser than 4G            fer from city to city, even street corner to street corner,
networks, a 100× increase over 3G. 5G densification            depending on the requirements of the site, municipal
will be accomplished in space, time and frequency.             jurisdiction, MNO or subscriber population and mobil-
    Mobile network operators (MNO) have invested bil-          ity in the area. They can support multiple frequency
lions of dollars to buy different frequency bands within       bands, multiple sectors and multiple operators within
the same geographical areas, and they want to maxi-            a common structure. Each of these requirements brings
mize their investments by using carrier aggregation to         unique challenges to the design and deployment of
increase capacity. This necessitates using three, four         small cells at the scale required for 4G expansion and
or five different licensed bands at the same time, and         future 5G networks.
they may use MIMO technology for additional capac-                The challenge of location means that small cells must
ity. All these requirements multiply the amount of RF          be put in the available space, both horizontally and ver-
hardware at a site. Excellent RF performance, with low         tically, which may not be ideal. Small cells can be locat-
loss, low passive intermodulation (PIM) and high inter-        ed on dedicated poles, roof tops, inside street furniture
band isolation must be maintained, as the demands of
                                            www.mwjournal.com/articles/32235
                                                           4
within the physical constraints and achieve the desired
                                                                   RF performance for the small cell marketplace.
                                                                       Yet another consideration for small cell equip-
                                                                   ment is hardiness against the elements. The prod-
                                                                   ucts must work across a large temperature range,
                                                                   from sub-zero temperatures away from the equator
                                                                   to scorching summers closer to it. They must be
                                                                   designed with dust ingress protection (IP) for des-
                                                                   ert climates and prevent corrosion in humid, salty
                                                                   coastal areas. The temperature specifications, IP or
                                                                   National Electrical Manufacturers Association rat-
                                                                   ings and salt/fog compliance are important factors
                                                                   to select the right equipment.
                                                                       For in-building coverage, distributed RAN (D-RAN)
                                                                   is a cost-effective way to meet wireless coverage and
                                                                   capacity needs in venues like stadiums, hospitals, office
                                                                   buildings and hotels. If small cells were deployed ev-
                                                                   erywhere coverage is required, the cost would be very
                                                                   high and the system would be well over the capacity
                                                                   needed. D-RAN uses a small network of passive com-
                                                                   ponents with low power radios as the signal source. D-
                                                                   RAN is generally both a neutral host and multi-band. In
                                                                   the D-RAN architecture, a point of interface (POI) has
                                                                   several ports for combining, with multiple outputs for
                                                                   distribution. The POI allows for efficient combining and
                                                                   is a cost-effective solution for in-building designs, as
                                                                   the coverage and capacity can be optimized simultane-
                                                                   ously.
s Fig. 1   Lamp post small cell (Source: Crown Castle).                D-RAN has some of the same design constraints as
                                                                   outdoor small cells. Small size of the components is
and on existing utility poles (see Figure 1). In New York          critical to the ability to deploy the equipment where it
City, for example, two of the poles at an intersection are         needs to be placed, not just in a convenient location.
reserved for public safety and traffic control, which lim-         But RF performance is still critical—if the network does
its the physical space available for small cells. What is          not have the necessary RF performance, it is not able to
possible really depends on the restrictions within each            do its fundamental job of wireless connectivity.
municipality. Additionally, neighborhood residents will                As the industry begins its foray into the 5G era, small
not accept an eyesore to get better service, so pleas-             cells need to be future proof. In only the last three
ing concealment is vital. Compact and adaptable com-               years, just for 4G, the large U.S. MNOs have each in-
ponents are critical to successfully deploying outdoor             creased spectrum usage by 100 MHz or more. Typical
small cells.                                                       commercial bands now extend from 600 to 3800 MHz.
    In a neutral host small cell, a third party finances the       Additionally, the RAN has begun to include unlicensed
small cell and rents access to the MNOs. A neutral host            spectrum features for LTE-LAA, up to 5925 MHz. Over
small cell can have two or more different network oper-            the next decade, the increase in spectrum usage will be
ators, each using multiple frequency bands. With each              in the thousands of MHz. Ultra-wideband RF compo-
MNO using multi-band carrier aggregation, it is not un-            nents that span several GHz of bandwidth, to cover the
common to see 12 or more frequency bands within a                  licensed and unlicensed sub-6 GHz range, provide the
single small cell. In this crowded RF environment, signal          flexibility to adapt to existing and potential spectrum
performance is critical, typically requiring the use of a          for future use. 5G will require even more spectrum be-
multi-band combiner with minimal insertion loss and                low 6 GHz.
maximum inter-band isolation.                                          Flexibility to adapt to these changing spectrum re-
    The small cell components must be physically small             quirements helps reduce the total cost for the MNOs to
and offer the necessary RF performance. If the small               continuously upgrade their networks. Small cells are ex-
cell equipment is too large, mounting the cell at the re-          pensive to deploy and upgrade, especially if upgrades
quired location may not be possible. Every cubic inch of           must be approved by the municipality. Deploying fu-
space within the enclosure is a premium, making com-               ture proof technology can dramatically reduce the cost
ponent size and dimensions a critical design factor. If            and time to deploy. D-RAN solutions must also be flex-
the small cell’s physical size is small, more options will         ible to adapt for various use cases in stadiums, offices,
be available for locating the cell. This presents more op-         warehouses and other locations. The more flexible the
tions for network engineers, as they design the network            solution, the more likely it is to actually get deployed.
architecture; however, it presents a larger challenge to           Flexibility also extends to configuration, i.e., two sec-
the equipment vendors. Network equipment vendors                   tor, multiple bands, etc. Small cells and D-RAN will not
must continually innovate and optimize designs to fit              just be single sector, single band deployments; the lim-
                                                               5
s Fig. 2 Components designed for small cells must be small
and withstand outdoor environments with varying temperature
and moisture.
ited locations are too valuable for that. Compact, high
quality, flexible products that do not sacrifice RF perfor-
mance are indispensable.
   Microlab has been focusing its R&D on small cell com-
ponents, developing rugged, ultra-wideband and com-
pact components. Each of the product categories offers
frequency coverage options from 350 to 5925 MHz for               s Fig. 3 Neutral host small cell and D-RAN systems support
TETRA, commercial wireless, CBRS, LTE-LAA and future              several operators and must handle multiple carriers operating
5G bands. These products have multiple mounting con-              on different frequency bands.
figurations that allow system integrators the flexibility         future proof solution, enabling easy upgrades and re-
to adapt to each site’s unique requirements. Many of              configurations as capacity and bandwidth requirements
Microlab’s products are designed to cover −40°C to                evolve. The custom, bolt-on design supports fast and
+75°C, and the salt/fog series (see Figure 2) complies            easy installation, with guaranteed end-to-end perfor-
with Telcordia GR-3108-CORE paragraph 6.2, Salt Fog               mance of the passive components.
Exposure, as Class 4 products for 30 days, defined by                 For 5G networks, RF performance is even more criti-
ASTM-B117. These products are hard anodized, result-              cal, since 5G essentially maximizes the spectral efficien-
ing in an even harder and more durable coating. They              cy (bps/Hz) of the LTE waveform to deliver ultra-reliable
come with an IP68 rating, which means they are pro-               and low-latency communication and greater mobile
tected against the effects of immersion in water under            broadband bandwidth. To provide these capabilities,
pressure for prolonged periods.                                   the RAN ecosystem must perform.
   For small cell and D-RAN deployments, Microlab’s                   5G will not be able to meet its performance goals
MCC Series™ is a modular POI solution (see Figure 3).             without cell densification. Actually, hyper-densification
Designed to fit any operator or neutral host provider, the        is required to deliver the promise of 5G. So the industry
series offers a modular solution that can accommodate             must be able to deploy high quality small cells, for use
any wireless communications band up to 6 GHz and can              indoors and outdoors, in a cost-effective and adaptable
be adapted for any site with any band or carrier configu-         manner.n
ration. This one-size-fits-all platform was designed as a

                                                              6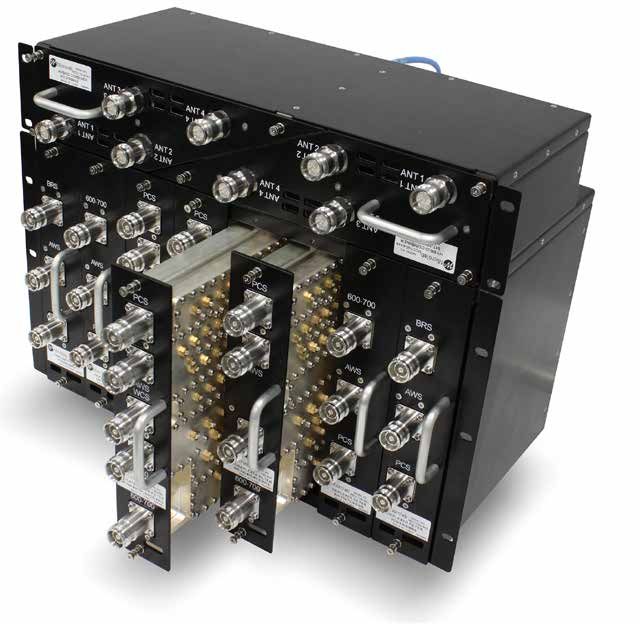
Microwave Will Drive the
Development of 5G
Tamas Madarasz
Nokia, Espoo, Finland

Mobile data traffic is growing rapidly, with current estimates suggesting a 40× increase between
2014 and 2020. Networks will also connect some 50 billion devices to the IoT by 2025—with a
proliferation of smart objects from fridges to industrial controllers. Many communication service
providers (CSP) are, therefore, rethinking their existing transport network architectures as they
transition to 5G.

T
           he shift to 5G is unlike the changes experi-           expensive. When a fiber point of presence is a few hun-
           enced with previous generations of mobile              dred meters away from the radio access point, for in-
           communication technology, because 5G is                stance, total cost of ownership (TCO) favors microwave
           more than just an innovative radio technology          connectivity. Microwave is already used in more than
using new spectrum. Beyond the extremely challenging              50 percent of current cell sites, and any cost-effective
capacity considerations already mentioned, 5G intro-              evolution to 5G will continue to use existing 4G/LTE
duces a new approach to network architecture, enabling            network assets, particularly since microwave technology
new business models for an industry looking toward the            is capable of supporting 5G’s challenging capacity and
next trillion dollars of growth. This clearly will not come       latency requirements.
by just selling more smartphones or providing simple                 As noted, 5G will enable many new services, includ-
connectivity in developing markets; rather, it builds on          ing enhanced mobile broadband, augmented reality
new concepts such as densification, decomposition of              (AR) and mission-critical communications, creating an
network functions (e.g., the separation of user and con-          unprecedented traffic mix requiring dramatically im-
trol planes), programmable transport, network slicing             proved performance. For example, throughput must
and end-to-end automation and orchestration to en-                rise 10× (10 to 25 Gbps for the F1 link and cell site back-
able new services and business models.1 A complex in-             haul interfaces), and latency must come down to 1 ms
terworking of different network domains, technologies,            end-to-end. To meet the increasing 5G capacity require-
components and services is needed.                                ment, new microwave solutions that optimize spectrum
    As 5G deploys, mobile transport networks must                 use and dramatically increase capacity are already avail-
evolve to meet this complex range of new demands,                 able, with more to follow. When it comes to addressing
forcing CSPs to respond with backhaul transformation              latency, physics favors microwave. Propagation medium
projects to meet the needs of 5G radio access network             latency depends on the density of the medium, so the
(RAN) service provisioning. Casual observers might think          latency of a wireless connection is fundamentally lower
the future of transport networks is all about fiber optics.       than that of a fiber cable of the same length. Equipment
It is true that the fiber presence in transport networks          latencies must also be considered. Mission-critical ap-
is increasing, as CSPs exploit the technology’s advan-            plications require high resiliency. Wireless is generally
tages. Yet fiber is not always available and may be too
                                              www.mwjournal.com/articles/32540
                                                              7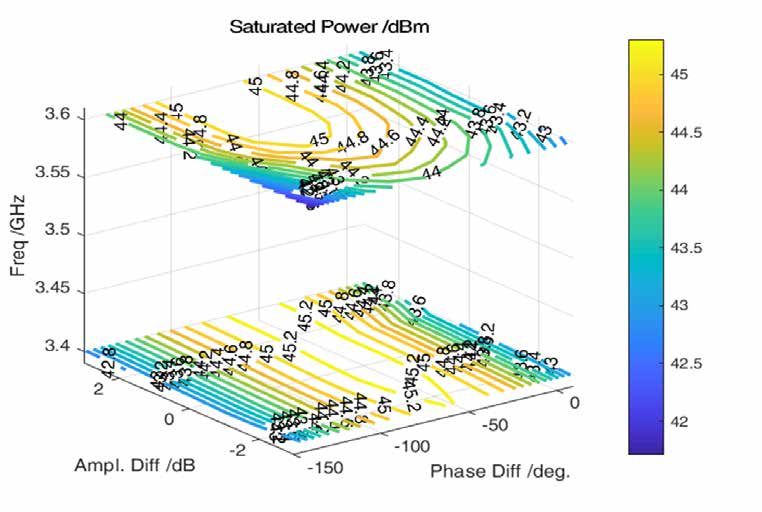
more reliable than fiber during major events such as                       With network slicing, network resources—both virtual
earthquakes, fire or simple road maintenance. In these                     network functions and the transport network—are shared
cases, the recovery time is much faster with a microwave                   by different services. The network is virtually sliced into
connection. For all these reasons, microwave transport                     several, independent logical resources that simultaneous-
will be a key enabler for 5G, playing an important role as                 ly accommodate multiple application fulfillment requests.
CSPs ramp up their 5G rollouts.                                            This is different than the conventional setup for sharing
                                                                           network resources, where a host provides hardware and
A NEW ARCHITECTURE                                                         software resources to one or more guests. Instead, it re-
    5G is more than just an innovative radio technology.                   lies on the concept of software-defined networks (SDN).
It introduces a new approach to network architecture                       An SDN-capable microwave network makes its resources
to deliver the dramatic improvements in performance                        available through a virtualized transport service, with the
that 5G users will expect. For example, CSPs tradition-                    SDN controller acting as a hypervisor to allocate the re-
ally treat the core, transport and RAN independently                       sources. For example, ultra-low latency applications can
and tend to integrate the different infrastructure parts                   be served by a network slice allocating the service to an
only after deployment. In 5G scenarios, however, post-                     E-Band (i.e., 80 GHz) channel using carrier aggregation.
deployment integration costs, time to market and the                       Other services not requiring low latency can be allocated
risk of degraded service quality will increase dramati-                    by a load balancing algorithm in the SDN controller to
cally using this approach. Without cross-domain design                     efficiently use carrier aggregation bandwidth.
and pre-deployment integration, CSPs risk missing out                          Network slicing requires substantial service automa-
on new 5G business opportunities. Business-critical ap-                    tion and optimization. Such a dynamic environment
plications depending on ultra-reliable low latency com-                    cannot be managed by humans, due to network com-
munication (URLLC) and extreme network reliability can                     plexity and the required life-cycle speed of each ser-
only be delivered with the seamless, error-free interac-                   vice. Instead, it demands an end-to-end approach to
tion of radio, transport, core, data center and manage-                    service fulfillment, which means that newly converged
ment systems.                                                              networks must make the transition to IP to support it.
    Network slicing (see Figure 1) is one of the key en-                   The transport network, whatever the mix of microwave
ablers of next-generation services and business models.                    and fiber, must adapt in step with the distributed IP
                                                                                               core and RAN functions provided by
                                                                                               the base stations, to meet the service
                                                                                               levels required for each network slice.
                        Cloud                                                                  Complex traffic engineering and the
                        RAN                                                                    flexibility to deliver shorter service
                                                    Edge              Edge
                                                   Cloud              Cloud        Packet      activation cycles—from days or hours
                D-RAN
                                 Edge                                            Core, IMS,    to minutes—combine to make a step
                                 Cloud                                            Analytics
                                                                                               change in the level of network auto-
                                                          Distributed            Centralized
                                                                                               mation the only sensible option.
                Small                                                                              It all adds up to far greater com-
             Cells/RRHs                                                                        plexity. For instance, virtual RAN func-
                                                                                               tions will be distributed over multiple
s Fig. 1 Transport network slicing creates pipes to meet many different performance platforms and integrated via new in-
needs.
                                                                                               terconnectivity interfaces. Some func-
                                                                                               tions will shift into the cloud and be
                                                                                               centralized to optimize cost and per-
                                     mmWave (26/28/39 GHz) Layer                               formance, while others will move
                                       • Ultra-Dense Urban
                                       • Hot Spots Like Airports                               closer to the end user, to better com-
                                         and Stadiums                                          ply with stringent low latency require-
                                                                                               ments. Such flexible and complex
                                                                                               networks will require unprecedented
                                                                                               levels of automation, to allow granu-
                                     Sub-6 (e.g., 3.x GHz) Layer
                                      • Urban/Suburban
                                                                                               lar end-to-end traffic engineering
                                         Coverage                                              and satisfy the different service level
                                                                                               agreements assigned to each service
                                                                                               or network slice. Each slice will effec-
                                                                                               tively be an automated and program-
                                                                                               mable transport pipe, which can adapt
                                     < 1 GHz Layer                                             dynamically to meet changing needs.
                                       • Rural Scenario for
                                         Coverage                                                  Densification at the physical edge
                                                                                               of the network means more sites to
                                                                                               be connected, with significant impli-
                                                                                               cations for transport. For instance, in
                                                                                               a typical deployment, a macro cell
s Fig. 2 Microwave must meet the diverse transport needs, from dense urban hot                 may be a pooling site for small cells
spots to rural areas.
                                                                  8
in its coverage area. High user density
                                                                                Available       Link
(> 150,000 subscribers/km2) implies                                     GHz Spectrum/Channels Capacity Latency        Antennas
increased connectivity between base                   New                           32 GHz      100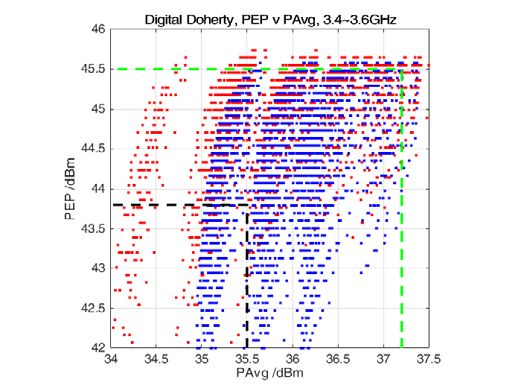
optimize budgets during backhaul net-
work upgrades to minimize the TCO of            Virtual Networks                  Health
their evolving assets. The latest micro-        Defined by Use Case              Assisted
                                                                                 Surgery                      Assisted
wave designs are highly compact, of-                                                                          Driving
ten with integrated antennas and other                         Cloud
components, enabling them to be used                          Robotics
for a wide range of use cases. New
microwave outdoor units also support
multi-frequency systems and carrier ag-
gregation, helping lower TCO.
                                                                                  Flexibility
SOLUTIONS TODAY AND
TOMORROW                                                             Low Cost                       Not Price Critical
   To have maximum flexibility when                               Short Range                       Wide Range
                                                                   Best Effort                      High QoS
choosing the best way forward, com-
                                                               Low Data Rate                        Highest Data Rate
panies must seek out appropriate so-                                      Static                    Mobile
lutions and tools to optimize budgets                      Battery Life Critical                    Power Not Critical
during backhaul network upgrades,                               High Latency                        Low Latency
considering both CAPEX and OPEX.
The optimal solution combines an                                                       Slicing across radio, programmable
end-to-end portfolio including cross-                                                   transport, core and central clouds.
domain cloud-native utilities and en-
abling rapid deployment of virtualized
functions across a distributed cloud
infrastructure. This will simplify service
                                             Cloud Scalability
scaling, shorten time to market and de-      and Efficiency                       Automotive
                                                                  Utility                                Health
liver cost efficiencies across the radio,
core and transport networks.
   Companies seeking to digitally s Fig. 4 Using network slicing across the radio, transport, core and central clouds,
transform require a solution that an- 5G has the flexibility to support diverse use cases with a common underlying
swers the challenges of 5G transport infrastructure.
by converging fronthaul, midhaul and                               port, and microwave technology will play a role as a key
backhaul to serve a variety of use cases within the same           enabler of the new approach. It will help CSPs leverage
network. Every CSP will follow a unique path to 5G, but            existing investments while continuing to build the new
each one will tackle the evolving transport network.               capabilities needed for 5G.n
Right now, the transport layer must handle many tech-
nologies, both legacy and evolving, and will soon need             Reference
to flex to meet more extreme demands (see Figure 4).               1.		“The Evolution of Microwave Transport—Enabling 5G and Be-
CSPs need to adopt an end-to-end approach to trans-                     yond,” Nokia, 2019, pp. 1–24, https://nokia.ly/2NrxmWK.

                                                               10
RF Front-end Technology and
Tradeoffs for 5G mmWave Fixed
Wireless Access
Bror Peterson
Qorvo, Greensboro, NC
Presented at EDI CON USA 2018.
F
ixed Wireless Access (FWA) has entered as one of ers. Systems are being designed to leverage existing
the first enhanced mobile broadband (eMBB) use- tower sites and support a low-cost self-installed CPE
cases. Many carriers are performing FWA deploy- build-out. Both are critical to keeping initial deployment
ment in targeted locations throughout their networks. In investment low, while the business case for FWA is vali-
this technical paper, we analyze the architecture, semi- dated.
conductor technology, and RF front-end (RFFE) design Large coverage is essential to the success of the FWA
needed to deliver mmWave FWA services. Discussing business case. To illustrate this, let’s consider a suburban
topics such as; deployment with 800 homes/km2, as shown in Figure
• Scan-angle requirements 1. For BTS inter-site distance (ISD) of 500 m, we need
• Tradeoffs of Hybrid-beamforming versus All-Digital at least 20-sectors each covering 35-houses from 9 cell-
Beamforming for the Base Transceiver Station (BTS) sites. Assuming 33% of customers sign up for 1 Gbps
service and a typical 5x network oversubscription ratio,
• Analyze BTS semiconductor technology and RF front-
an average aggregate BTS capacity of 3Gbps/sector is
end components
needed. This capacity is achieved in 800 MHz, assuming
• Gallium-Nitride on Silicon Carbide (GaN-on-SiC) an average spectrum efficiency of 3 bps/Hz and 2-lay-
front-end modules (FEMs) designed
specifically for the 5G FWA
MMWAVE SPECTRUM &
DEPLOYMENT
Operators have already taken steps
to meet their first FWA challenge: ob-
taining spectrum. Most deployments
are expected to use mmWave frequen-
cies, where large swaths of contiguous
unpaired bandwidth are available at
very low cost. Based on the initial tri-
als and the geographical bandwidth it
is clear the 26.5-29.5 GHz and 37-40
GHz bands will be the first used and
24.25-27.5 GHz will closely follow.
FWA describes a wireless connec-
tion between a centralized sectorized
BTS and numerous fixed/nomadic us- s Fig. 1 Fixed Wireless Access in a Suburban Macro Environment.
www.mwjournal.com/articles/31319
11ers of spatial multiplexing. If custom-
Per-Column Active Ant
ers are paying $100/month, the an-
nual revenue is $280,000/km2/yr. Of
Suburban Landscape
course, without accounting for recur- Average House Height - 10 m
ring costs it’s not clear FWA is a good
15-25 m
business but we can conclude that as
ISD increases the business-case im-
proves. To that end, carriers are driving
equipment vendors to build BTS and • N-Times Fewer Components
• N-Times Larger PA
CPE equipment that operates up to • Higher Feed Losses
regulatory limits to maximize coverage • Fixed Elevation Pattern
(a)
and profitability.
In the U.S., the Federal Communi- Urban Landscape Per-Element Active Ant
cations Commission (FCC) has defined
very high effective isotropic radiated
1:4 Splitter
1:4 Splitter
base station power (EIRP) limits1 at 75
1:4 Splitter
dBm per 100 MHz for the 28 and 39
GHz bands. The challenge becomes
building systems that meet these tar-
gets within the cost, size, weight, and (b) • N-Times More Components
power budgets expected by carriers. • N-Times Smaller PAs
Column Array Beamwidth Gain (dB) • Lower Feed Losses
• Elevation Beam Steering
FWA LINK BUDGET Single Element 102° 5
The standards community has 2-Elements 51° 8
been busy defining the performance
4-Elements 26° 11
requirements and evaluating sev-
eral use-cases over a broad range of 8-Elements 13° 14
mmWave frequencies. The urban-mac-
ro scenario is the best representation s Fig. 2 Array Complexity Depends on the Scanning Range Needed for the
of a typical FWA deployment; having Deployment Scenario.
large ISD of 300 to 500 m and provid- at relatively the same rate as the path loss. This provides
ing large path-loss budgets that overcome many of the a more uniform coverage for both near and far uses.
propagation challenges at mmWave frequencies. The nominal half-power beam-width can be ap-
Closing the link budget depends on many variables proximated as 102°/NANT and the array gain by
including transmit EIRP, receive antenna gain, receiver 10log10(NANT ) + 5 dBi. As we passively combine an-
noise figure (NF), and minimum edge-of-coverage tennas the elevation beam pattern is focused, and fixed
throughput. In the following, we explore several archi- antenna gain increases, as shown in the Table of Figure
tecture trades that are key to technology selection and 2. For the suburban FWA use-case, a 26° to 13° beam-
design of RFFE components. width is sufficient and the passively combined column
SCAN-ANGLE REQUIREMENTS array can be 4 to 8-elements, respectively. In the ur-
ban scenario, the elevation scanning requirements are
The number of active channels in the array depends greater and systems will be limited to 1 or 2 passive ele-
on many things. Let’s start by first understanding the ments. Figure 2 far right (a) and (b) illustrates the two
scanning (azimuth and elevation) requirements and approaches. Both have the same antenna gain but the
whether two-dimensional beamforming is required for column-fed array has a fixed elevation beam pattern.
typical FWA deployment or if a lower complexity one- The per-element array supports wider scan angles but
dimensional (AZ only) beamforming array is sufficient. needs four times as many PA, phase shifter, and vari-
We will see that this decision impacts the power ampli- able gain components. Whereas, the column-fed PA will
fier (PA). need to be four times larger, which can easily change
We show two FWA deployment scenarios in Figure the semiconductor technology selection.
2. In the suburban deployment, the tower heights rang- It’s reasonable to assume a suburban BTS will use
ing from 15 to 25 m and the cell-radius is 500 to 1000 antennas with 6 to 9 dB higher passive antenna gain
m with an average house height of 10 m. Just as in tra- compared to an urban deployment. As a result, the
ditional macro cellular systems, where the typically verti- phased array needs far fewer active channels to achieve
cal beamwidth is 5-8 degrees, there is no need for fully the same EIRP, significantly reducing active component
adaptive elevation scanning. count and integration complexity.
This allows the elevation beam-pattern to be focused
down by corporately feeding several passive antenna ALL-DIGITAL AND HYBRID ARRAY DESIGN
elements, as shown in Figure 2(a). This vertically stacked It is natural for BTS vendors to first explore extend-
column of radiating elements is designed to minimize ing current sub-6 GHz all-digital beamforming AAS plat-
radiation above the houses and fill in any nulls along the forms to mmWave. This preserves the basic architecture
ground. Further, the gain pattern is designed to increase and the advanced signal processing/algorithms needed
12to realize beamformed spatial multiplexing. However, all outdoor passive-cooled, tower-top electronics, it’s
due to the dramatic increase in channel bandwidths of- challenging to thermally manage more than 300 W from
fered by mmWave and the need for many active chan- the RF subsystem. Fortunately, there are new technolo-
nels, there is a valid concern that the power dissipation gies being introduced that will make this architecture
and cost of such a system would be prohibitive. There- a reality:
fore, vendors are exploring new hybrid-beamformed • Next-generation 14 nm digital-to-analog and analog-
architectures2, which allows flexibility between the num- to-digital converters that save power
ber of baseband channels to the number of active RF • Advances in mmWave CMOS direct-conversion
channels. This approach may provide a better balance transceivers
of analog beamforming gain and baseband processing.
In the following sections, we analyze the two architec- • Increased levels of small-signal integration
tures and discuss the RFFE approaches needed for each. • Last but not least, new PA technology advances
As an example, Qorvo has been developing a 9 W
All-Digital approach Psat Doherty GaN PA at 28 GHz that provides over 20%
The most obvious choice in mmWave base station ap- PAE at 8 dB backoff. When compared to an equivalent
plications is to upgrade the current platform. Three key traditional amplifier this is a 10% improvement and
elements would be required to do this, namely: efficient without any other changes to the above off-the-shelf
wide-band analog-to-digital/digital-to-analog convert- design brings the dissipated power below 200 W. In
ers (ADCs/DACs), highly integrated direct-conversion combination with new ADC/DACs and highly integrated
transceivers, and high-efficiency high-power amplifiers. mmWave transceivers, the idea of extending a 16T16R
Analysis can show that even with todays off-the-shelf Sub6GHz BTS platform to mmWave frequencies is near-
components and using a traditional high-power 9 W er than most people think.
Psat linear GaN amplifiers (e.g. QPA2595) an all-digitally
beamformed dual-polarized BTS can be designed to Hybrid approach
achieve 60 dBm EIRP/polarization with only 16 channels An alternative architecture being explored is hybrid
at a dissipated power of 320 Watts. Unfortunately, for beamforming (Figure 3), where the spatial multiplexing
Corporate Feed
Transceiver Digital Beamforming
RF Front-End
(GaN Doherty PA, LNA, Switch)
Xxxxx Xxxx Xxx
Transceiver
Xxxxx Xxxx Xxx
Transceiver
Corporate Feed
Transceiver
Hybrid Beamforming RF Front-End (GaN PA, LNA, Switch)
Digital Mixed IF-RF RF Beamformer Front-Ends
Processing Signal Conversion
•
•
•
LO
•
•
•
• • • Subarray •
DUC D/A • •
•
•
• Panel I •
•
•
Digital Beamformer
•
•
•
DDC A/D
•
•
•
• • •
• • N: Number of Baseband 1:M/N • •
• • Channels • • •
• •
M: N
DUC D/A •
•
•
•
•
•
DDC A/D
•
•
•
•
• • Subarray •
• • •
• • Panel N •
•
•
•
•
•
•
s Fig. 3 Digital and Hybrid RF Front-End Approaches.
13Tradeoffs Between the Number of Antenna Array branch. Fortunately, these small-signal
Elements and RFFE Process Technology functions can be highly integrated
55 35 on a single chip using SiGe semicon-
EIRP = 65 dBm
50 ductor technology. The most typical
Average Tx Power Per Element (dBm)
45
configuration is to have 4-branches
30
per core-beamformer chip but there
Antenna Array Gain (dBi)
40
are examples demonstrating up to
35 GaN f= 28 GHz 32-channels.
y/12=5.4 mm 25
30
emax=90% These core-beamformer chips act
4πe
as a driver to feed the front-end mod-
25 Array Gain ≈ maxDarray2
y2 20 ules (FEM) which provides the final PA,
20 T/R switch, and LNA functions. If the
15 GaAs required power from the FEMs is small
10
15 enough, it is possible to also use SiGe
technology and monolithically inte-
5 SiGe grate into the core-beamformer chip.
0 10 However, for base station applications
32 44 96 128 256 512 1024
where high EIRP is required, analysis
Number of Active Elements
(a)
shows that an all-SiGe solution will not
provide optimum power consumption
System Power-Dissipation vs. Array-Size and EVM-Target or cost because 1000’s of elements
for 64 dBm EIRP would be required. To optimize the
110 40
cost and power consumption, it can
Element Gain = 8 dBi
EVM-8%
35
be shown that using compound semi-
100 EVM-6%
EVM-4% conductor technology, like GaN and
GaN
Pave/ch 30 GaAs, for the FEM allows the array
Pave/Channel (dBm)
Power Dissipated (W)
90 size to be far less complex, consume
25 less power, and be lower cost. The fol-
80 lowing section provides additional in-
20 sight into this important trade.
70
FRONT-END SEMICONDUCTOR 15
60 TECHNOLOGY
2-Stage
GaAs 10
The technology choice for the RFFE
50 SiGe
depends on the EIRP and G/NF re-
5
quirements of the system. Both are a
3-Stage function of beamforming gain, which
40 0
16 40 44 88 112 136 180 194 208 232 256 280 304 328 362 386 400 424 448 472 496512 is a function of the array size. To illus-
(b) Number of Active Channels trate this, we show in Figure 4(a), the
average per-channel PA power (PAVE)
s Fig. 4 Technology System Trade-Offs. needed as a function of array size and
antenna gain for a uniform rectangular
and beamform precoding functions can be separated array achieving 65 dBm EIRP.
into digital baseband processing and analog RF pro- The graph is overlaid with an indication of power
cessing, respectively. This provides a new design knob ranges that are best suited for each semiconductor
that allows the number of baseband chains to scale technology. The limits were set based on benchmarks
independently from the number of active antenna el- of each technology, trying to avoid exotic power-com-
ements in the array. Unlike the all-digital architecture, bining or methods that degrade component reliability
where there is typically a 1:1 relationship with the num- or efficiency.
ber of active RF chains, the hybrid architecture allows a As array size gets large (>512 active-elements) the
1:N relationship. power-per-element becomes small enough to allow
As shown in Figure 3, the RF beamformer subsys- SiGe/SOI, which could then be integrated into the core-
tem fans out the upconverted baseband stream into N beamformer RFIC. In contrast, by using GaN technology
branches, which are then adjusted for amplitude and for the front-end, the same EIRP can be achieved with
phase, and fed to a multi-element panel antenna. By 8-to-16 times fewer channels. Now let’s examine these
setting the correct phase and amplitude coefficients two cases further.
the radiated signals coherently combine to provide the
needed beamforming gain in the direction of the in- GAN VERSUS SIGE FRONT-END MODULES
tended user.
Although this approach reduces the number of ADC/ System Power Dissipation
DACs required, it sharply increases the number of RF We start by analyzing the total system PDISS of the
front-ends that are needed and introduces the need for beamformer plus the front-end versus the number of ac-
careful analog phase and amplitude control on each RF tive-array elements in each subarray-panel, as shown in
14If we design to optimize system PDISS without regard
TABLE 1 for complexity/cost, an array of about 128-elements
ASSUMPTIONS, TOTAL DIE AREA, AND RELATIVE COST with a 2-stage 14 dBm (24 dBm P1dB) PA would make
OF ALL-SIGE VS. SIGE BEAMFORMING + GAN FEM the best choice. However, if we strive to optimize cost/
ARCHITECTURE
complexity/yield for a given budget of ≤100 W then the
(a) All-SiGe GaN + SiGe Units optimum selection (shown as the dark blue bar) would
Ave Output Power/Channel 2 20 dBm be 48-to-64 active channels using a 3- stage GaN PA
Power Dissipation/Channel 190 1329 mW
with an average power of 20-to-23 dBm, depending on
the EVM-target.
Antenna Element Gain 8 8 dBi The trends shown in Figure 4(b) are less a function of
Number of Active Channels 512 64 – PA efficiency and more a function of beamformer inef-
EIRP 64 64 dBmi ficiency. In other words, the choice to increase array size
8-fold to allow an all-SiGe solution comes with a pen-
Total Pdiss 97 97 W
alty given that the input signal gets divided many more
(b) All-SiGe GaN + SiGe Units ways and requires power-hungry linearly biased devices
Beamformer Die Area/Channel 2.3 2.3 mm2 to gain it back up.
Front-End Die Area/Channel 1.2 5.2 mm2 Cost Analysis
Total SiGe Die Area 1752 144 mm2 The cost of phased-array systems includes the RF
Total GaN Die Area 0 334 mm2 components, the PCB material, and the antennas them-
(c) Die Cost Units Notes
selves. Using compound-semi front-ends allows an im-
mediate 8x reduction in array size with no increase to
All-SiGe System Die Cost 1752 $/X – PDISS. Even with lower-cost printed antenna technol-
System Die Cost 4" GaN + SiGe 1647 $/X
4" GaN = ogy, this is a large saving in expensive antenna quality
4.5X substrate material. But what about component cost?
System Die Cost 6" GaN + SiGe 1146 $/X 6" GaN = 3X Currently, the die cost per square-millimeter of 150
nm GaN-on-SiC on 4”-wafers is only 4.5-times the cost
of 8” 130 nm SiGe. As we shift into high-volume on
the 6”-GaN production lines, the cost relative to SiGe,
drops to 3X. Using this information, we compare the
relative raw die cost of the two systems based on the as-
sumptions defined in Table 1 (a) and (b). The resulting
To Antenna Array
RF
cost comparison is summarized in Table 1(c).
Beamformer
QPF4006 We observe that using a high-power density com-
pound-semiconductor solution like GaN on 6”-wafers
can save up to 35% in raw die cost relative to an all-
SiGe architecture. Put simply, even though the cost of
silicon technologies is lower per device, the cost of the
QPF4006 complete system is significantly higher. The savings in
QPF4005 Dual-Channel Module cost increased further when factors such as antenna sub-
strate, packaging cost, testing time, and yield are con-
s Fig. 5 Qorvo FWA solutions: mmWave GaN front ends. sidered.
A GaN FWA front end provides other benefits:
Figure 4(b). The PDISS is shown for several error-vector-
magnitude (EVM) levels and a requisite 64 dBm EIRP. • Lower total power dissipation. GaN provides a low-
EVM-level sets the back-off efficiency achieved by the er total power dissipation than SiGe. This is better for
front-end. tower- mounted system designs.
In this Figure 4b analysis, we assume that each • Better reliability. GaN is more reliable than SiGe,
beamformer branch consumes 190 mW. This is a typi- with >107 hours MTTF at 200° C junction tempera-
cal power consumption of core-beamformers currently ture. SiGe’s junction temperature limit is around 130°
in the market [3]. The system on the far right (dark gray C. This has a big impact on the heat-sink design.
bar) represents an all-SiGe solution with 512-elements • Reduced size and complexity. GaN’s high power
consuming ~100 W with an average power-per-element capabilities reduces array elements and size, which
of 2 dBm. As we move left, the number of elements simplifies assembly and reduces overall system size.
decreases, the PAVE per-channel increases, and we ob- Based on these trades, Qorvo has created a family of
serve that PDISS is optimized up to a point where beam- front-end modules for mmWave. These integrated mod-
forming gain starts to roll-off sharply and PDISS needed ules include a multi-stage high-power PA, high linearity
to maintain the EIRP rapidly increases. The small steps T/R switch, and low noise figure LNA, all monolithically
in the dissipation curves represent the points where the integrated using our 150 nm GaN/SiC process.
front-end transitions from a single-stage, to 2-stage, In addition to the above listed 39 GHz GaN compo-
and finally 3-stage design to provide sufficient gain. As nents Qorvo also has similar modules addressing the 28
stages are added the efficiency drops slightly and thus GHz market.
we see small jumps in power dissipation.
15SUMMARY
References
FWA is rapidly approaching commercialization. Due 1. Federal Communications Commission. (2016, July). Use of Spec-
in part to the abundance of low cost spectrum, early trum Bands Above 24 GHz for Mobile Radio Services, In the mat-
regulatory and standards work, and the opportunity ter of GN Docket No. 14-177, IB Docket No. 15-256, RM-11664,
WT Docket No. 10-112, IB Docket No. 97-95. Retrieved from
for operators to quickly tap a new market. The remain- https://apps.fcc.gov/edocs_public/attachmatch/FCC-16-89A1.
ing challenge is the availability of equipment capable pdf
of closing the link at a reasonable cost. Both hybrid- 2. A. F. Molisch et al., "Hybrid Beamforming for Massive MIMO: A
beamforming and all-digital beamforming architectures Survey," in IEEE Communications Magazine, vol. 55, no. 9, pp.
are being explored and analyzed. These architectures 134-141, 2017.
3. B. Sadhu et al., "7.2 A 28GHz 32-element phased-array transceiv-
capitalize on the respective strengths and differences of er IC with concurrent dual polarized beams and 1.4 degree beam-
semiconductor processes. The use of GaN front-ends in steering resolution for 5G communication," 2017 IEEE Interna-
either approach provides operators and manufacturers a tional Solid-State Circuits Conference (ISSCC), San Francisco, CA,
pathway to achieving high EIRP targets while minimizing 2017, pp. 128-129.
cost, complexity, size, and power dissipation.
High Power GaN MMIC FEM Ultra Low-Noise Amplifier
at 39 GHz offers Flat Gain
Qorvo’s QPF4006 targets 39 GHz, phased With an operational bandwidth of 600 to
array, 5G base stations and terminals by 4200 MHz, the Qorvo QPL9057 provides a
combining a low noise, high linearity LNA, a gain flatness of 2.4 dB (peak-to-peak) from
low insertion-loss, high-isolation TR switch, 1.5 to 3.8 GHz. At 3.5 GHz, the amplifier
and a high-gain, high-efficiency multi-stage typically provides 22.8 dB gain, +32 dBm
PA. Operating from 37 to 40.5 GHz, receive OIP3 at a 50 mA bias setting, and 0.54 dB
path gain is 18 dB with a noise figure < 4.5 noise figure. The LNA can be biased from a
dB. Transmit path gain is 23 dB with a satu- single positive supply ranging from 3.3 to 5
rated output power of 2 W. Housed in a 4.5 volts. Bias adjustable for linearity optimiza-
x 4.0 mm air-cavity laminate package with tion, it’s housed in a 2 × 2 mm package.
embedded copper heat slug. Learn More
Learn More
16Optimizing the Perennial
Doherty Power Amplifier
Gareth Lloyd
Rohde & Schwarz, Munich, Germany
T
he Doherty power amplifier (PA), invented al-
most 100 years ago, is used in an increasing Carrier
PA
number of radio transmitter applications to im-
Baseband
prove energy efficiency, with numerous ways +
Doherty
to build the PA. This article begins with an overview of DAC
Combiner
+
linearization and efficiency enhancement and, against Modulator
that backdrop, highlights the associated challenges and Peaking
some of the numerous solutions. Finally, there is an al- PA
ternative design flow, illustrated with a case study pro-
viding insight into the design and how to achieve the Dual Input
best performance-cost compromise. Doherty
Classic Programmable
LINEARIZATION TECHNIQUES Doherty Split Doherty
The four key technical performance parameters in a
transmit (Tx) RF front-end (RFFE) are the efficiency, out- Bias Modulated Doherty
Doherty Outphasing
put power, linearity and bandwidth. The latter three are Continuum
ET +
often dictated by system requirements, such as a com- Doherty Doherty
munications standard. The former, (energy) efficiency, is Envelope Outphasing
Continuum Outphasing
the differentiator. All other performance parameters be- Tracking
+ ET
ing equal, a higher efficiency for a front-end is preferred. Load Multilevel
Devices used in the RFFE have imperfect linearity Modulation Outphasing
Chireix
characteristics, preventing them from being fully uti-
lized merely as drop-in components. The linearity of ER/EER LINC
a Tx RFFE can be improved by implementing a lin-
earization scheme. Typically, this will increase the raw
cost of a Tx RFFE, trading that for a combination of Envelope Efficient
PA RF PA
efficiency, linearity and output power improvement.
Baseband Baseband
Numerous linearization methods have been pub- + + Outphasing,
lished, stretching back at least to the feedforward1 DAC DAC Chireix,
+ +
and feedback2 patents. Arguably, the use of nonlinear Modulator Modulator
Isolated
predistortion dates similarly to the invention of com-
Efficient
panding.3 These schemes may be classified according RF PA RF PA
to their modus operandi (see Figure 1 and Table 1).4
One way of dividing the linearization pie is to identify s Fig. 1 Amplifier linearization options using post-source,
whether a scheme predicts or extracts its unwanted predicted/synthesized composition schemes.
www.mwjournal.com/articles/31907
17and documented over the last 100 years. Outphasing,5
TABLE 1 envelope6 and Doherty7 transmitters, along with their
AMPLIFIER LINEARIZATION METHODS hybrids by Choi,8 Andersson9 and Chung10 are exam-
Impediment Generation ples of such techniques, except they have been primar-
Predicted/ Measured/
ily marketed for efficiency enhancement rather than as
Synthesized Extracted linearization techniques. In their purest forms, envelope
and outphasing schemes construct their signals from ef-
Digital
Predistortion
Cartesian Feedback ficiently generated, nonlinear components, using mul-
Pre-
Source
tiplication and summing of their paths, respectively. A
Analog Doherty comprises a reference path, referred to as the
Polar Feedback
Correction Predistortion
“main” or “carrier,” and an efficiency path, named the
Location Analog Post-
Feedforward “peaking” or “auxiliary.” A more comprehensive math-
Post- Distortion
ematical analysis of the Doherty design is beyond the
Source Composition Fixed Filtering scope of this article and is available in a plurality of texts.
Schemes (e.g., Bandpass) For further information, the reader is especially referred
signal and whether that unwanted correction is ap- to Cripps.11
plied before or after its creation. Classification is use-
DOHERTY IMPLEMENTATIONS
ful to understand the general properties and identify
the best approach for the application. Arguably, the most common and often quickest start-
Feedforward is an example of a measured, post-cor- ing point for a Doherty amplifier design is the “zeroth
rection scheme; feedback is a measured, pre-correction embodiment” (see Figure 2), comprising a
scheme; and predistortion is a predicted, pre-correction • Fixed RF input to the final stage power splitter.
scheme. Predictive schemes rely on the unwanted signal • Main and auxiliary amplifiers, differently biased (e.g.,
being generated, which can potentially be onerous in using class AB and class C).
wider band and lower power systems for digital predis- • Doherty combiner made from a quarter-wavelength
tortion (DPD). On the other hand, predictive schemes transmission line.
do not require that distortion exists and can, potentially, In most applications, this architecture does not pro-
eliminate distortion completely. vide sufficient power gain—at least not from a single,
Missing from these examples is a whole class of linear- final stage—and additional gain stages are cascaded
ization techniques using predictive post-correction. This ahead of the power splitter. Criticism of this most com-
family of techniques has also been heavily researched monly used implementation include
• No method for compensating gain and phase varia-
tions in any domain after the design is frozen.
Class AB
• Both the efficiency and output power are traded-off
because of the bias class. In effect, the class C bias,
an open loop analog circuit, is driving this.
• Efficiency enhancement is limited to a single stage.
With a multistage cascade, this limits the perfor-
Class AB mance improvement, especially as gain diminishes at
higher frequencies.
Class C From another perspective, the Doherty engine is an
open loop scheme, with several key functional mecha-
s Fig. 2 Simplest implementation of the Doherty amplifier.
nisms derived from the bias points of the transistors.
0 100
Imain IAUX
Doherty –0.5
Relative Output Power (dB)
Main Combiner 80
PA
–1.0
Efficiency (%)
1.0 –1.5
Balanced 60
Auxiliary Output Current
Square Law –2.0
0.8
Ideal 40
–2.5
0.6
–3.0
Auxiliary Main 20
Auxiliary 0.4
–3.5
PA
0.2 –4.0 0
0 1 2 3 4 5 6
0 Conduction Angle (Rad)
0 0.2 0.4 0.6 0.8 1.0
Input Voltage
(a) (b) (c)
s Fig. 3 Doherty amplifier challenges: combiner amplitude and phase matching (a), auxiliary amplifier current response (b) and
power-efficiency trade-off (c).
18• Multiple gain stages inside the Doherty splitter and
Class AB combiner.
Class Opt • N-way Doherty.
• Intentionally dispersive splitter.
• Programmable splitter.
• Bias modulation.
• Supply modulation, i.e., adding a third efficiency
enhancement technique to the two leveraged by
Doherty.
• Envelope shaping.
s Fig. 4 Digital Doherty amplifier, where the main and auxiliary • Digital Doherty.
amplifier operating class is digitally controlled.
In addition to the different architectures available to
Once the other variables are defined (e.g., phase off- the designer, three points in the product life cycle allow
sets, splitter design, etc.), only one or two handles are adjustments. During the design phase, the design pa-
provided, upon which multiple critical adjustments rely. rameters can be modified, recognizing the parameters
will be passed to production as fixed values (e.g., the in-
Challenges put splitter design). During production, the parameters
One of the ways the Doherty improves efficiency is may be modified or tuned, typically based on measured
load modulation. The engine that drives that is the dif- data, and then frozen or fixed through programming.
ference in output currents, sourced into the combiner One example is the nominal bias voltage used to gen-
from two or more amplifiers. Since the engine can only erate the target bias current in the devices. Once the
approximate the Doherty operation, the challenge for equipment is deployed in the field, parameters may be
the designer is to enable the engine to approximate it updated, either continuously or at specific times, either
with the best, but still appropriate, cost-performance open or closed loop. Open loop concepts rely on suf-
paradigm. Some of the potential hindrances or impedi- ficiently predictable behaviors, while closed loop con-
ments to Doherty performance are 1) the amplitude and cepts might require built-in measurement and control.
phase matching of the signals incident to the combin- One example is circuitry for temperature compensation.
ing node, especially over frequency (see Figure 3a). De- These product life cycle options provide a plurality of so-
viation from the ideal degrades efficiency and output lutions with no “best” solution. It is just as important for
power. Potentially, this can be more destructive, as the the designer to be aware of the manufacturing and sup-
devices are intentionally not isolated, with the efficiency ply capabilities following the design as the design chal-
enhancement relying on their mutual interaction through lenges and trade-offs made during the design phase.
the combiner. 2) Ideally, the auxiliary path of the Doherty At the opposite end of the solution spectrum from
engine exhibits a dog leg or hockey stick characteristic the zeroth embodiment is the digital Doherty (see Fig-
(see Figure 3b). Failure to achieve the ideal is often the ure 4). This architecture is characterized by an input split
primary reason for not realizing the famous efficiency which stretches back into the digital domain, prior to the
saddle point. As the characteristic tends from the ideal digital-to-analog conversion. The ability to apply digital
to a linear response, the Doherty amplifier increasingly signal processing to the signal applied to both amplifier
behaves like its quadrature-balanced relative—albeit paths potentially gives unsurpassed performance from a
with a non-isolated combiner—especially its efficiency set of RF hardware. Compared to the standard Doherty
performance. 3) The commonly used “differential bias- implementation, the digital version can achieve 60 per-
ing” of the main and auxiliary operating in class AB and cent greater output power, 20 percent more efficiency
class C, respectively, forces the output power and ef- and 50 percent more bandwidth without degrading pre-
ficiency of both amplifiers to be degraded (see Figure dictive, pre-correction linearity.12
3c). As Cripps showed,11 the continuum of quasi-linear
amplifier classes from A to C, which theoretically oper- MEASUREMENT-AIDED DESIGN FLOW
ate with sinusoidal voltages across their sources, varies To optimize any Doherty design, it is advisable to
their respective maximum output power and efficiency build simulation environments that correlate well with
characteristics. At the same time, if biasing is used to the design, to understand trends and sensitivities. The
create the difference engine, as is the case in the classi- simulation enables a significant part of the development
cal Doherty embodiment, there is intrinsically a trade-off to be covered quickly. Inputs to the first step might in-
between output power and efficiency. Simultaneously, clude load-pull data or models for the candidate devic-
differential biasing increases the Doherty effect, yet de- es, a theoretical study of the combiner and matching
creases the achievable performance. network responses, evaluation boards with measured
data or other empirical data. Building on this starting
VARIANTS AND IMPROVEMENTS point, the design flow can be supplemented with mea-
The following variations on the basic concept may surement-aided design (see Figure 5).
be more appropriate for some applications and, with For the digital Doherty, the starting point for this ap-
the classical implementation, offer the designer perfor- proach is a Doherty comprising two input ports, input
mance and flexibility options. and output matching networks, active devices, bias net-
19works and the Doherty combiner (see Figure 6). Mea- The measurement algorithm may be rapid or more
suring the prototype Doherty as a dual-input device exhaustive, programmed to seek the optimum values
provides greater insight into the performance limita- for desired parameters or configured to characterize
tions, trade-offs and reproducibility expected in a pro- a wide range of parameters. In a simple case, the de-
duction environment. Critical to the test set-up are two signer may want to confirm the best-case quantities and
signal paths, whose signals may be varied relative to their relative amplitude and phase balance values. More
each other. In addition to applying precise, stable and complicated, a detailed sweep to enable a sensitivity
repeatable amplitude and phase offsets to the signals, it analysis or rigorous solution space search may be war-
is advantageous to be able to apply nonlinear shaping
to at least one of the signal paths.
45
3.60
42
44
40
Frequency (GHz)
3.55
44
30
32
42
34
40
36
38
Simulation Cut
and Try
3.50 35
Empirical Eval Board 3.45
Device Model Import 30
3.40
40
42
44
2 25
Something 0
0
46
40
Load-Pull –50
44
Else
42
Amplitude –2 –100 Phase
Difference (dB) –150 Difference (º) 20
Prototype Output Side (a)
Test as Dual-Input
45.0
3.60
.2
.4
43
43
5 8
444 444.
.6
44
Choose Optimum Architecture
44
4. 44.5
Frequency (GHz)
3.55 2 44
Design Review 44.0
3.50
Specification 43.5
3.45
45
45.2
43.0
45.2
Production 3.40
42.8
45
45
45.2
2 42.5
0
44.8
45
s Fig. 5 Measurement-aided design flow for a digital Doherty 0 –50
amplifier. Amplitude –2 –100 Phase 42.0
Difference (dB) –150 Difference (º)
(b)
DSP DAC Up-Converter Main Doherty Drain Efficiency (%) PSAT (W)
Unit PA Combiner 3 3
34
33
36
30
32
31
38
28
2 2
Amplitude Difference (dB)
Amplitude Difference (dB)
30
30
1 1
32 34
29
DAC Up-Converter Auxiliary
40
32
0 0
36
(a) PA
43
28
34
31
36
30
41
–1 –1
38
27
42
–2 –2
44
26
38 40
41 42
43 44
25
45
24
212
23
2
Doherty –3 –3
250 300 350 250 300 350
DUT
Phase Difference (º) Phase Difference (º)
(b) (c)
s Fig. 7 Dual-input Doherty in linear operation: measured
s Fig. 6 Simplified block diagram (a) and hardware setup (b) efficiency at 35.5 dBm (a), saturated power (b) and worst-case
for designing a digital Doherty amplifier. efficiency and power (c).
20You can also read