Eastern Ontario Trails Alliance: 2014-2023 Business Plan - June 12, 2014
←
→
Page content transcription
If your browser does not render page correctly, please read the page content below

Source: Eastern Ontario Trails Alliance
      Eastern Ontario Trails Alliance:
      2014-2023 Business Plan
      June 12, 2014

1   Millier Dickinson Blais: Eastern Ontario Trails Alliance Strategic Plan – Business Plan
Contents
      1    INTRODUCTION ..............................................................................................................................3

      2    OPERATIONAL PLAN .....................................................................................................................5
          2.1         ORGANIZATIONAL MANAGEMENT RELATIONSHIPS                                                                                        5
          2.2         RELATIONSHIPS WITH STAKEHOLDERS                                                                                                8

      3    FINANCIAL PLAN..........................................................................................................................10
          3.1         SCENARIO 1: EOTA’S STATUS QUO OUTLOOK                                                                                        11
             3.1.1        REVENUES                                                                                                                 11
             3.1.2        EXPENDITURES                                                                                                             14
             3.1.3        FORECASTING EOTA’S FISCAL TRAJECTORY                                                                                     19
          3.2         SCENARIO 2: VALUE-ADDED INVESTMENTS AND FINANCES                                                                             21
             3.2.1        FORECASTING EOTA’S POTENTIAL: CASES FROM SCENARIO 2                                                                      28

      4    MARKETING PLAN .......................................................................................................................31
          4.1         TARGET MARKETS                                                                                                               32
          4.2         MEDIA: REACHING THE TARGET MARKETS                                                                                           34

      5    ACTIVITIES PLAN .........................................................................................................................38
          5.1         TRAIL MANAGEMENT                                                                                                             40
          5.2         PARTNERSHIPS AND NETWORKING                                                                                                  42
          5.3         BUSINESS DEVELOPMENT AND VISITATION                                                                                          44
          5.4         ADVOCACY                                                                                                                     46

2   Millier Dickinson Blais: Eastern Ontario Trails Alliance Strategic Plan – Business Plan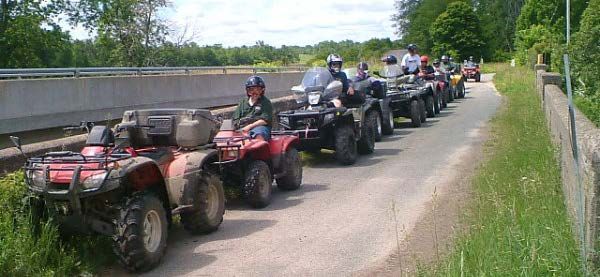
1
Source: Eastern Ontario Trails Alliance
Introduction
The Eastern Ontario Trails Alliance (EOTA) is a well-respected trails organization that
is recognized for providing consumers with a high-quality recreational experience.
This business plan interprets the principles of the EOTA 2014-2023 Strategic Plan
and offers more specific strategic direction that is both short and longer-term in
nature.
The following vision and 10 year goals emerge from the strategic plan and form the
basis of this document’s discussion:
In ten years, EOTA-manages a growing trail network that is:
increasing the number of active, healthy, and engaged local residents and visitors
building local and regional communities through community economic development
advocating for the continued success of Ontario’s trails and the organizations that care for them
self-sustaining, in terms of financing, operations, and organizational leadership
3 Millier Dickinson Blais: Eastern Ontario Trails Alliance Strategic Plan – Business Plan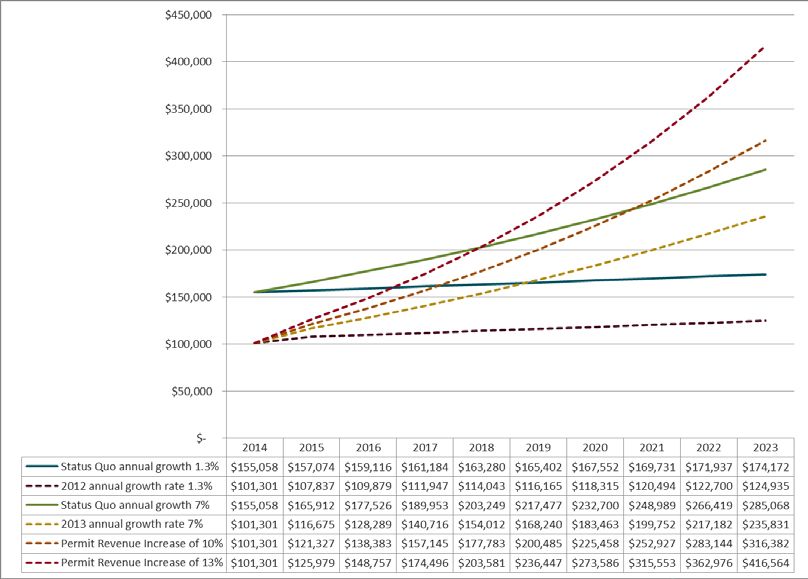
FIGURE 1: EOTA 10 YEAR GOALS

                                                                                                      All EOTA activities
               EOTA manages a                  EOTA trail network
                                                                                                          are actively
                growing, high-                      is a regional               EOTA’s diversified       supported by
                  quality trail                tourism destination                                                            EOTA inspires
                                                                                 funding model is     partners within the
              network, targeting a              that supports local            designed to support                          leadership at every
                                                                                                       service area, and        level of its
               diverse group of                    business and                the trail network on
                                                                                                        EOTA supports          organization.
              outdoor recreation               communities within               an ongoing basis.
                                                                                                      provincial advocacy
                   activities.                  its area of service.                                        efforts.

4   Millier Dickinson Blais: Eastern Ontario Trails Alliance Strategic Plan – Business Plan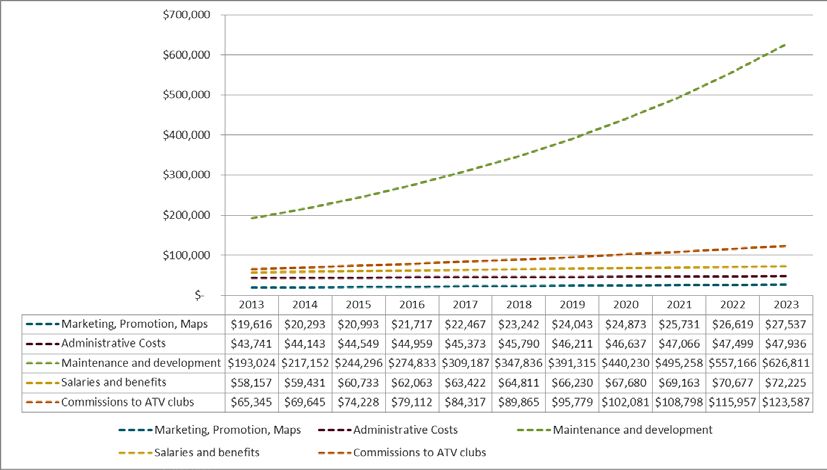
2                             Operational Plan
      The Operational Plan outlines EOTA’s organizational management structure and its external relationships with
      stakeholders as they will need to be developed for future success. The role of volunteers in EOTA is also discussed.

      2.1 Organizational Management Relationships
      EOTA has successfully secured enough revenue to support one full-time and one part-time staff person. Permanent staff
      have created a more professional organization with the ability to build long-term trust with municipal partners and
      increased the quality of the trails network. This is a strong step towards organizational sustainability.
      In order to meet the challenges of the new strategic plan, further expansion in EOTA’s staff is likely to be required. One of
      the benefits of additional staff positions is a greater ability to handle transitions between long-standing leaders/staff.
      In Figure 2, a new organizational chart is pictured that is designed to help EOTA meet its new goals. The general
      manager is responsible for the oversight of the organization, partnership development, raising the profile of the
      organization, ensuring strong governance practices are observed, and is its primary spokesperson. The administrator is
      responsible for communications, grant writing, ongoing office administration, and financial duties. As in any small
      organization, both staff are expected to work together to accomplish additional duties as needed.

5   Millier Dickinson Blais: Eastern Ontario Trails Alliance Strategic Plan – Business Plan
FIGURE 2: PROPOSED ORGANIZATIONAL PLAN
Board of Directors
General Manager
Contracted Trails
Office Fundraising and Special Projects
Maintenance
Administrator Marketing Director Coordinator Coordinator
In the future outlook, two additional positions are identified, plus one contract position that will function during specific
times of the year. The fundraising and marketing coordinator is a full-time (30 hours/week) position. Initially, the position
may be supported by grant funding to establish a more aggressive fundraising and marketing program within EOTA.
These responsibilities are currently held by existing staff, but will receive more attention and emphasis through a staff
presence.
Similarly, the special projects coordinator may not be permanent at first and may be reliant on grant funding until greater
revenue streams can be developed. The same person may even be able to take on two consecutive projects funded by
grants, as long as the funding does not rely on two consecutive internships. The special projects coordinator should
specialize in one of two strategic areas; either the project is designed to increase community relationships and
organizational revenues, such as a volunteer recognition program, projects that involve product development, such as a
trails master plan, or a visitation oriented project, such as a fundraising or social media trail marketing campaign that
would be executed with the support of the fundraising and marketing coordinator.
When special projects are designed, it is best if multiple focus areas are combined into one initiative. The following
examples of strong initial projects blend both objectives to ensure that organizational sustainability is enhanced by every
project.
Trails master planning: A coordinator responsible for the oversight of an update of a trails master plan for the EOTA
network, including communications with the public, user groups, and community groups (with the support of the
general manager). The trails master plan should research and be guided by the potential of new visitor markets. The
coordinator could also be responsible for marketing existing trails during the course of the project, when the master
6 Millier Dickinson Blais: Eastern Ontario Trails Alliance Strategic Plan – Business Plan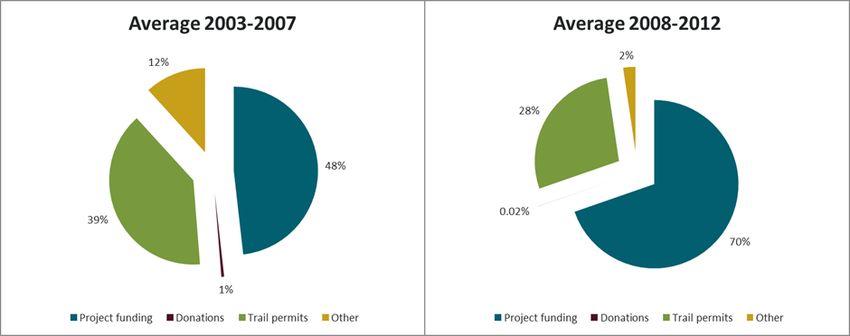
plan is in the research stages, for example, and may lead a social media campaign to enhance visitation and safety
awareness. This project would take a year to complete once started.
Volunteer engagement: A coordinator engages user groups and community groups to raise funds for a series of trail
development or enhancement projects across the EOTA trail network. Volunteers are part of the project development
process as well as fundraising, with the coordinator helping to support the projects and report to EOTA. Best
scheduled after the development of a trails master plan. This project would take two to three years to complete
depending on the scope of trail development undertaken.
One danger of a series of a grant-funded special projects coordinators is a legacy of new ongoing tasks that the manager
and administrator may not be able to add to their workload. It is important that the grants funded projects have a distinct
end date and job description of each staff member include “other tasks as needed” so that a few select legacy tasks can
continue on after being developed through the special projects portfolio. For example, the fundraising and marketing
coordinator may continue a social media campaign developed during the trails master planning project in future years,
should it be a successful.
The contracted trails maintenance coordinator will be a seasonal role that verifies trails quality and maintenance needs;
traditionally handled by the general manager. The contracted maintenance coordinator should work with trails partners
(municipalities, ATV clubs and snowmobile clubs) to identify priority needs and to promote synergies between all partners,
EOTA, and the Trails Master Plan. The role is seasonal because it is only required in the period leading to a season
change, such as the end of snowmobile season, and the changeover period. The coordinator would not personally
perform maintenance, but instead identify and work with the general manager to prioritize and plan forthcoming trails
maintenance based on short term (within the coming season), medium term (within two seasons), or long-term (within five
years) needs. The position should only be instituted once funding resources are secured.
7 Millier Dickinson Blais: Eastern Ontario Trails Alliance Strategic Plan – Business Plan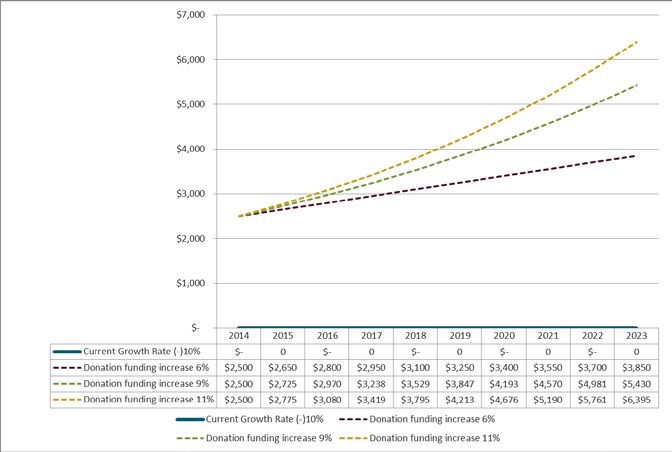
2.2 Relationships with Stakeholders
EOTA has an extensive network of stakeholders involved in the trail systems of Eastern Ontario. These stakeholders
include:
Municipal governments
Local business and accommodation providers
Trail user groups
Local residents
Regional Tourism Organizations and Destination Marketing Organizations
Provincial and Federal government departments
EOTA works with all of these stakeholder groups to deliver a high quality trails experience. Given EOTA’s central place
with its stakeholder groups, EOTA is best positioned to be a hub of knowledge and support for its various stakeholders (a
role they are already used to playing). Through a facilitative approach, EOTA can help its stakeholders meet their specific
needs, including trail management, marketing, funding, and instituting trail standards. A facilitative approach ensures that
EOTA leverages relationships within the network to benefit the trail network. In this regard, EOTA is the first contact for
trail stakeholders looking for information on best practices, wanting to partner with other stakeholders, or to learn more
about how to improve the trail experience in their local area. EOTA takes a variety of stakeholder groups, each with
varying motives, goals, and opinions, and unites them under a vision for the trail network and its future.
FIGURE 3 - FROM DIVERSITY TO VISION
Diverse EOTA
Stakeholder Groups Vision
8 Millier Dickinson Blais: Eastern Ontario Trails Alliance Strategic Plan – Business Plan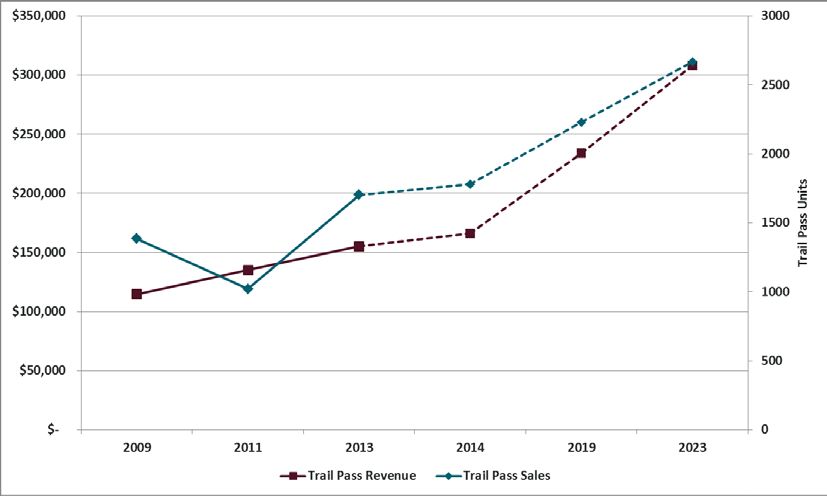
The Role of Volunteers
Volunteers play a large part in the operations of trail organizations around North America. An experienced, dedicated
volunteer effort can augment the efforts of trail groups tremendously while overcoming funding gaps that are common.
For EOTA’s part, volunteer groups play an active part with trail user groups (e.g. snowmobile and ATV clubs), with little
use of volunteers at a strategic organizational level. There is more room to build a strong cadre of volunteers to support
EOTA’s vision for the trail network. In particular, EOTA could benefit from the use of volunteers to:
Write grants or develop fundraising campaigns
Provide support at events, such as those organized by user or community groups
Support social media and other marketing campaigns
Build momentum for the trail network and the importance of buying a trail pass within the communities
Distribute information within each community
Form a local trail group to help manage particular sections of the trail network
Incorporating more volunteerism into EOTA is also an excellent way to generate a skilled, talented pool of engaged trail
advocates to support EOTA in its advocacy work. Volunteers embedded in the various trail communities can generate
discussion at the community level in a way EOTA cannot. Creating volunteer programs in local schools can also be an
excellent way to invest in future trail leaders that might one day work directly with EOTA or sit on the Board of Directors.
Finally, as additional coordinators are hired by EOTA to fill its organizational structure, the most likely pool of replacement
candidates will come from those active in volunteering that will have already become familiarized with the organization
and its objectives, and with whom the organization will already be acquainted.
9 Millier Dickinson Blais: Eastern Ontario Trails Alliance Strategic Plan – Business Plan3 Financial Plan
The financial plan consists of two broad scenarios. The first evaluates the present trajectory of revenue and expenses at
EOTA to project where it is will likely be in ten years if all trends remain as they currently are. This scenario also serves as
a baseline for the second scenario, which is a series of small value-adds which may help to supplement or increase
revenues. The data sources for the analyses are audited financial plans of EOTA, with some elaboration from annual
budgets. No projections have been based on annual budget data because these numbers are used as targets, and are
not verifiable. Furthermore, there are differences in the categorization of revenue and expenses in EOTA financial
statements compared to budget statements, making for poor transferability.
10 Millier Dickinson Blais: Eastern Ontario Trails Alliance Strategic Plan – Business Plan3.1 Scenario 1: EOTA’s Status Quo Outlook
EOTA, like any organization, has incoming revenue and outgoing expenditures. The current status quo for these can be evaluated and used
to make projections about future growth (or, in some cases, non-growth). These are taken in turn.
3.1.1 Revenues
EOTA formally derives revenue from four sources: donations, project funding, trail-pass sales, and “other.” Figure 4 shows EOTA revenue
over two five-year periods.
FIGURE 4: EOTA SOURCES OF REVENUE, 2033-2007 AND 2008-2012
Source: Eastern Ontario Trails Alliance,
Financial Statements, 2003-2012.
Donations
Donations have traditionally constituted the smallest amount of EOTA’s revenue. Figure 5 shows donation revenue between 2008 and 2012
represent only 0.02% of EOTA’s average revenue. The decline in annual donations is illustrated further in Figure 5. Moreover, donations
have not been higher than $1,000 since 2005.1 One main explanation for the declines, especially compared to the earliest years, is that
some funding has been reclassified as falling either within the “project funding” or “other” categories, thereby reducing the amount in the
donations category.
1
Eastern Ontario trails Alliance, Financial Statement, 2006.
11 Millier Dickinson Blais: Eastern Ontario Trails Alliance Strategic Plan – Business PlanFIGURE 5: EOTA HISTORICAL TRAJECTORY OF ANNUAL DONATIONS
Source: Eastern Ontario Trails Alliance, Financial Statements, 2008-2012.
EOTA does not actively seek donations. It does not have special fundraising campaigns for specific projects or organizational needs. There
can be positive outcomes associated with increasing donation revenue beyond having a little extra cash for projects or other EOTA needs.
First, having fundraising campaigns generates as sense of ownership within the communities that contribute. Second, receiving donations
also increases an organization’s profile when applying for grants because the worth of the organization is validated via community support.
Thus, decreased sense of ownership may translate to a less engaged community, whether or not they use the trails.
“Other” Revenue
The second smallest revenue stream is the “other” category, named so for miscellaneous sources not earmarked for
specific projects, geographic locations, or as grants form Government partners. It is unpredictable though necessary to
track miscellaneous revenue not falling within the other categories. Fiscal year 2003 had the highest “other” revenue at
$55,374, but likely because of ambiguity between categories where funding sources would later be re-categorized in
subsequent years, such as some forms of project funding. This revenue averages a median of $10,207, with 2005 seeing
the highest revenue ($21,875), and 2007 seeing the lowest ($6,284). 2 Forecasting to 2023 indicates that “other” revenue
could reach approximately $30,293.
2
Eastern Ontario Trails Alliance, Financial Statements, 2003-2012.
12 Millier Dickinson Blais: Eastern Ontario Trails Alliance Strategic Plan – Business PlanProject Funding
Project funding generally comes in two forms. First, EOTA receives some revenue directly from municipalities and counties, which is usually
earmarked to be re-invested into the geographic area where the funding has come from. These funds also serve as seed money for other
grant applications, thus and generate additional revenue.
An increasing number of municipalities are supporting EOTA on an ongoing basis. EOTA has also
been able to develop positive, long-term funding relationships with organizations, like Community
Futures Development Corporations, creating some measure of revenue predictability.
Despite these positive trends, EOTA’s project funding revenue has not been consistent. Although it
Revenue from
has increased by 11.5% annually since 2003, from year to year the revenue has varied significantly. Municipalities and
Counties
At its highest, EOTA project funding revenues equalled $526,294 in 2009, and at its lowest, $32,259
in 2005. This is EOTA’s strongest source of revenue, but it is also the least predictable. Based on
historic growth rates, EOTA’s project funding revenue could reach as high as $762,580 by 2023.
Grants from
Government
agencies and
departments
Trail Pass Purchases
Internal EOTA documents show the trend in trails pass sales and trails pass revenues (including
commissions from partners for sales) from 2009 through 2013, summarized in Figure 6. 3 Revenue Project funding
for maintenance
grew at a rate of 7.1% from 2009 ($114,262) to 2013 ($155,068), indicating that by 2023 it could be and trail
around $307,905. Between 2009 and 2013, trail passes revenue increased by a total of 35.3 percent, development
but the number of units sold only grew at a rate of 22.9% over the same period. Because EOTA trails
passes exist for different applications, the higher sales revenue rate likely reflects increases in one or
more specific categories of trail pass. It may also be explained by commissions owed to EOTA from
other partners.
3
These data have been provided by Eastern Ontario Trails Alliance from their internal records. The data have not been subject to financial scrutiny by a third party.
13 Millier Dickinson Blais: Eastern Ontario Trails Alliance Strategic Plan – Business PlanFIGURE 6: TRAIL PASS SALES AND REVENUE, PROJECTIONS 2014-2023
Source: Adapted from Eastern Ontario Trails Alliance, Internal documents, displayed with permission.
Data from financial statements up to and including fiscal year 2012 estimated only modest growth of 1.3% per year, but
unconfirmed sales figures for 2013 indicate that the forecasted amount of $141,314 was surpassed by $13,754. If EOTA
can maintain the momentum shown in 2013, growth forecasts will continue to remain more positive.
3.1.2 Expenditures
EOTA expenditures are most easily summarized in the following five categories: marketing, promotion and maps;
administrative costs; maintenance and development; salaries and benefits; and commissions to ATV clubs. The
organization’s expenditure history is summarized in Figure 7 and a discussion of each expenditure category follows.
Projections for all five categories are also shown in Figure 8.
14 Millier Dickinson Blais: Eastern Ontario Trails Alliance Strategic Plan – Business PlanFIGURE 7: EOTA EXPENDITURE HISTORY, ABREVEATED
2003 % 2006 % 2009 % 2012 %
Marketing, Promotion & Maps $ 14,096 7.5% $ 36,706 17.0% $ 18,453 2.9% $ 18,962 5.4%
Administrative Costs $ 94,361 50.1% $ 57,338 26.6% $ 48,217 7.6% $ 43,342 12.3%
Maintenance and development $ 74,807 39.7% $ 76,464 35.5% $ 476,523 74.9% $ 171,577 48.7%
Salaries and benefits $ 4,993 2.7% $ 41,102 19.1% $ 52,312 8.2% $ 56,911 16.2%
Commissions to ATV clubs $ - 0.0% $ 3,875 1.8% $ 40,785 6.4% $ 61,311 17.4%
Total $ 188,257 100.0% $ 215,485 100.0% $ 636,290 100.0% $ 352,103 100.0%
Source: Eastern Ontario Trails Alliance, Financial Statements, 2003-2012
FIGURE 8: PROJECTIONS FOR EXPENDITURES BASED ON HISTORIC GROWTH RATES, 2003-2012
Source: Eastern Ontario Trails Alliance, Financial Statements, 2003-2012.
15 Millier Dickinson Blais: Eastern Ontario Trails Alliance Strategic Plan – Business PlanMarketing, promotion and maps
EOTA has invested in marketing and promotion since 2003, with a few large infusions of funding, such as $61,421 in 2005 or $75,000
budgeted in 2013. 4 EOTA has expressed that $75,000 per year would be an ideal budget amount for this category. Historic growth trends
indicate that marketing will likely grow by 3.5 annually, barring exceptional investments. This equates to $23,242 annually by 2018 and
$27,537 by 2023.
Marketing, Promotion & Maps
2003 2004 2005 2006 2007 2008 2009 2010 2011 2012
$ 14,096 7.5% $ 21,476 13.2% $ 61,421 29.3% $ 36,706 17.0% $ 8,792 4.6% $ 34,397 12.3% $ 18,453 2.9% $ 28,101 5.4% $ 22,103 4.1% $ 18,962 5.4%
Source: Eastern Ontario Trails Alliance, Financial Statements, 2003-2012
Administrative costs
Administrative costs pertain to the daily operations of EOTA, including equipment, office space, travel, and professional fees such as
insurance, accounting, and legal fees. Administrative costs represent a small portion of annual expenditures, at an average of approximately
8% since 2008. Travel costs and office and printing represent the most variable expenses. Travel is contingent on other business matters,
such as attending promotional events or trade-shows, and the need to inspect the expansive trails network, while office expenses can
fluctuate as new technology or equipment is required. Projections based on historical data indicate that EOTA’s administrative costs would
be approximately $45,790 by 2018 and $47,936 by 2023; not a significant drain on resources.
Administrative Costs
2003 2004 2005 2006 2007 2008 2009 2010 2011 2012
$ 94,361 50.1% $ 72,133 44.3% $ 55,299 26.3% $ 57,338 26.6% $ 41,329 21.5% $ 41,442 14.9% $ 48,217 7.6% $ 54,229 10.4% $ 35,252 6.5% $ 43,342 12.3%
Source: Eastern Ontario Trails Alliance, Financial Statements, 2003-2012
4
Eastern Ontario Trails Alliance, Financial Statements, 2003-2012; Eastern Ontario Trails Alliance, Budget Statement, 2013.
16 Millier Dickinson Blais: Eastern Ontario Trails Alliance Strategic Plan – Business PlanMaintenance and development
Before proceeding to the direct expenses of EOTA for maintenance and development as outlined in financial statements from 2003 to 2012,
an important discussion of the nature of cost and burden sharing is in order to reflect the reality by which various partners come together to
maintain the trails systems shown in EOTA maps.
Three broad partner groups are illustrated in Figure 9,
which describes the flow of capital toward trails FIGURE 9: MAINTENANCE AND DEVELOPMENT FUNDING SCHEMATIC
(ARROWS REPRESENT FLOW OF CAPITAL)
maintenance and development within EOTA’s network. To
begin, commissions flow from EOTA to ATV clubs based
on the sale of permits, which are legally compelled to re-
invest commissions from trail permit sales into
maintenance and development of EOTA trails. Also, some
ATV club members buy their trail passes directly through
the ATV club and those funds either go to EOTA in project
support or are also reinvested into maintenance within the
network.
Next, EOTA is also partnered with local chapters of the
Ontario Federation of Snowmobile Clubs (OFSC), where a
portion of snowmobile registration is sent to EOTA every
year and used for maintenance and development. Also
OFSC chapters directly invest in maintenance and
development of the network for some projects. As such
OFSC either pays EOTA to oversee trails maintenance or
oversees it itself on trails that are part of the EOTA
network.
Finally, municipal partners either fund EOTA to maintain
and develop trails or they do so directly themselves.
EOTA’s relationship with all three partner groups is
complex, and these descriptions do not even begin to Source: Millier Dickinson Blais, Adapted from Eastern Ontario Trails Alliance.
discuss how sometimes one partner will fund one aspect
of a project (such as the cost of materials) while EOTA funds another (such as labour).
17 Millier Dickinson Blais: Eastern Ontario Trails Alliance Strategic Plan – Business PlanTrue of all three, maintenance and development funding is sometimes in the form of in-kind support (i.e. resources, materials, or even human
capital), while other times the same reciprocity is shown to partners by EOTA. Often such agreements are the result of ad-hoc negotiations
depending on immediate needs of the coming season, though partners that recognize the return on investments are increasingly adding
EOTA funding to their budget lines. Therefore, as time goes by the process is becoming more efficient.
Below it will be shown that in 2012 EOTA spent $171,577 on trails maintenance and development, but it is important to acknowledge that this
number is only a part of a much larger funding system that exists flowing from partner organizations and municipalities back into the network
as well. As EOTA implicates itself further with Ontario Motor Sports Working Group to lobby for a centralized motor sport organization, the
logic for an annual fund of $1.5 million for EOTA network trails becomes clearer. The price approximates the estimated collective burden the
trails maintenance and development (and other costs such as marketing and insurance) place on all the stakeholders affiliated with the
EOTA network.
In summary, as the discussion below proceeds to investigate EOTA’s maintenance and development expenses, it is important to recognize
they represent only a part of the larger picture which EOTA coordinates every year with its partners.
Maintenance and development expenses are directly affected by project funding, which explains the fluctuations of expenditures from year to
year. EOTA’s expenses align with project funding, peaking in 2009, 2010, and 2011. From 2003 to 2012, maintenance and development
annual growth has been 12.9% annually. These maintenance costs occur within EOTA’s administrative area of the network, but also
represent costs where it has partnered to share costs.
Some maintenance projects are easier to anticipate than others. EOTA understands its ongoing maintenance requirements, allowing for
easier forecasting in this area. It can evaluate maintenance needs based on high, moderate, and low cost scenarios, but unforeseen
expenses may arise due to weather events or damage.
Maintenance and development
2003 2004 2005 2006 2007 2008 2009 2010 2011 2012
$ 74,807 39.7% $ 55,061 33.8% $ 86,774 41.3% $ 76,464 35.5% $ 64,732 33.7% $ 105,578 37.9% $ 476,523 74.9% $ 334,339 63.9% $ 379,363 70.3% $ 171,577 48.7%
Source: Eastern Ontario Trails Alliance, Financial Statements, 2003-2012.
Salaries and benefits
EOTA employs one general manager (full-time) and one office administrator (3.5 days per week). Additional staff is sometimes hired under
the “project-funding” revenue stream to conduct a particular project or set of projects. Fees and deliverables are decided on an ad-hoc basis.
Early in its history, in 2003, EOTA was clearly a labour of love, with total spending on salaries and benefits a mere $4,993. By 2012 this
expenditure had grown to $56,911, an increase of 104%, or 10.4% per year on average. Projecting from historical growth, expenditures on
salaries and benefits may reach $168,988 by 2023, but more realistically, based on historical data since 2008 will likely only grow at a rate of
18 Millier Dickinson Blais: Eastern Ontario Trails Alliance Strategic Plan – Business Plan2.2% per year. This value does not include project funding that may have paid for specific work done on a short-term basis for a particular
project or series of projects.
Latest figures from EOTA estimate the general manager earns $40,000 annually, while the administrative assistant earns $20,000 annually.
Contributions to Canada Pension Plan and income tax amount to $12,000 per year for both employees, for a total of $62,000 per year; a
figure slightly higher than the most recent financial statement from 2012, but matching estimates outlined in EOTA’s 2013 and 2014 budgets.
Salaries and benefits
2003 2004 2005 2006 2007 2008 2009 2010 2011 2012
$ 4,993 2.7% $ 8,245 5.1% $ 2,435 1.2% $ 41,102 19.1% $ 41,260 21.5% $ 51,302 18.4% $ 52,312 8.2% $ 54,186 10.4% $ 53,416 9.9% $ 56,911 16.2%
Source: Eastern Ontario Trails Alliance, Financial Statements, 2003-2012.
Commissions to ATV clubs
EOTA pays commissions to local ATV clubs based on trial pass sales. The proportion of annual expenditures paid to such clubs ranges
between 1.8 and 18.7% of EOTA’s total budget since 2004. The amount has increased at an annual rate of 105 since first registering in
2004, its earliest year on record. It grew sharply between 2006 and 2007 (from $3,875 to $35,979), but leveled off generally thereafter,
increasing at a rate of only 6.6% per year from 2008. More information is needed to fully understand how commissions are allocated to ATV
clubs, but projections estimate that if current trends continue, expenditures of this form will approximate $123,587 by 2023. This projection is
the least reliable because the formula of calculating EOTA’s share of ATV club revenue is not known to the consultant team, meaning it is
difficult to cross-reference with other variables such as trails pass revenue.
Commissions to ATV clubs
2003 2004 2005 2006 2007 2008 2009 2010 2011 2012
$ - 0.0% $ 5,833 3.6% $ 4,000 1.9% $ 3,875 1.8% $ 35,979 18.7% $ 46,130 16.5% $ 40,785 6.4% $ 52,492 10.0% $ 49,828 9.2% $ 61,311 17.4%
Source: Eastern Ontario Trails Alliance, Financial Statements, 2003-2012.
3.1.3 Forecasting EOTA’s Fiscal Trajectory
Projections have been made for revenues and expenditures based on historic data. These trends indicate that if growth continues along its
current trajectory, there is potential to reach the specified 2023 values. It’s important to note that it is within EOTA’s control to set limits to the
level of growth or decline by intervening in the budgeting process.
The following details summarize the findings:
Donation revenue is nearly non-existent, and will continue to remain around zero unless addressed
19 Millier Dickinson Blais: Eastern Ontario Trails Alliance Strategic Plan – Business Plan Project funding can be expected to grow to as much as $762,580 by 2023, but the high variability of from year to year
makes the prediction difficult
Trail permit sales have relatively plateaued since around 2007 and will likely increase only modestly, though this
revenue source is the most consistent
Marketing expenses may have some correlation with sales pass revenue, but likely in combination with other factors
The cost projections for revenues and expenditures are listed in Figure 8.
FIGURE 10: EOTA HISTORICAL PROJECTIONS FOR REVENUE AND EXPENDITURES, 2014-2023
Audited Revenue Projected
Annual
Revenues Growth Rate 2010 2011 2012 2014 2017 2020 2023
Project funding 11.5% $ 364,639 $ 367,127 $ 230,283 $ 286,294 $ 396,859 $ 550,124 $ 762,580
Donations -10.0% $ 75 $ 43 $ - $ - $ - $ - $ -
Trail permits 1.3% $ 126,230 $ 133,905 $ 139,500 $ 143,151 $ 148,806 $ 154,686 $ 160,797
Other 10.4% $ 10,202 $ 10,188 $ 10,202 $ 12,434 $ 16,731 $ 22,513 $ 30,293
Total Revenue $ 501,146 $ 511,263 $ 379,985 $ 441,879 $ 562,397 $ 727,323 $ 953,670
Audited Expenses Projected
Annual
Expenditures Growth Rate 2010 2011 2012 2014 2017 2020 2023
Marketing, Promotion, Maps 3.45% $ 28,101 $ 22,103 $ 18,962 $ 19,616 $ 22,467 $ 24,873 $ 27,537
Administrative Costs 0.92% $ 54,229 $ 35,252 $ 43,342 $ 43,741 $ 45,373 $ 46,637 $ 47,936
Maintenance and development 12.50% $ 334,339 $ 379,363 $ 171,577 $ 193,024 $ 309,187 $ 440,230 $ 626,811
Salaries and benefits 2.19% $ 54,186 $ 53,416 $ 56,911 $ 58,157 $ 63,422 $ 67,680 $ 72,225
Commissions to ATV clubs 6.58% $ 52,492 $ 49,828 $ 61,311 $ 65,345 $ 84,317 $ 102,081 $ 123,587
Total Expenditure $ 523,347 $ 539,962 $ 352,103 $ 379,884 $ 524,766 $ 681,500 $ 898,096
Source: Eastern Ontario Trails Alliance, Financial Data, 2003-2013. Amounts for “Trails Permits” have not been adjusted for newly acquired data for
2013, which increases the annual growth rate to 7.1%. Adjusted projections would be $166,078 (2014), $204,023 (2017), $250,639 (2020) and
$307,905 (2023). Since equivalent updates for other categories are not available, all data in the tables are based on projections beginning from the
confirmed financial year data from 2012.
20 Millier Dickinson Blais: Eastern Ontario Trails Alliance Strategic Plan – Business Plan3.2 Scenario 2: Value-added Investments and Finances
This scenario outlines a few possibilities that depart from the historical trajectory of EOTA. The second scenario is organized around seven
general financial goals. For each goal a brief rationale is given and projections are provided, where possible, based on target ranges and
historical data.
a) Invest in a Fundraising and Marketing Coordinator
EOTA has done an enormous amount of work, but imagine the possibility if there was a staff person whose sole responsibility was to earn
new revenue through increased trail pass sales, government grants, and other sources. The position would require an investment of $16-$20
per hour, at 30 hours (4 days) per week, totalling between $24,960 and $31,200. The pay-scale would be commensurate upon experience
and time with the organization (i.e. would generally start at the low end and increase incrementally). The salary could be enhanced through
commissions. The increase in allowable weekly hours would be subject to the approval process of EOTA’s board of directors. The salary
would be earmarked accordingly in the annual budget as “fundraising and marketing coordinator,” for transparency’s sake.
The office should be for an individual whose main responsibilities include the following:
Improving grant funding, especially at the Provincial level, where it is comparatively lacking
Work with media to promote the trail network to visitors with a goal of attracting between 7 and 13% more trail pass purchasers per year
Explore crowd-sourcing funding opportunities for specific projects with wide geographic appeal
Increasing the online presence of EOTA through social media campaigns and other new communications initiatives (toward the same
goal of 7 to 13% trail pass increase)
Organizing fundraising initiatives with the support of user groups and community groups, such as community drives, social-
club/philanthropic association donations, gala/dance party/hoedown fundraisers, and BBQ/corn-roasts; starting with a goal of raising
$2,500 and cumulatively between six and nine for each subsequent year 5
Work with user group and community group volunteers on specific event coordination
EOTA’s newest addition would require an initial investment before the effects of the coordinator begin to pay off. Grant funding may support
some of the costs outlined here and ease the strain on EOTA and risk while the investment is yet to show results. Office space, supplies, and
technology will increase budget demands. The addition of a new phone line can be costly, but there are modern low-cost alternatives through
VoIP networks and internet technology companies specializing in digital phone networks are becoming competitive. These systems provide
multiple phone line bundles that are handled through a network router. Details of annual and start-up costs affiliated with a new coordinator
are provided in Figure 9.
5 This suggested rate is intentionally modest to allow for EOTA to develop the institutional capacity to address donations in coordination with volunteers and other contributors. There are
also natural attrition rates at which some community partners may eventually reduce or discontinue their contributions.
21 Millier Dickinson Blais: Eastern Ontario Trails Alliance Strategic Plan – Business PlanFIGURE 11: ANNUAL AND START-UP COSTS ASSOCIATED WITH NEW FUNDRAISING AND MARKETING COORDINATOR, ACCORDING TO PAY SCALE
Annual Costs Low High
Hourly wage 16 20
Hours per week 30 30
Gross Annual Salary $ 24,960 $ 31,200
CPP @ 5.95% $ 1,235.52 $ 1,544.40
Annual Phone line $ 60 $ 60
Benefits ? ?
Total Annual Cost $ 26,256 $ 32,804
One time Start-up Costs
Office Computer $ 1,500
Phone Line Install $ 200
Desk and Chair $ 300
Sub-Total $ 2,000
Taxes $ 260.00
Total $ 2,260
Source: Millier Dickinson Blais
b) Increase Trail Pass Revenue
With an aggressive marketing campaign, building off similar success in 2013 where the annual growth rate jumped from the previous year’s
rate of 1.3 to 7.1%,6 EOTA can aim for 10 to 13% annual growth in trail pass revenues, as in Figure 10. By 2019, EOTA could expect
between $217,477 and $285,684, compared to $165,402 it would be projected to capture based on 2012’a historic average of 1.3%.7 By
2023, EOTA could post revenues ranging from $285,068 to $465,801.
6 The data obtained by Millier Dickinson Blais for 2013 trail pass revenue has been provided by EOTA but has not been verified by independent audits in Financial Statements for the fiscal
year 2013.
7 Eastern Ontario Trails Alliance, Financial Statements 2007 to 2012.
22 Millier Dickinson Blais: Eastern Ontario Trails Alliance Strategic Plan – Business PlanFIGURE 12: TRAIL PASS REVENUE PROJECTIONS
Source: Millier Dickinson Blais
c) Identify Level of Investment for Maintenance and Development and Contracted Maintenance and Development Coordinator
EOTA must identify the correct trails investment level based on its own expert knowledge; a number that represents the ideal average
maintenance and development cost per kilometre of EOTA trail. This “sweet spot” should be relatively firm, with revisions every several years
based on historical observations and changes in service, contracting costs, or inflation.
Given that EOTA works with numerous partners and only contributes direct funding to approximately half of the network, projections cannot
be made for the entirety of the network’s cost relative to trail growth without data from other partners. At a minimum, EOTA records indicate it
directly administers 1,200 kilometres of trails. This is the closest proxy to per kilometre cost available. In 2003 it directly administered 230
kilometres at a cost of $325 per kilometre, and 1,200 kilometres in 2013 at a cost of $197. The cost per kilometre has declined over the
period, despite the increase in the kilometres directly administered by EOTA. This is encouraging for EOTA’s growth, but must be tempered
with the reality that benchmarks need to be identified as to the ideal level of spending per kilometre of trail within EOTA’s operational area.
Understanding the ideal level of spending will allow better assessments of where and when growth of EOTA’s trails is advantageous.
23 Millier Dickinson Blais: Eastern Ontario Trails Alliance Strategic Plan – Business PlanA new contract position, Trails Maintenance Coordinator, is recommended to help identify and plan for maintenance needs across the
network and to coordinate mitigation or remediation planning. The position will require funding that is not currently built into EOTA’s annual
budgets. Earmarked grant-funding is suggested as the ideal source to procuring partial funding of the position, which will likely operate for a
combined total of 6 months per year during key overlaps between winter-spring and fall-winter transitions.
The position should be occupied by an individual that is familiar with the general network and some of its key partners. Much of the work
should be conducted via correspondence with partners in municipal governments or affiliated clubs, with some field work as well. Overall,
some savings is expected to occur as the general manager would be unburdened from her current obligation to perform such tasks as time
permits and with significant travel expenses. The proposed position instead remains relatively centralized and acts as a coordination hub for
maintained across the network to the standards outlined in the future trails master plan. Part of the mandate of the coordinator will be to
assess the per kilometre cost of different legs of the network to identify areas of excess cost.
The hourly wage should be based on the same scale as outlined in the role for the fundraising and marketing coordinator above; though the
total annual cost will be lower because of the seasonal nature of the employment. Though a budget may not be available for such a role in
EOTA’s immediate future, the position should be created during the process of completing the trails master plan.
FIGURE 13: ANNUAL AND START-UP COSTS ASSOCIATED WITH NEW TRAILS MAINTENANCE COORDINATOR, ACCORDING TO PAY SCALE
Annual Costs Low High
Hourly wage 16 20
Hours per week 30 30
Gross Annual Salary $ 12,480 $ 15,600
CPP @ 5.95% $ 617.76 $ 772.20
Annual Phone line $ 60 $ 60
Benefits ? ?
Total Annual Cost $ 13,158 $ 16,432
One time Start-up Costs
Office Computer $ 1,500
Phone Line Install $ 200
Desk and Chair $ 300
Sub-Total $ 2,000
Taxes $ 260.00
Total $ 2,260
Source: Millier Dickinson Blais. Note: This position is based on a
26 week per fiscal year budget, subject to contractual agreement.
24 Millier Dickinson Blais: Eastern Ontario Trails Alliance Strategic Plan – Business Pland) Increase Donor Support Revenue
Donations constitute the smallest amount of revenue at EOTA. As discussed in a previous section, donation revenue between 2008 and
2012 represented only 0.02% of EOTA’s average revenue. Historically, donations have not been greater than $1,000.
As discussed, EOTA does not actively seek donations; however options exist to increase donation revenue without over-investing human
capital.
Sources of future revenue in the donation category may come from philanthropic organizations, community members or community leaders,
or social organizations. Many non-profit organizations seek out donors who are willing to invest on a monthly or annual basis, creating a
revenue stream that is easy to integrate into budget planning. Pledge drives may also help, especially if integrated with efforts to engage
user groups, community organizations or other community volunteers. A pledge drive allows people to make connections between their
donation and a specific outcome, such as a trails project, that is important to their community.
Fundraising efforts can be strategically targeted, and benefit the organization in terms of community engagement and volunteer outreach.
Many high schools have a minimum requirement of volunteer hours before graduation. While there are challenges involved in engaging
volunteers, there are also significant rewards, both tangible, in that volunteers can help EOTA meet its goals, and in terms of the
communities’ support of EOTA’s activities. Revenue from fundraising can be used for trail development projects and community related
expenses, such as signage or parking-lot map boards. Examples of fundraising initiatives include:
Social-club/philanthropist organizations
Themed Gala events/parties/festivals with raffles
BBQs or Corn Roasts
Student-run community drives
Crowd sourcing campaigns through social media
The organization of fundraising initiatives and events can be undertaken with the support of user groups and other
community organizations. Based on an initial goal of $2,500 revenue for 2015, revenue projections are offered for 6, 9,
and 11% on a 10 year horizon in Figure 13. Though the amount is not entirely large it must be seen for its supplemental
qualities and symbolic investment in community involvement. The modest targets represent realistic goals, given that the
fundraising position may not even be full-time to begin.
25 Millier Dickinson Blais: Eastern Ontario Trails Alliance Strategic Plan – Business PlanFIGURE 14: PROJECTIONS FOR DONATION REVENUE INCREASES
Source: Millier Dickinson Blais
e) Earmark Long-term Budget Items as Investments
In general, it is good practice to strive to maintain a balanced budget from year to year; however, sometimes circumstances arise where
funding may need to be carried over or invested for the medium or long-term for unforeseen circumstances. A common myth among non-
profits is that they cannot hold a surplus from year to year. In fact, as long as 3.5%, or greater, of revenue is spent by a registered charity, the
remaining funds can be invested or reserved, provided revenues are not directly or indirectly allocated to a ”member, director or officer”, with
the exception of employee salaries, and provided the organization has its financial statements audited yearly.8
If there is further debate on this point, a meeting with an attorney specializing in legal matters as they pertain to not-for-profits is
recommended to satisfy any concerns. It is understood that not-for-profits can save additional monies as a carry-over from one year to
another, provided the money is accounted for and the above criteria are met.
8
Province of Ontario, Ontario Not-for-Profit Corporations Act, 2010; Canada Revenue Agency, Disbursement Quota Calculation, March 4, 2010.
26 Millier Dickinson Blais: Eastern Ontario Trails Alliance Strategic Plan – Business PlanThis Business Plan proposes two means of financial planning where holding a surplus for a period of a year or longer would be
advantageous; for special long-term project savings earmarked appropriately in annual budgets and for a contingency fund.
Medium and Long-Term Projects
Most EOTA projects can be dealt with by prioritizing spending within the annual budget cycle, but some projects may require significant
investment that would possibly fall outside of what EOTA could expect to receive in a single year’s revenues. Take for example a large
infrastructure project identified requiring work within the coming two or three years. It makes economic sense to portion parts of two or
more annual budgets toward that large project in order to build enough reserve to deal with the expenses of the project. As long as the
money is clearly designated as a line item in a budget, and appropriately identified in financial statements to be audited, the practice not
only makes investment easier but also looks more organized. Three considerations are required, the importance and urgency of the
project, the timeframe leading up to and including work on the project, and the estimated cost of the project. Having a mechanism in
place for this form of investment does not mean that there always has to be money being saved for a rainy day, but rather, that in
identifying specific projects when needed that meet the appropriate criteria (which should be determined by EOTA’s board of directors).
Contingency Fund for Emergencies
It is a best practice of any organization to be prepared for unforeseen expenses, be they legal, infrastructural, or other. A contingency
fund is a safety net of saved revenue that rests at an amount proportionate to the available budget from one year to another. The
cushion is not the same thing as a rainy-day fund, but instead meant for surprise expenditures that are not part of a budget.
The point of a contingency fund is that an organization should almost never have to use it, but in the event that it needs capital for an
unforeseen cost, it is there as an insurance policy. For example, if an organization’s general manager needs to take prolonged time off,
requiring the retention of additional employees, a reserve fund may ensure enough human resources are available and adequately paid.
Similarly, if a lawsuit were initiated incurring unforeseen legal fees, a contingency fund may mitigate the financial strain placed on an
organization. Finally, funding may cover interim costs while waiting for insurance claims to be processed in the event of an accident or
damaged property.
EOTA needs to build a contingency fund over the medium term so that with 5 years the fund can value approximately 3 to 5% of an
annual budget. A budget of $505,700 would yield between $15,000 and $25,000 of reserve funding and be earmarked appropriately. 9
9
Eastern Ontario Trails Alliance, Annual Budget, 2014.
27 Millier Dickinson Blais: Eastern Ontario Trails Alliance Strategic Plan – Business Plan3.2.1 Forecasting EOTA’s Potential: Cases from Scenario 2
This scenario represents some initial investment on the part of EOTA for two coordinators’ salaries, benefits, and Canada Pension Plan
contributions, as well as office supplies and equipment, but these costs are predictable and can generally be anticipated. Projections are
based on the average growth rate for each variable as well as target growth rate ranges for each variable. A status quo model is also
provided for each indicator based on historic growth patterns.
Figure 15 shows that in its first year a new coordinator would cost at most $35,064 and no greater than $32,804 in subsequent years. If
positioned as a project coordinator, grant funding could be used to support some or all of this expense. A second coordinator operating
seasonally would constitute an initial cost of at most $18,692 its first year and $16,432 subsequently. In total, spending on the two roles
annually would range between $43,933 and 53,757 for the first year and between $39,413 and $49,237 subsequently.
FIGURE 15: START-UP AND ONGOING ANNUAL COORDINATOR COSTS
Marketing and Communications Coordinator Trails Maintenance Coordinator (contract)
One time Start-up Costs One time Start-up Costs
Office Computer $ 1,500 Office Computer $ 1,500
Phone Line Install $ 200 Phone Line Install $ 200
Desk and Chair $ 300 Desk and Chair $ 300
Sub-Total $ 2,000 Sub-Total $ 2,000
Taxes $ 260.00 Taxes $ 260.00
Total $ 2,260 Total $ 2,260
Annual Costs Low High Annual Costs Low High
Hourly wage 16 20 Hourly wage 16 20
Hours per week 30 30 Hours per week 30 30
Gross Annual Salary $ 24,960 $ 31,200 Gross Annual Salary $ 12,480 $ 15,600
CPP @ 5.95% $ 1,235.52 $ 1,544.40 CPP @ 5.95% $ 617.76 $ 772.20
Annual Phone line $ 60 $ 60 Annual Phone line $ 60 $ 60 Cummulative Totals
Benefits ? ? Benefits ? ? Annual Costs Low High
Cummulative Annual
Total Annual Cost $ 26,256 $ 32,804 Total Annual Cost $ 13,158 $ 16,432 Total $ 39,413 $ 49,237
Total Combined Cost Total Combined Cost Cummulative
Year 1 $ 28,516 $ 35,064 Year 1 $ 15,418 $ 18,692 combined cost Year 1 $ 43,933 $ 53,757
Year 2 $ 26,256 $ 32,804 Year 2 $ 13,158 $ 16,432 Year 2 $ 39,413 $ 49,237
Year 3 $ 26,256 $ 32,804 Year 3 $ 13,158 $ 16,432 Year 3 $ 39,413 $ 49,237
Source: Millier Dickinson Blais. Note: the Trails Maintenance Coordinator role is for a 26 week fiscal budget subject to contractual agreement.
28 Millier Dickinson Blais: Eastern Ontario Trails Alliance Strategic Plan – Business PlanFigure 16 provides a comparison between projected permit revenue increases based on targets ranging from 10 to 13% and the exact same
values minus the initial cost of employing and installing a new fundraising and marketing coordinator and a trails maintenance coordinator.
Based on the figure, at the 7% annual growth rate, EOTA could expect to see a return on investment (ROI) by 2019, where after expenses
revenues would be $168,240. For 10% annual growth (i.e. an increase of 3% from 2013 figures) the ROI would arrive one year earlier, and
likewise again for 13%, seeing revenues of $174,496 in. Further clarity is given in Figure 17, where the projected revenue increases are
plotted on a line graph. Importantly, at the historical growth rate measured in 2012, EOTA would never see a return on investment
FIGURE 16: EFFECT OF NEW COORDINATOR ON PERMIT REVENUE INCREASE
Projected Revenues for Permit Sales Increases
2014 2015 2016 2017 2018 2019 2020 2021 2022 2023
2012 annual growth rate 1.3 % $ 155,058 $ 157,074 $ 159,116 $ 161,184 $ 163,280 $ 165,402 $ 167,552 $ 169,731 $ 171,937 $ 174,172
2013 annual growth rate 7% $ 155,058 $ 165,912 $ 177,526 $ 189,953 $ 203,249 $ 217,477 $ 232,700 $ 248,989 $ 266,419 $ 285,068
Permit Revenue Increase of 10% $ 155,058 $ 170,564 $ 187,620 $ 206,382 $ 227,020 $ 249,722 $ 274,695 $ 302,164 $ 332,381 $ 365,619
Permit Revenue Increase of 13% $ 155,058 $ 175,216 $ 197,994 $ 223,733 $ 252,818 $ 285,684 $ 322,823 $ 364,790 $ 412,213 $ 465,801
Projected Revenues for Permit Sales Increases, minus coordinator expenses
2014 2015 2016 2017 2018 2019 2020 2021 2022 2023
Status Quo annual growth 1.3% $ 155,058 $ 157,074 $ 159,116 $ 161,184 $ 163,280 $ 165,402 $ 167,552 $ 169,731 $ 171,937 $ 174,172
2012 annual growth rate 1.3% $ 101,301 $ 107,837 $ 109,879 $ 111,947 $ 114,043 $ 116,165 $ 118,315 $ 120,494 $ 122,700 $ 124,935
Status Quo annual growth 7% $ 155,058 $ 165,912 $ 177,526 $ 189,953 $ 203,249 $ 217,477 $ 232,700 $ 248,989 $ 266,419 $ 285,068
2013 annual growth rate 7% $ 101,301 $ 116,675 $ 128,289 $ 140,716 $ 154,012 $ 168,240 $ 183,463 $ 199,752 $ 217,182 $ 235,831
Permit Revenue Increase of 10% $ 101,301 $ 121,327 $ 138,383 $ 157,145 $ 177,783 $ 200,485 $ 225,458 $ 252,927 $ 283,144 $ 316,382
Permit Revenue Increase of 13% $ 101,301 $ 125,979 $ 148,757 $ 174,496 $ 203,581 $ 236,447 $ 273,586 $ 315,553 $ 362,976 $ 416,564
Source: Millier Dickinson Blais: Note, for 2014 the employee cost is based on the most expensive pay scale plus the initial start-up costs, while in
subsequent years (i.e. 2015 onward) the amount is based on solely the most expensive pay-scale and annual costs. Status quo values in the bottom
table represent values if the proposed coordinator positions were not filled. Intersections between projected trends after expenses and status quo
growth represent points where a return on investment has occurred.
29 Millier Dickinson Blais: Eastern Ontario Trails Alliance Strategic Plan – Business PlanFIGURE 17: PROJECTED REVENUES AFTER NEW COORDINATOR DEDUCTIONS
Source: Millier Dickinson Blais. Note: Status quo values represent values if the proposed coordinator positions
were not filled. Intersections between projected trends after expenses and status quo growth represent points
where a return on investment has occurred.
30 Millier Dickinson Blais: Eastern Ontario Trails Alliance Strategic Plan – Business Plan4 Marketing Plan
The marketing and communications plan is an essential step forward for EOTA to increase visitation and community
ownership of the trail network. The marketing activities plan is aggressive, but targeted to three specific audiences that
are important to EOTA’s future success.
The activities will require at least a part-time and ideally a full-time marketing and communications coordinator. This can
be a main component of the proposed marketing and fundraising coordinator outlined in the previous chapter. It is
important to note the purpose of the position is not just to increase the familiarity of residents with the trails or to increase
visitation, it is also to communicate important information to the community about the health benefits of being active on
the trails, increase awareness of safety regulations, increase trail pass sales, and support the local business community
by attracting tourists to the area that will support the local economy.
The marketing plan first identifies the target markets that EOTA is best positioned to attract and then outlines the media
and activities that are the best ways to reach these audiences.
EOTA currently works with Engine Communications in regard to its online and promotional materials design and
administration. The two organizations have a strong relationship and a successful marketing campaign totalling $75,000
in 2013’s annual budget paid substantial dividends in terms of trails pass sales, which EOTA reports amounted to a
$155,058 for 2013, an all-time record. Despite the clear success, EOTA must now look to expanding its market presence
in other assertive ways, outlined in the following three target markets.
31 Millier Dickinson Blais: Eastern Ontario Trails Alliance Strategic Plan – Business Plan4.1 Target Markets
EOTA’s trails offer a destination tourism experience and a community amenity. A destination attraction is the primary
reason for a visit which is usually planned by the user well in advance. Ideally, a community amenity is used regularly by
residents and is usually familiar to the user. Marketing is most effective when targeted differently to these two audiences.
Figure 18 illustrates these audiences, which are described as weekend warriors and local residents, respectively. The
third category in the graphic is really an extension of local residents, but indicates a greater distance to travel.
EOTA has a number of excellent opportunities to develop new visitation markets. The following figure describes the
potential opportunities, ordered from left to right by increasing economic impact.
FIGURE 18: EOTA TARGET MARKETS
Local Residents Day Trippers Weekend Warriors
• Regular trail users • Travel 30-60 • Stay the weekend
minutes or more in local
to a trail head accommodations
Local Residents – are local residents looking for a new or familiar adventure. Some strategies that may increase the use
of local trails include encouraging regular outings organized by local clubs, increasing communications within EOTA
service area, and maintaining good signage and trail conditions to make the trails experience enjoyable, over and over
again.
Some of the activities that regional residents particularly enjoy include:
Hiking and ATV club outings
Learning about a new lookout or a new side trail that they haven’t yet explored
Social opportunities to get together with friends
Variety of activities that can be done alone or in small groups, like snowshoeing, skiing, ATV, hiking/walking, trail
running, dirt bikes
Day Trippers – are regional residents looking for a new adventure. Some strategies that may increase the use of local
trails include encouraging regular outings organized by user groups and community organizations, increasing
32 Millier Dickinson Blais: Eastern Ontario Trails Alliance Strategic Plan – Business PlanYou can also read