EARLY INDUCTION OF FUNCTIONAL SARS-COV-2-SPECIFIC T CELLS ASSOCIATES WITH RAPID VIRAL CLEARANCE AND MILD DISEASE IN COVID-19 PATIENTS
←
→
Page content transcription
If your browser does not render page correctly, please read the page content below
Report

Early induction of functional SARS-CoV-2-specific T
cells associates with rapid viral clearance and mild
disease in COVID-19 patients
Graphical Abstract                                                 Authors
                                                                   Anthony T. Tan, Martin Linster,
                                                                   Chee Wah Tan, ..., David Lye,
                                                                   Lin-Fa Wang, Antonio Bertoletti

                                                                   Correspondence
                                                                   antonio@duke-nus.edu.sg

                                                                   In Brief
                                                                   Tan et al. longitudinally analyzed the
                                                                   virological and immunological
                                                                   parameters in COVID-19 patients from
                                                                   disease onset until resolution or death.
                                                                   Early induction of functional SARS-CoV-
                                                                   2-specific T cells was observed in
                                                                   patients with mild disease and rapid viral
                                                                   clearance. This supports the prognostic
                                                                   value of detecting SARS-CoV-2-specific
                                                                   T cells.

Highlights
d   Longitudinal immunological analyses of COVID-19 from
    onset until outcome

d   Early induction of SARS-CoV-2-specific T cells is associated
    with mild COVID-19

d   Detection of functional SARS-CoV-2-specific T cells has
    prognostic value

           Tan et al., 2021, Cell Reports 34, 108728
           February 9, 2021 ª 2021 The Author(s).
           https://doi.org/10.1016/j.celrep.2021.108728                                              ll
Please cite this article in press as: Tan et al., Early induction of functional SARS-CoV-2-specific T cells associates with rapid viral clearance and mild
 disease in COVID-19 patients, Cell Reports (2021), https://doi.org/10.1016/j.celrep.2021.108728

                                                                                                                                              ll
                                                                                                                                         OPEN ACCESS

Report
Early induction of functional SARS-CoV-2-specific
T cells associates with rapid viral clearance
and mild disease in COVID-19 patients
Anthony T. Tan,1,8 Martin Linster,1,8 Chee Wah Tan,1 Nina Le Bert,1 Wan Ni Chia,1 Kamini Kunasegaran,1 Yan Zhuang,1
Christine Y.L. Tham,1 Adeline Chia,1 Gavin J.D. Smith,1 Barnaby Young,2,3,4 Shirin Kalimuddin,1,5 Jenny G.H. Low,1,5
David Lye,2,3,4,6 Lin-Fa Wang,1 and Antonio Bertoletti1,7,9,*
1Programme     in Emerging Infectious Diseases, Duke-National University of Singapore Medical School, Singapore, Singapore
2National Centre for Infectious Diseases, Singapore, Singapore
3Department of Infectious Diseases, Tan Tock Seng Hospital, Singapore, Singapore
4Lee Kong Cian School of Medicine, Singapore, Singapore
5Department of Infectious Diseases, Singapore General Hospital, Singapore, Singapore
6Yong Loo Lin School of Medicine, National University Singapore, Singapore, Singapore
7Singapore Immunology Network, A*STAR, Singapore, Singapore
8These authors contributed equally
9Lead contact

*Correspondence: antonio@duke-nus.edu.sg
 https://doi.org/10.1016/j.celrep.2021.108728

SUMMARY

Virus-specific humoral and cellular immunity act synergistically to protect the host from viral infection. We
interrogate the dynamic changes of virological and immunological parameters in 12 patients with symptom-
atic acute SARS-CoV-2 infection from disease onset to convalescence or death. We quantify SARS-CoV-2
viral RNA in the respiratory tract in parallel with antibodies and circulating T cells specific for various struc-
tural (nucleoprotein [NP], membrane [M], ORF3a, and spike) and non-structural (ORF7/8, NSP7, and NSP13)
proteins. Although rapid induction and quantity of humoral responses associate with an increase in disease
severity, early induction of interferon (IFN)-g-secreting SARS-CoV-2-specific T cells is present in patients
with mild disease and accelerated viral clearance. These findings provide support for the prognostic value
of early functional SARS-CoV-2-specific T cells with important implications in vaccine design and immune
monitoring.

INTRODUCTION                                                                   severity have also been reported. However, most of these
                                                                               studies have analyzed patients during the convalescent phase
In December 2019, a new coronavirus was detected in Wuhan,                     of infection, and only few studies have reported the dynamic
China, in several patients with pneumonia and was later named                  changes of viral and virus-specific immunological parameters
SARS-CoV-2 (Zhou et al., 2020a). The illness (coronavirus dis-                 in severe COVID-19 patients during the initial phases of infection
ease 2019 [COVID-19]) resulting from SARS-CoV-2 infection is                   (Weiskopf et al., 2020; Rydyznski Moderbacher et al., 2020; Zhou
reported to be multifaceted with inflammation of the respiratory               et al., 2020b). To fill this gap, we longitudinally followed-up 12 pa-
tract causing the leading symptoms of fever and dry cough                      tients (Table S1) with SARS-CoV-2 infection from symptom onset
(Chen et al., 2020). Both virus-specific humoral components                    to convalescence or death. We quantified SARS-CoV-2 viral load
(Long et al., 2020a; Gudbjartsson et al., 2020; Sun et al., 2020)              in the upper respiratory tract and SARS-CoV-2-specific anti-
and cellular components (Grifoni et al., 2020; Braun et al.,                   bodies and T cells at multiple time points from acute disease until
2020; Le Bert et al., 2020; Weiskopf et al., 2020) of adaptive                 convalescence or death. Our data reveal a direct association be-
immunity are induced in SARS-CoV-2-infected individuals, but                   tween early induction of functional SARS-CoV-2-specific T cells
their roles in viral control or disease pathogenesis need to be                and rapid control of viral infection.
clarified. Viral clearance and reduced disease severity have
been associated with coordinated activation of humoral and                     RESULTS
cellular anti-viral immunity (Rydyznski Moderbacher et al.,
2020) and robust virus-specific T cell responses (Takahashi                    Dynamics of SARS-CoV-2 replication
et al., 2020). A positive relationship between magnitude of                    Relative quantities of SARS-CoV-2 in the respiratory tract and its
SARS-CoV-2 antibodies (Hung et al., 2020; Long et al., 2020b;                  persistence in each patient were calculated by using the number
Wang et al., 2020) or T cells (Peng et al., 2020) and disease                  of RT-PCR cycles as a proxy of viral quantity (Figure 1). Duration of

                                                                      Cell Reports 34, 108728, February 9, 2021 ª 2021 The Author(s). 1
                       This is an open access article under the CC BY-NC-ND license (http://creativecommons.org/licenses/by-nc-nd/4.0/).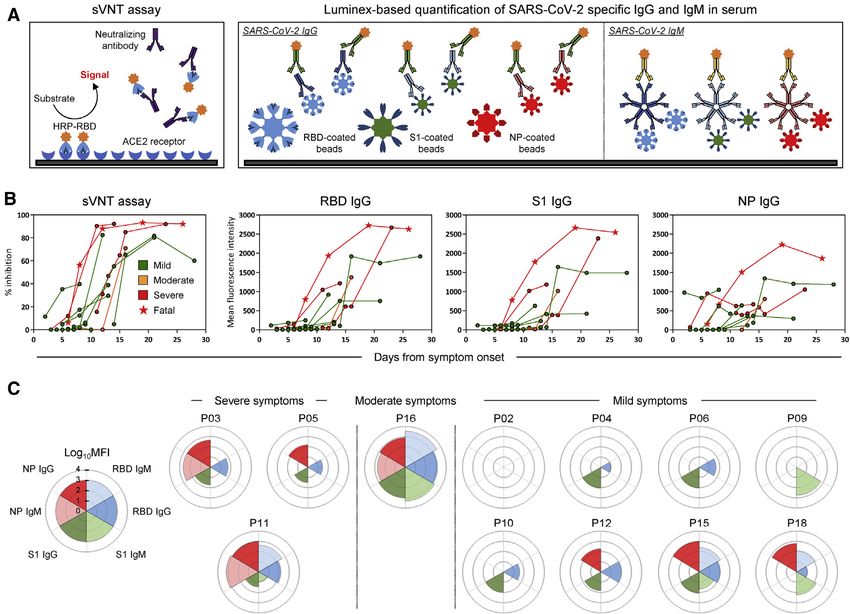
Please cite this article in press as: Tan et al., Early induction of functional SARS-CoV-2-specific T cells associates with rapid viral clearance and mild
 disease in COVID-19 patients, Cell Reports (2021), https://doi.org/10.1016/j.celrep.2021.108728

           ll
      OPEN ACCESS                                                                                                                            Report

Figure 1. Relative quantities of SARS-CoV-2 in the upper respiratory tract of symptomatic COVID-19 patients during acute infection
Longitudinal RT-PCR of SARS-CoV-2 RNA in the upper respiratory tract of COVID-19 patients (n = 12) with variable disease severity from symptom onset until
RT-PCR negativity. Dotted lines denote positive cutoffs. Inserts show correlations between the peak relative quantities of SARS-CoV-2 and the duration of
infection. The p value and the non-parametric Spearman correlation coefficient are indicated.

infection was defined from symptom onset until RT-PCR nega-                    bodies with a Luminex-based quantification test that use beads
tivity (two negative SARS-CoV-2 RT-PCR tests 24 h apart). The                  coated with RBD, S1, and NP proteins, respectively (Figure 2A).
patients displayed different profiles of virus quantity and persis-               Figure 2B shows that all COVID-19 patients developed
tence: short duration of infection was detected in four patients               neutralizing antibodies with the exception of patient P02, who
(P18, P04, P02, and P15) who became RT-PCR negative within                     nonetheless cleared SARS-CoV-2 at day 13 after symptom onset
15 days of symptom onset. Five patients (P11, P16, P06, P09,                   (Figure 1). The peak neutralizing activity was achieved within
and P03) were RT-PCR negative around day 17–24, whereas                        9–15 days after symptom onset. Patients with moderate/severe
two patients (P10 and P12) became RT-PCR negative almost                       symptoms exhibited stronger virus-specific antibody responses
1 month after onset of symptoms. One patient (P05) who suc-                    than those with mild disease (Figures S1B and S1C). The two
cumbed to infection was persistently SARS-CoV-2 RT-PCR pos-                    patients who first reached 90% virus neutralization developed
itive until day 31 after symptom onset, when he demised. Peak                  severe disease (patients P05, deceased, and P03, severe). The
viral quantities was also positively correlated with duration of               kinetics of anti-RBD, anti-S1, and anti-NP IgG also peaked around
infection (Figure 1, insert). In addition, although patients who elim-         the 10- to 20-day period, similar to previous observations (Isho
inated the virus within 15 days experienced mild respiratory symp-             et al., 2020; Ripperger et al., 2020), with higher peak levels of an-
toms (presence of fever or respiratory symptoms, but not requiring             tibodies against NP and Spike detected in patient P05, who suc-
supplemental oxygen), patients with moderate symptoms                          cumbed to the infection. When we analyzed in parallel the kinetics
(requiring oxygen supplementation of FiO2 < 0.5) and severe                    of appearance of antibody responses against different proteins,
symptoms (requiring oxygen supplementation of FiO2 > 0.5,                      we observed that patients with severe disease have an early
high-flow oxygen and/or mechanical ventilation) later eliminated               NP-biased antibody response, whereas those with mild/moderate
the virus from the upper respiratory tract. Viral loads detected in            symptoms had either a spike-dominant or a balanced response
patients with mild symptoms were also lower than those with                    (Figure 2C). These kinetics of appearance are consistent with
moderate/severe symptoms (Figure S1A).                                         recent data (Atyeo et al., 2020; Sun et al., 2020) showing that an
                                                                               anti-nucleocapsid humoral response is preferentially induced
                                                                               over a Spike IgG response in severe COVID-19 patients.
Dynamics of SARS-CoV-2-specific antibody response
We then characterized the kinetics of anti-SARS-CoV-2 antibody
appearance. Virus neutralization ability was tested longitudinally             Dynamics of SARS-CoV-2-specific cellular responses
using the surrogate virus neutralization test (sVNT) that quanti-              We next analyzed the kinetics of functional SARS-CoV-2-specific
fied the ability of serum antibodies to inhibit binding of Spike               T cell appearance during the RT-PCR-positive phase of disease.
RBD (receptor binding domain) to the ACE2 receptor in vitro                    Overlapping 15-mer peptide libraries (Table S2) covering the whole
(Tan et al., 2020). We also quantified anti-RBD, anti-S1 (S1                   NP, membrane (M), ORF7ab, ORF8, ORF3a, the NSP7 and NSP13
domain of spike), and anti-NP (nucleoprotein) immunoglobulin                   of ORF1ab, and a pool of 40 peptides containing all confirmed
G (IgG; Figure 2) and immunoglobulin M (IgM; Figure S2) anti-                  T cell epitopes of Spike were used to stimulate PBMC (peripheral

2 Cell Reports 34, 108728, February 9, 2021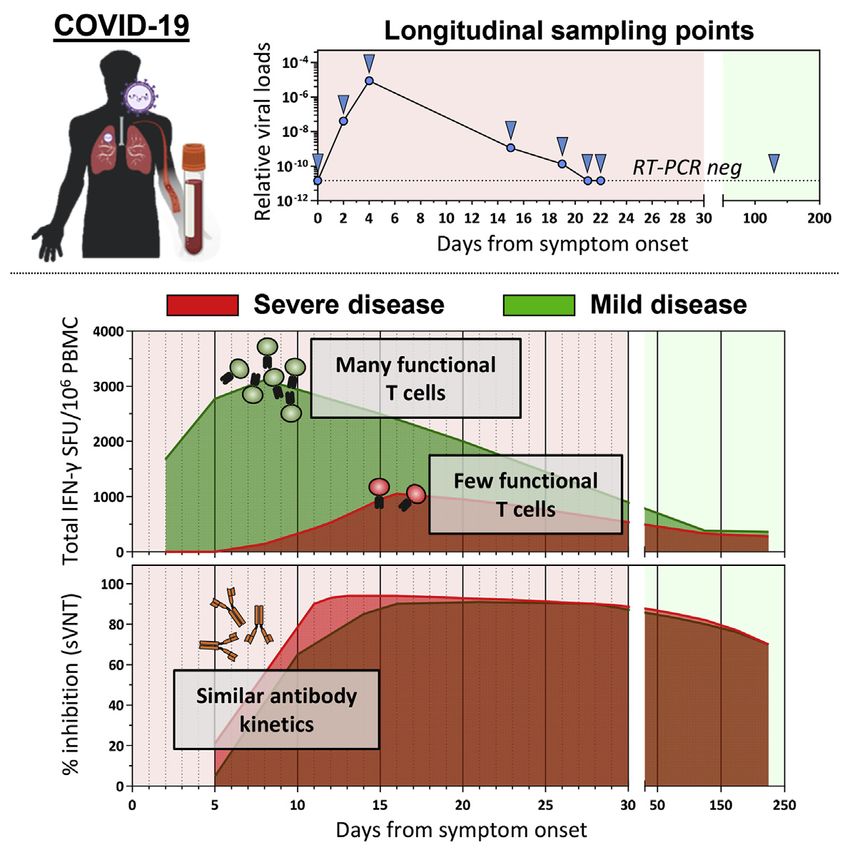
Please cite this article in press as: Tan et al., Early induction of functional SARS-CoV-2-specific T cells associates with rapid viral clearance and mild
disease in COVID-19 patients, Cell Reports (2021), https://doi.org/10.1016/j.celrep.2021.108728
ll
Report OPEN ACCESS
Figure 2. Longitudinal analysis of SARS-CoV-2-specific antibody-related responses in acute COVID-19 patients
(A) Schematic representation of the surrogate virus neutralization assay and the Luminex-based assay to quantify SARS-CoV-2 RBD-, S1-, and NP-specific IgG
and IgM antibodies. Cutoffs to define significant virus neutralization and antibody quantities were set at 20% inhibition for the sVNT assay (as defined in ref (Tan
et al., 2020)) and MFI (mean fluorescence intensity) > 100 for the Luminex-based assay, respectively.
(B) SARS-CoV-2 neutralization and relative quantities of specific IgG and antibodies (n = 12).
(C) Rose plots represent the quantity of RBD-, S1-, and NP-specific IgG and IgM antibodies at first detectable antibody response (n = 12). Patient P02 had no
detectable antibody response at 3, 4, 7, and 9 days after symptom onset for which samples were available.
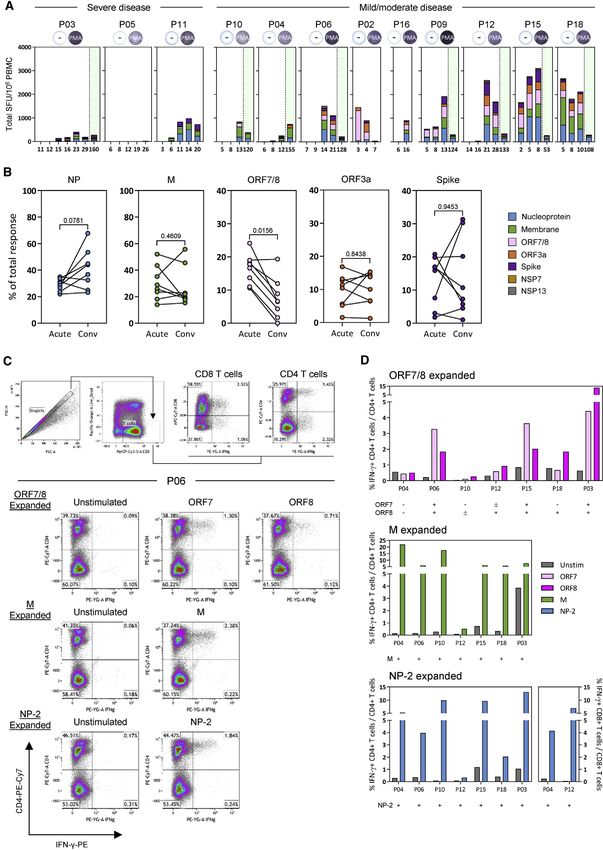
blood mononuclear cells) in an interferon (IFN)-g ELISPOT tent with waning of the cellular immune response that follows
(enzyme-linked immunospot) assay (Figure 3A). resolution of acute infection. The quantity and time of appear-
During the initial phase of SARS-CoV-2 infection, the quantity ance of SARS-CoV-2 peptide-reactive cells were then analyzed
of IFN-g-secreting cells after stimulation by the different peptide in relation to the virological and clinical parameters.
pools increased progressively with the peak of frequency de- First, we observed that in contrast to the antibody quantity, the
tected within 15 days after symptom onset in most tested pa- overall magnitude of SARS-CoV-2 peptide-reactive cells was not
tients (8 of 12, Figures 3B and 3C) in line with previous reports proportional to the severity of disease. Figure 2B shows that
(Weiskopf et al., 2020; Rydyznski Moderbacher et al., 2020). In although higher quantities of IgG were observed in patients
two patients, peak responses were detected beyond 20 days with moderate/severe compared with mild COVID-19, an oppo-
after symptom onset, whereas patient P05, who succumbed to site pattern was detected when the total IFN-g response de-
the disease before viral clearance, had no detectable IFN-g- tected after stimulation by all peptide pools was calculated.
secreting cells when stimulated with the different peptide pools Higher frequencies of IFN-g-secreting cells in both early stages
until day 26, when stimulation with Spike peptides activated a (day 1–15) and late stages (day 15–30) were present in mild,
weak response (Figure 3B). Importantly, production of IFN-g but not in moderate/severe, COVID-19 patients (Figures 3B
was detected at all time points in all patients after stimulation and 3C; Figure S1D). In addition, by analyzing the association
with PMA+ionomycin (phorbol myristate acetate), showing that between the time of SARS-CoV-2 T cell appearance and the
global cellular functionality was not fully compromised (Fig- length of infection, we observed a statistically significant direct
ure 4A, insert). The frequency of IFN-g-secreting cells reactive correlation between early appearance of SARS-CoV-2 peptide-
to all peptide pools was also quantified at least 1 month after res- reactive cells (specific for NP, ORF7/8, ORF3a, M, and Spike)
olution of infection. The magnitude of the IFN-g response and shorter duration of infection (Figure 3D). In contrast, no cor-
declined markedly in 7 of 8 patients tested (Figure 3B), consis- relation was observed when we analyzed the time of antibody
Cell Reports 34, 108728, February 9, 2021 3
Please cite this article in press as: Tan et al., Early induction of functional SARS-CoV-2-specific T cells associates with rapid viral clearance and mild
 disease in COVID-19 patients, Cell Reports (2021), https://doi.org/10.1016/j.celrep.2021.108728

            ll
      OPEN ACCESS                                                                                                                            Report

Figure 3. Longitudinal analysis of SARS-CoV-2 T responses in COVID-19 patients during acute infection and at convalescence
(A) SARS-CoV-2 proteome organization. Analyzed proteins are marked by an asterisk. 15-mer peptides, which overlapped by 10 amino acids, comprising the NP,
M, ORF7ab, ORF8, ORF3a, NSP7, and NSP13 were grouped into 10 pools with the indicated number of peptides in each pool. 15-mer predicted peptides
previously shown to activate Spike-specific CD8 and CD4 T cells were grouped into a single pool. PMA+ionomycin was used as a positive control for all samples
analyzed.
(B) Longitudinal analysis of the total SARS-CoV-2 T cell response in COVID-19 patients (n = 12) from onset of disease until convalescence. Individual lines
represent single patients.

                                                                                                                          (legend continued on next page)

4 Cell Reports 34, 108728, February 9, 2021
Please cite this article in press as: Tan et al., Early induction of functional SARS-CoV-2-specific T cells associates with rapid viral clearance and mild
disease in COVID-19 patients, Cell Reports (2021), https://doi.org/10.1016/j.celrep.2021.108728
ll
Report OPEN ACCESS
and the length of infection. The temporal association of func- DISCUSSION
tional SARS-CoV-2-specific T cell appearance with reduced
length of infection suggests that T cells play an essential role in Despite the small number of patients analyzed, our longitudinal
the control of SARS-CoV-2 infection. analysis of the dynamics of virological and virus-specific immu-
nological parameters during the acute phase of SARS-CoV-2
Hierarchy of T cell immunogenicity toward different infection revealed a positive relation between early detection
SARS-CoV-2 proteins of IFN-g-secreting SARS-CoV-2-specific T cells and early con-
Finally, we performed a granular analysis of the ability of different trol of infection. In addition, the quantity of functional virus-spe-
SARS-CoV-2 proteins to stimulate IFN-g production in severe cific T cells present during the acute phase of infection was not
and mild cases of SARS-CoV-2 infection. Peptide pools covering directly proportional to COVID-19 severity but was more robust
all structural proteins (M, NP, ORF3a, and Spike) and the ORF7/8 in patients with mild disease. These data contrasted with the
accessory proteins stimulate IFN-g production from the PBMCs recent analysis of SARS-CoV-2-specific T cells in COVID-19
of all the acute patients with the exception of patient P05 (Fig- convalescent patients that reported a positive association of
ure 4A). In line with our previous report, NSP7 and NSP13 pools the frequency of SARS-CoV-2-specific T cells with disease
were rarely able to trigger IFN-g responses in COVID-19 patients severity (Peng et al., 2020). However, in this work, the T cell
(Le Bert et al., 2020). In most acute patients, we observed the response was measured in patients who were already in the
simultaneous presence of IFN-g-producing cells specific for all convalescent phase. Because our longitudinal analysis showed
peptide pools both during the acute phase of infection and at that the frequency of SARS-CoV-2-specific T cells rapidly
convalescence (Figure 4A). We observed that the ORF7/8 pep- waned after SARS-CoV-2 clearance, the time of T cell analysis
tide pool triggered a robust IFN-g response preferentially in the can significantly influence the magnitude of T cell response de-
early phases of infection but only in patients with mild disease tected. The most robust functional T cell response was detected
(Figures 3B and 4A). When we calculated the proportion of in patients with mild symptoms who cleared the virus early,
IFN-g-producing cells triggered by different SARS-CoV-2 pro- whereas for example, in the patient with severe disease who
teins at the time of first detection and at convalescence succumbed to infection, we could only detect a weak and
(>30 days after viral clearance), we observed that ORF7/8 re- monospecific IFN-g-secreting cell response at 26 days after
sponses waned almost completely at convalescence. In symptom onset. These observations are in line with other
contrast, the proportion of cells stimulated by the peptide pools studies in which paucity of IFN-g-producing SARS-CoV-2-
covering other SARS-CoV-2 proteins remained unchanged (M, specific T cells was observed in few patients with severe disease
ORF3a, and Spike) or increased (NP) over time (Figure 4B). To analyzed during the early phase of disease (Weiskopf et al.,
demonstrate unequivocally that IFN-g-secreting cells detected 2020; Rydyznski Moderbacher et al., 2020; Zhou et al.,
in our assays after peptide stimulation were indeed T cells, we 2020b). This absence of IFN-g-producing SARS-CoV-2-specific
performed a flow cytometry phenotypic analysis of IFN-g-pro- T cells in the peripheral blood of patients with severe disease
ducing cells expanded after SARS-CoV-2 peptide stimulation could be caused by a defective induction of SARS-CoV-2
of PBMCs. Unfortunately, such characterizations were per- T cells. Alternatively, more robust sequestration of the cells in
formed only with PBMCs of SARS-CoV-2 patients at convales- the highly inflamed lung environment (Zhao et al., 2016) or func-
cence because of biosafety regulations that prevented us from tional impairment of SARS-CoV-2 T cells could occur (Zhou
analyzing PBMCs collected during active infection (RT-PCR et al., 2020b). The latter possibility is supported by data obtained
positive) outside a biosafety level 3 (BSL3) laboratory. As ex- with different methods (human leukocyte antigen [HLA] multi-
pected and already demonstrated, CD3+ T cells produced mers or single-cell multiomic analysis) showing impairment of
IFN-g after peptide pool stimulation (Figures 4C and 4D). Most IFN-g production by SARS-CoV-2-specific T cells in COVID-19
peptide-responsive T cells were CD4 cells, but CD8 T cells spe- recovered patients (Rha et al., 2020) and the presence of a pop-
cific to NP peptide pools were also detected (Figure 4D). We ulation of proliferating exhausted T cells during the early phases
were also able to expand ORF7- or ORF8-specific T cells in 6 of severe COVID-19 (Su et al., 2020a).
of 7 patients in whom we detected, in the early phases of infec- Additional studies would have to be performed to confirm and/
tion, a robust population of IFN-g-producing cells after activation or differentiate these potential causes of the defect of SARS-
with the combined ORF7/8 peptide pools. Phenotypic analysis CoV-2 T cells detected in more severe cases of COVID-19. Ulti-
showed that these cells were all CD4 T cells. Thus, even though mately, combining these data with our observations stresses the
we were unable to directly demonstrate that CD4 T cells were importance of an early and functional SARS-CoV-2-specific
responsible for the IFN-g response triggered by ORF7/8 pools T cell response in reducing infection and disease severity.
during the early phases of infection, such interpretation was The opposite scenario was observed for antibodies. The two
strongly supported by the exclusive expansion of ORF7- and most severe COVID-19 patients studied here showed the most
ORF8-specific CD4 T cells in convalescent patients. rapid and robust ability to achieve peak virus neutralization,
(C) Total SARS-CoV-2 T cell response detected in all COVID-19 patients (n = 12) during day 1–15, day 16–30, and >50 days after symptom onset. Patients with
mild symptoms (n = 8) or moderate/severe symptoms (n = 4) are indicated.
(D) Linear regression analysis of the duration of infection and the number of days to the first detectable T cell response (total and NP-, ORF7/8-, ORF3a-, M-, or
Spike-specific T cell response) or antibody-related response (sVNT and RBD-, S1-, or NP-specific IgG and IgM) are shown in the respective dotplots. The p values
and the corresponding r2 values are shown.
Cell Reports 34, 108728, February 9, 2021 5Please cite this article in press as: Tan et al., Early induction of functional SARS-CoV-2-specific T cells associates with rapid viral clearance and mild
disease in COVID-19 patients, Cell Reports (2021), https://doi.org/10.1016/j.celrep.2021.108728
ll
OPEN ACCESS Report
(legend on next page)
6 Cell Reports 34, 108728, February 9, 2021Please cite this article in press as: Tan et al., Early induction of functional SARS-CoV-2-specific T cells associates with rapid viral clearance and mild
disease in COVID-19 patients, Cell Reports (2021), https://doi.org/10.1016/j.celrep.2021.108728
ll
Report OPEN ACCESS
and the overall quantities of SARS-CoV-2-specific antibodies The association of early SARS-CoV-2-specific T cell detection
were higher in severe than in milder COVID-19 cases. These with accelerated SARS-CoV-2 clearance and milder symptoms
data confirm the numerous observations that have linked virus- is significant in our longitudinal analysis of 12 patients. Neverthe-
specific antibody production (Hung et al., 2020; Long et al., less, larger studies are needed to evaluate the potential influence
2020b; Ripperger et al., 2020; Wang et al., 2020) and B cell hy- of age, sex, and ethnicities in the obtained results and thus prove
peractivation (Woodruff et al., 2020) with increased disease that measurement of IFN-g-producing SARS-CoV-2-specific
severity. Because of the significant link between early induction T cells in the heterogeneous populations of infected individuals
of T cells and shorter duration of the infection, the demonstration might have prognostic value. Testing SARS-CoV-2 T cells
of the early induction of ORF7/8-specific cellular immunity can with a method that only measures IFN-g-producing cells pre-
be of particular significance in viral control. For example, a vents the possible detection of SARS-CoV-2 T cells producing
382-nucleotide deletion that truncates ORF7b and ORF8, lead- different cytokines (i.e., interleukin [IL]-21, tumor necrosis factor
ing to the elimination of ORF8 transcription, had been reported alpha [TNF-a], and IL-17) or functionally exhausted T cells, infor-
at low frequencies in multiple countries (Su et al., 2020b). mation that would be important to better understand the mech-
Although the mechanism leading to the acquisition of the anisms of COVID-19 severity and SARS-CoV-2 viral clearance.
genomic change is unresolved, the early induction of ORF7/ Similarly, the inability to perform a phenotypic analysis of
8-specific T cells and a recent report of the robust early antibody IFN-g-producing T cells does not clarify whether the preponder-
response to ORF8 in SARS-CoV-2 infection would suggest that ance of SARS-CoV-2 CD4 T cell response that we detected at
an immune-driven selection process could be involved (Hachim the convalescent phase with flow cytometry is absolute or oc-
et al., 2020). Given that this viral variant was associated with a curs only after the acute phase of disease. SARS-CoV-2 CD8
milder disease (Young et al., 2020), the early induction of T cells are known to be induced in COVID-19 patients (Grifoni
ORF7/8 immunity is worthy of further investigation. It remains et al., 2020; Schulien et al., 2021). It will be important to under-
difficult to explain why ORF7/8-specific T cells were preferen- stand whether the initial IFN-g-producing cells detected in the
tially detected during the acute phase of infection. Findings early phase of infections are preferentially constituted by CD4
show a corresponding increase in ORF8-specific antibodies dur- or CD8 T cells.
ing the early phases of SARS-CoV-2 infection (Hachim et al., Despite these limitations, the direct association of early induc-
2020). However, there is no experimental evidence of preferen- tion of IFN-g-producing SARS-CoV-2-specific T cells with faster
tial early expression of ORF7/8 proteins in SARS-CoV-2-infected viral clearance and milder disease observed here supports the
cells that might contribute to increased immunogenicity of these growing evidence of the protective role of T cells in SARS-
accessory proteins in the early phases of SARS-CoV-2 infection. CoV-2 infection and provides initial support for the prognostic
An alternative hypothesis is that pre-existing immunological value of SARS-CoV-2-specific T cell analysis in the management
memory to ORF7 or ORF8 might have caused selective acceler- of COVID-19 patients.
ated expansion of ORF7/8 T cells, because ORF7/8-specific
T cells can be detected occasionally in archived PBMC samples
collected from healthy individuals before 2019 (Mateus et al., STAR+METHODS
2020). However, ORF7/8 is only expressed by SARS-CoV-1
and SARS-CoV-2 with little homology to other seasonal corona- Detailed methods are provided in the online version of this paper
viruses. Hence, the role of such peptide cross-reactive cells is and include the following:
puzzling and calls for a more detailed analysis of the effect
d KEY RESOURCES TABLE
of pre-existing immunity in the control or pathogenesis of
d RESOURCE AVAILABILITY
SARS-CoV-2 infection and of the role of T cells specific for
B Lead contact
different antigens in SARS-CoV-2 protection.
B Materials availability
B Data and code availability
Limitations of study d EXPERIMENTAL MODEL AND SUBJECT DETAILS
There are two main limitations of this study: sample size and use d METHOD DETAILS
of a single functional assay (ELISPOT for IFN-g production) for B Peripheral blood mononuclear cell isolation
the detection of SARS-CoV-2 T cells during the PCR+ phase of B Surrogate virus neutralization assay
infection. B Luminex analysis
Figure 4. Hierarchy of cellular responses toward different SARS-CoV-2 proteins
(A) Stacked bars denotes the frequency of peptide-reactive cells in all COVID-19 patients (n = 12) against the indicated SARS-CoV-2 protein at all time points
tested. Green shaded areas denote the convalescence phase of the disease. Positive controls are inserted for each patient.
(B) Plots show the proportion of peptide-reactive cells attributed to the respective SARS-CoV-2 protein at the peak response during the acute phase and the
convalescence phase of the disease (n = 8). A Wilcoxon matched-pairs test was used to evaluate the differences, and the p values are shown. Short-term T cell
lines were also generated from the convalescent samples using the respective SARS-CoV-2 peptide pools. Each line was then stimulated with the corresponding
peptide pool used for expansion, and the frequency of IFN-g-producing T cells was quantified.
(C) Flow cytometry gating strategy is shown. Representative dotplots of ORF7/8-, M-, and NP-2-specific T cell lines generated from patient P06 are displayed.
(D) Frequencies of IFN-g-producing CD4 or CD8 T cells of all in vitro-expanded T cell lines generated from the convalescent PBMCs of respective COVID-19
patients (n = 7).
Cell Reports 34, 108728, February 9, 2021 7Please cite this article in press as: Tan et al., Early induction of functional SARS-CoV-2-specific T cells associates with rapid viral clearance and mild
disease in COVID-19 patients, Cell Reports (2021), https://doi.org/10.1016/j.celrep.2021.108728
ll
OPEN ACCESS Report
B IFN-g ELISPOT assay and ORF3b antibodies are accurate serological markers of early and late
B SARS-CoV-2 specific T cell lines SARS-CoV-2 infection. Nat. Immunol. 21, 1293–1301.
B Flow cytometry analysis Hung, I.F.-N., Cheng, V.C.-C., Li, X., Tam, A.R., Hung, D.L.-L., Chiu, K.H.-Y.,
d QUANTIFICATION AND STATISTICAL ANALYSIS Yip, C.C.-Y., Cai, J.-P., Ho, D.T.-Y., Wong, S.-C., et al. (2020). SARS-CoV-2
shedding and seroconversion among passengers quarantined after disem-
barking a cruise ship: a case series. Lancet Infect. Dis. 20, 1051–1060.
SUPPLEMENTAL INFORMATION
Isho, B., Abe, K.T., Zuo, M., Jamal, A.J., Rathod, B., Wang, J.H., Li, Z., Chao,
Supplemental Information can be found online at https://doi.org/10.1016/j. G., Rojas, O.L., Bang, Y.M., et al. (2020). Persistence of serum and saliva anti-
celrep.2021.108728. body responses to SARS-CoV-2 spike antigens in COVID-19 patients. Sci.
Immunol. 5, eabe5511.
ACKNOWLEDGMENTS Le Bert, N., Tan, A.T., Kunasegaran, K., Tham, C.Y.L., Hafezi, M., Chia, A.,
Chng, M.H.Y., Lin, M., Tan, N., Linster, M., et al. (2020). SARS-CoV-2-specific
We express our gratitude to the study participants and personnel involved in T cell immunity in cases of COVID-19 and SARS, and uninfected controls. Na-
ensuring the safety of the BSL3 laboratory operations. We also thank all clinical ture 584, 457–462.
and nursing staff who provided care for the patients and staff in the Singapore Long, Q.-X., Liu, B.-Z., Deng, H.-J., Wu, G.-C., Deng, K., Chen, Y.-K., Liao, P.,
Infectious Disease Clinical Research Network and Infectious Disease Qiu, J.-F., Lin, Y., Cai, X.-F., et al. (2020a). Antibody responses to SARS-CoV-2
Research and Training Office, National Centre for Infectious Diseases, for in patients with COVID-19. Nat. Med. 26, 845–848.
coordinating patient recruitment. This study is supported by the Singapore
Long, Q.-X., Tang, X.-J., Shi, Q.-L., Li, Q., Deng, H.-J., Yuan, J., Hu, J.-L., Xu,
Ministry of Health’s National Medical Research Council under its COVID-19
W., Zhang, Y., Lv, F.-J., et al. (2020b). Clinical and immunological assessment
Research Fund (COVID19RF3-0060).
of asymptomatic SARS-CoV-2 infections. Nat. Med. 26, 1200–1204.
AUTHOR CONTRIBUTIONS Mateus, J., Grifoni, A., Tarke, A., Sidney, J., Ramirez, S.I., Dan, J.M., Burger,
Z.C., Rawlings, S.A., Smith, D.M., Phillips, E., et al. (2020). Selective and
A.T.T., N.L.B., and A.B. designed the experiments. M.L., C.W.T., Y.Z., and cross-reactive SARS-CoV-2 T cell epitopes in unexposed humans. Science
G.J.D.S. performed the experiments in the BSL3 laboratory. W.N.C., C.W.T., 370, 89–94.
and L.-F.W. performed the antibody analysis. K.K., C.Y.L.T., and A.C. per- Peng, Y., Mentzer, A.J., Liu, G., Yao, X., Yin, Z., Dong, D., Dejnirattisai, W.,
formed all other experiments. A.T.T., M.L., N.L.B., and A.B. analyzed and inter- Rostron, T., Supasa, P., Liu, C., et al.; Oxford Immunology Network Covid-19
preted the data. A.T.T. and A.B. prepared the figures and wrote the paper. Response T cell Consortium; ISARIC4C Investigators (2020). Broad and strong
B.Y., S.K., J.G.H.L., and D.L. recruited patients and provided all clinical memory CD4+ and CD8+ T cells induced by SARS-CoV-2 in UK convalescent
data. A.B. designed and coordinated the study and provided funding. individuals following COVID-19. Nat. Immunol. 21, 1336–1345.
Rha, M.-S., Jeong, H.W., Ko, J.-H., Choi, S.J., Seo, I.-H., Lee, J.S., Sa, M.,
DECLARATION OF INTERESTS Kim, A.R., Joo, E.-J., Ahn, J.Y., et al. (2020). IFN-g is Produced by Pd-1 + Cells
Among SARS-CoV-2-Specific MHC-I Multimer+CD8 + T Cells in Acute and
A.B. is a cofounder of and A.T.T. consults for Lion TCR, a biotech company Convalescent COVID-19 Patients. Immunity, Published online September
developing T cell receptors for treatment of virus-related diseases and can- 15, 2020. https://doi.org/10.2139/ssrn.3684758.
cers. None of the other authors has any competing interest related to the Ripperger, T.J., Uhrlaub, J.L., Watanabe, M., Wong, R., Castaneda, Y.,
study. Pizzato, H.A., Thompson, M.R., Bradshaw, C., Weinkauf, C.C., Bime, C.,
et al. (2020). Orthogonal SARS-CoV-2 Serological Assays Enable Surveillance
Received: October 15, 2020 of Low-Prevalence Communities and Reveal Durable Humoral Immunity.
Revised: November 24, 2020 Immunity 53, 925–933.e4.
Accepted: January 15, 2021
Rydyznski Moderbacher, C., Ramirez, S.I., Dan, J.M., Grifoni, A., Hastie, K.M.,
Published: January 21, 2021
Weiskopf, D., Belanger, S., Abbott, R.K., Kim, C., Choi, J., et al. (2020).
Antigen-Specific Adaptive Immunity to SARS-CoV-2 in Acute COVID-19 and
REFERENCES
Associations with Age and Disease Severity. Cell 183, 996–1012.e19.
Atyeo, C., Fischinger, S., Zohar, T., Slein, M.D., Burke, J., Loos, C., McCulloch, Schulien, I., Kemming, J., Oberhardt, V., Wild, K., Seidel, L.M., Killmer, S., Sa-
D.J., Newman, K.L., Wolf, C., Yu, J., et al. (2020). Distinct Early Serological Sig- gar, Daul, F., Salvat Lago, M., Decker, A., et al. (2021). Characterization of pre-
natures Track with SARS-CoV-2 Survival. Immunity 53, 524–532.e4. existing and induced SARS-CoV-2-specific CD8+ T cells. Nat. Med. 27, 78–85.
Braun, J., Loyal, L., Frentsch, M., Wendisch, D., Georg, P., Kurth, F., Hippen- Su, Y., Chen, D., Lausted, C., Yuan, D., Choi, J., Dai, C., Voillet, V., Scherler, K.,
stiel, S., Dingeldey, M., Kruse, B., Fauchere, F., et al. (2020). SARS-CoV-2- Troisch, P., Duvvuri, V.R., et al. (2020a). Multiomic Immunophenotyping of
reactive T cells in healthy donors and patients with COVID-19. Nature 587, COVID-19 Patients Reveals Early Infection Trajectories. bioRxiv. https://doi.
270–274. org/10.1101/2020.07.27.224063.
Chen, G., Wu, D., Guo, W., Cao, Y., Huang, D., Wang, H., Wang, T., Zhang, X., Su, Y.C.F., Anderson, D.E., Young, B.E., Linster, M., Zhu, F., Jayakumar, J.,
Chen, H., Yu, H., et al. (2020). Clinical and immunological features of severe Zhuang, Y., Kalimuddin, S., Low, J.G.H., Tan, C.W., et al. (2020b). Discovery
and moderate coronavirus disease 2019. J. Clin. Invest. 130, 2620–2629. and Genomic Characterization of a 382-Nucleotide Deletion in ORF7b and
Grifoni, A., Weiskopf, D., Ramirez, S.I., Mateus, J., Dan, J.M., Moderbacher, ORF8 during the Early Evolution of SARS-CoV-2. MBio 11, e01610–e01620.
C.R., Rawlings, S.A., Sutherland, A., Premkumar, L., Jadi, R.S., et al. (2020). Sun, B., Feng, Y., Mo, X., Zheng, P., Wang, Q., Li, P., Peng, P., Liu, X., Chen, Z.,
Targets of T Cell Responses to SARS-CoV-2 Coronavirus in Humans with Huang, H., et al. (2020). Kinetics of SARS-CoV-2 specific IgM and IgG re-
COVID-19 Disease and Unexposed Individuals. Cell 181, 1489–1501.e15. sponses in COVID-19 patients. Emerg. Microbes Infect. 9, 940–948.
Gudbjartsson, D.F., Norddahl, G.L., Melsted, P., Gunnarsdottir, K., Holm, H., Takahashi, T., Ellingson, M.K., Wong, P., Israelow, B., Lucas, C., Klein, J.,
Eythorsson, E., Arnthorsson, A.O., Helgason, D., Bjarnadottir, K., Ingvarsson, Silva, J., Mao, T., Oh, J.E., Tokuyama, M., et al.; Yale IMPACT Research
R.F., et al. (2020). Humoral Immune Response to SARS-CoV-2 in Iceland. Team (2020). Sex differences in immune responses that underlie COVID-19
N. Engl. J. Med. 383, 1724–1734. disease outcomes. Nature 588, 315–320.
Hachim, A., Kavian, N., Cohen, C.A., Chin, A.W.H., Chu, D.K.W., Mok, C.K.P., Tan, C.W., Chia, W.N., Qin, X., Liu, P., Chen, M.I.-C., Tiu, C., Hu, Z., Chen,
Tsang, O.T.Y., Yeung, Y.C., Perera, R.A.P.M., Poon, L.L.M., et al. (2020). ORF8 V.C.-W., Young, B.E., Sia, W.R., et al. (2020). A SARS-CoV-2 surrogate virus
8 Cell Reports 34, 108728, February 9, 2021Please cite this article in press as: Tan et al., Early induction of functional SARS-CoV-2-specific T cells associates with rapid viral clearance and mild
disease in COVID-19 patients, Cell Reports (2021), https://doi.org/10.1016/j.celrep.2021.108728
ll
Report OPEN ACCESS
neutralization test based on antibody-mediated blockage of ACE2-spike pro- Young, B.E., Fong, S.-W., Chan, Y.-H., Mak, T.M., Ang, L.W., Anderson, D.E.,
tein-protein interaction. Nat. Biotechnol. 38, 1073–1078. Lee, C.Y.-P., Amrun, S.N., Lee, B., Goh, Y.S., et al. (2020). Effects of a major
Wang, Y., Zhang, L., Sang, L., Ye, F., Ruan, S., Zhong, B., Song, T., Alshukairi, deletion in the SARS-CoV-2 genome on the severity of infection and the inflam-
A.N., Chen, R., Zhang, Z., et al. (2020). Kinetics of viral load and antibody matory response: an observational cohort study. Lancet 396, 603–611.
response in relation to COVID-19 severity. J. Clin. Invest. 130, 5235–5244. Zhao, J., Zhao, J., Mangalam, A.K., Channappanavar, R., Fett, C., Meyerholz,
Weiskopf, D., Schmitz, K.S., Raadsen, M.P., Grifoni, A., Okba, N.M.A., Ende- D.K., Agnihothram, S., Baric, R.S., David, C.S., and Perlman, S. (2016). Airway
man, H., van den Akker, J.P.C., Molenkamp, R., Koopmans, M.P.G., van Gorp, Memory CD4(+) T Cells Mediate Protective Immunity against Emerging Respi-
E.C.M., et al. (2020). Phenotype and kinetics of SARS-CoV-2-specific T cells in ratory Coronaviruses. Immunity 44, 1379–1391.
COVID-19 patients with acute respiratory distress syndrome. Sci. Immunol. 5, Zhou, P., Yang, X.-L., Wang, X.-G., Hu, B., Zhang, L., Zhang, W., Si, H.-R., Zhu,
eabd2071. Y., Li, B., Huang, C.-L., et al. (2020a). A pneumonia outbreak associated with a
Woodruff, M.C., Ramonell, R.P., Nguyen, D.C., Cashman, K.S., Saini, A.S., new coronavirus of probable bat origin. Nature 579, 270–273.
Haddad, N.S., Ley, A.M., Kyu, S., Howell, J.C., Ozturk, T., et al. (2020). Extra- Zhou, R., To, K.K.-W., Wong, Y.C., Liu, L., Zhou, B., Li, X., Huang, H., Mo, Y.,
follicular B cell responses correlate with neutralizing antibodies and morbidity Luk, T.-Y., Lau, T.T.-K., et al. (2020b). Acute SARS-CoV-2 Infection Impairs
in COVID-19. Nat. Immunol. 21, 1506–1516. Dendritic Cell and T Cell Responses. Immunity 53, 864–877.e5.
Cell Reports 34, 108728, February 9, 2021 9Please cite this article in press as: Tan et al., Early induction of functional SARS-CoV-2-specific T cells associates with rapid viral clearance and mild
disease in COVID-19 patients, Cell Reports (2021), https://doi.org/10.1016/j.celrep.2021.108728
ll
OPEN ACCESS Report
STAR+METHODS
KEY RESOURCES TABLE
REAGENT or RESOURCE SOURCE IDENTIFIER
Antibodies
anti-human IFN-g coating antibody Mabtech Cat# 3420-3-1000; RRID:AB_907282
anti-human IFN-g biotin Mabtech Cat# 3420-6-1000; RRID:AB_907272
anti-human CD3 PerCp Cy5.5 BD Biosciences Cat# 340949; RRID:AB_400190
anti-human CD4 PE-Cy7 BD Biosciences Cat# 557852; RRID:AB_396897
anti-human CD8 APC-Cy7 BD Biosciences Cat# 557834; RRID:AB_396892
anti-human IFN-g PE R&D Systems Cat# IC285P; RRID:AB_357309
Goat anti-human IgG PE eBioscience Cat# 12-4998-82; RRID: AB_465926
Goat anti-human IgM PE SouthernBiotech Cat# 2020-09; RRID; AB_2795606
Biological samples
Peripheral blood mononuclear cells from Recruited as part of the PROTECT and N/A
COVID-19 patients Novel Pathogens studies in Singapore
Chemicals, peptides, and recombinant proteins
Streptavidin-ALP Mabtech Cat# 3310-10-1000
KPL BCIP/NBT phosphotase substrate SeraCare Cat# 5420-0038
Recombinant human IL-2 R&D Systems Cat# 202-1L-050
Yellow LIVE/DEAD fixable dead cell stain Invitrogen Cat# L34959
15-mer SARS-CoV-2 overlapping peptides GL Biochem (Shanghai) Amino acid sequences found in Table S2
BD Cytofix/Cytoperm Fixation BD Biosciences Cat# 51-2090 KZ
HRP-conjugated SARS-CoV-2 RBD Genscript Custom synthesis
Human ACE2 Fc chimera Genscript Cat# Z03484
SARS-CoV-2 RBD protein Genscript Cat# Z03479
SARS-CoV-2 S1 protein Genscript Cat# Z03485
SARS-CoV-2 N protein Genscript Cat# Z03480
Critical commercial assays
xMap antibody coupling kit Luminex Cat# 40-50016
MagPlex microspheres Luminex Cat# MC10072-01
Software and algorithms
GraphPad Prism 7 GraphPad https://www.graphpad.com/scientific-
software/prism
Kaluza software Beckman Coulter https://www.beckman.com/flow-cytometry/
software/kaluza
Immunospot Software Cellular Technology Limited http://www.immunospot.com/ImmunoSpot-
analyzers-software
RESOURCE AVAILABILITY
Lead contact
Further information and requests for resources and reagents should be directed to and will be fulfilled by the Lead Contact, Antonio
Bertoletti (antonio@duke-nus.edu.sg).
Materials availability
This study did not generate new unique reagents.
e1 Cell Reports 34, 108728, February 9, 2021Please cite this article in press as: Tan et al., Early induction of functional SARS-CoV-2-specific T cells associates with rapid viral clearance and mild
disease in COVID-19 patients, Cell Reports (2021), https://doi.org/10.1016/j.celrep.2021.108728
ll
Report OPEN ACCESS
Data and code availability
The published article includes all datasets generated or analyzed during this study. This study did not generate/analyze computer
codes or algorithms.
EXPERIMENTAL MODEL AND SUBJECT DETAILS
Patients (n = 12) were enrolled in this study after being admitted to the hospital in Singapore and confirmed to be infected with SARS-
CoV-2 based on a positive SARS-CoV-2 RT-PCR test as part of the PROTECT (National Healthcare Group Domain Specific Review
Board reference number 2012/00917) and Novel Pathogens (CIRB ref. 2018/3045) studies. All participants provided written informed
consent. None of the patients received immunomodulatory treatments during the study period. Six patients were male, six were
female, their median age at time of admission was 52.5 years, ranging from 27 to 78 years. Additional patient information are found
in Table S1.
METHOD DETAILS
Peripheral blood mononuclear cell isolation
Peripheral blood of acutely infected patients was collected in Mononuclear Cell Preparation tubes (CPT, BD Vacutainer) and trans-
ferred at 4 C to the biosafety level-3 (BSL3) facility for same-day processing. Blood from study participants at convalescent time
points was obtained and processed in BSL2 laboratories. Peripheral blood mononuclear cells from all collected blood samples
were isolated by Ficoll-Paque density gradient centrifugation.
Surrogate virus neutralization assay
sVNT assay to quantify the neutralizing antibody response were performed as previously described (Tan et al., 2020). Briefly, sera
from acutely infected patients were prepared in BSL3 containment and heat-inactivated prior to sVNT assay. HRP-conjugated
RBD (Genscript) were pre-incubated with 1:20 diluted serum at 37 C for 1h, followed by addition to the Fc-chimeric human
ACE2-coated MaxiSORP ELISA plate (Nunc) for an hour at room temperature. Colorimetric signal was developed using TMB
substrate (KPL) after extensive PBST washes and the reaction was stopped with 1M HCl. Absorbance reading at 450 nm and
570 nm were obtained using Hidex Sense microplate reader (Hidex).
Luminex analysis
SARS-CoV-2 RBD, S1 and N proteins (Genscript) were conjugated onto MagPlex microsphere (Luminex) using xMAP antibody
coupling kit (Luminex). SARS-CoV-2 spike and N proteins specific antibodies were detected by pre-incubation of 100-fold diluted
serum (in 1% BSA PBS) with conjugated microspheres (1250 beads/antigen) for 1h at room temperature, followed by 1:1000 diluted
PE-conjugated anti-human IgG polyclonal antibody (eBioscience) or PE-conjugated anti-human IgM antibody (SouthernBiotech) for
1h at room temperature. The signal was detected using Luminex MAGPIX instrument.
IFN-g ELISPOT assay
15-mer peptides that spanned the entire ORF of genes eight SARS-CoV-2 proteins (NP, M, ORF7, ORF8, ORF3, S, NSP7, NSP13)
and antibody responses to two SARS-CoV-2 proteins (NP, S) were synthesized (GL Biochem, Shanghai, China) with 10 amino acids
overlap and were grouped into pools of approximately 40 peptides (Table S2). CPT tubes were centrifuged at 1500 rcf. for 15 mins
and approximately 2 mL of mononuclear cells located on top of the polyester gel were aliquoted and stored at 80 C. ELISPOT
plates were prepared with anti-human IFN-g coating antibody (MabTech) and peptides pools in 50 mL AIM-V medium (GIBCO;
Thermo Fisher Scientific) supplemented with 2% AB human serum (GIBCO; Thermo Fisher Scientific) on the day of incubation
with PBMCs. Vials containing PBMCs were thawed at RT, 2U Benzonase (SigmaAldrich) to remove remaining nucleic acids was
added when fully thawed and incubated for 15 mins before centrifugation at 1000 rcf. for 10 mins. The cell pellet was dissolved in
1 mL of AIM-V medium (GIBCO; Thermo Fisher Scientific) supplemented with 2% AB human serum (GIBCO; Thermo Fisher Scien-
tific) before quantification at undiluted and 1:10 dilution using a Scepter 2.0 cell counter (Millipore). Approximately 2 3 105 PBMCs in
100 mL per well were incubated in the presence of peptides overnight at 37 C and 5% CO2. After 24 hours, inoculum was removed
and plates were washed six times with PBS. Biotinylated anti-human IFN-g antibody (MabTech) at a 1:2000 dilution in PBS/0.5% FCS
was incubated at RT for two hours, followed by six wash steps with PBS and incubation of Streptavidin-ALP (MabTech) at a 1:2000
dilution in PBS/0.5% FCS at RT for one hour. After another six PBS washes, 50 mL of KPL BCIP/NBT phosphatase substrate
(SeraCare) was added and incubated at RT in the dark for 5-15 mins. The reaction was stopped by washing the plate with water
extensively when the chromogenic reaction produced clearly visible spots. Subsequently, the plates were allowed to air-dry and
spot forming units (SFU) were analyzed using an Immunospot reader and software (Cellular Technology Limited).
SARS-CoV-2 specific T cell lines
T cell lines were generated as follows: 20% of PBMC were pulsed with 10 mg/ml of the overlapping SARS-CoV-2 peptides (all pools
combined) or single peptides for 1 hour at 37 C, subsequently washed, and co-cultured with the remaining cells in AIM-V medium
Cell Reports 34, 108728, February 9, 2021 e2Please cite this article in press as: Tan et al., Early induction of functional SARS-CoV-2-specific T cells associates with rapid viral clearance and mild
disease in COVID-19 patients, Cell Reports (2021), https://doi.org/10.1016/j.celrep.2021.108728
ll
OPEN ACCESS Report
(GIBCO; Thermo Fisher Scientific) supplemented with 2% AB human serum (GIBCO; Thermo Fisher Scientific). T cell lines were
cultured for 10 days in the presence of 20 U/ml of recombinant IL-2 (R&D Systems).
Flow cytometry analysis
Expanded T cell lines were stimulated for 5h at 37 C with or without SARS-CoV-2 peptide pools (2 mg/ml) in the presence of 10 mg/ml
brefeldin A (Sigma-Aldrich). Cells were stained with the yellow LIVE/DEAD fixable dead cell stain kit (Invitrogen) and anti-human CD3
PerCp Cy5.5 (clone SK7; 3:50), anti-human CD4 PE-Cy7 (clone SK3; 3:50), and anti-human CD8 APC-Cy7 (clone SK1; 3:50) anti-
bodies. Cells were subsequently fixed and permeabilized using the Cytofix/Cytoperm kit (BD Biosciences-PharMingen) and stained
with anti-human IFN-g PE (clone 25723, R&D Systems; 1:25) and analyzed on a BD-LSR II FACS Scan. Data were analyzed by Kaluza
(Beckman Coulter). Antibodies were purchased from BD Biosciences-PharMingen unless otherwise stated.
QUANTIFICATION AND STATISTICAL ANALYSIS
All statistical analysis were performed using GraphPad Prism v7. Where applicable, the statistical tests used and the definition of
center were indicated in the figure legends. Statistical significance was defined as having a P value of less than 0.05. In all instances,
‘‘n’’ refers to the number of patients analyzed.
e3 Cell Reports 34, 108728, February 9, 2021You can also read


