Dynamics of intracellular stress-induced tRNA trafficking
←
→
Page content transcription
If your browser does not render page correctly, please read the page content below
2002–2010 Nucleic Acids Research, 2019, Vol. 47, No. 4                                                        Published online 28 November 2018
doi: 10.1093/nar/gky1208

Dynamics of intracellular stress-induced tRNA
trafficking
Rabin Dhakal1 , Chunyi Tong1 , Sean Anderson1 , Anna S. Kashina2 , Barry Cooperman3 and
Haim H. Bau 1,*
1
 Department of Mechanical Engineering and Applied mechanics, University of Pennsylvania, Philadelphia, PA 19104,
USA, 2 Department of Biomedical Sciences, School of Veterinary Medicine, University of Pennsylvania, Philadelphia,
PA 19104, USA and 3 Department of Chemistry, University of Pennsylvania, Philadelphia, PA 19014, USA

Received July 11, 2018; Revised November 09, 2018; Editorial Decision November 16, 2018; Accepted November 20, 2018

ABSTRACT                                                                        a reversible process having important roles in cell biology
                                                                                (3). This phenomenon has been most extensively studied
Stress is known to induce retrograde tRNA translo-                              in Saccharomyces cerevisiae (2,4–7). In addition to conven-
cation from the cytoplasm to the nucleus but translo-                           tional splicing in the nucleus, followed by aminoacylation
cation kinetics and tRNA-spatial distribution have                              and translation in the cytoplasm, tRNAs also undergo some
not been characterized previously. We microinject                               splicing in the cytoplasm (8), posttranscriptional modifi-
fluorescently-labeled tRNA into living cells and use                            cation in both the nucleus and the cytoplasm (4), and mi-
confocal microscopy to image tRNA spatial distri-                               nor aminoacylation in the nucleus (9), where retrotranslo-
bution in single cells at various levels of starvation                          cation functions as a quality control mechanism to repair
and to determine translocation rate constants. Ret-                             or degrade aberrant tRNA (4,6,7,10). Retro-translocation
rograde tRNA translocation occurs reversibly, within                            of tRNA from the cytosol into the nucleus has been demon-
minutes after nutrition depletion of the extracellular                          strated under stress conditions such as nutrient deprivation
                                                                                (2,6,7,10–15) and heat treatment (12,13) in both S. cere-
medium. Such nutritional starvation leads to down-
                                                                                visiae and mammalian cells (3). tRNA nuclear import has
regulation of tRNA nuclear import and nearly com-                               also been implicated in assisting viral (e.g. HIV-1) transport
plete curtailment of its nuclear export. Nuclear tRNA                           (16,17). Translation in the nucleus has also been suggested
accumulation is suppressed in cells treated with the                            (18), but this suggestion remains controversial (19).
translation inhibitor puromycin, but is enhanced in                                Defects in and deregulation of tRNA expression are
cells treated with the microtubule inhibitor nocoda-                            linked to a number of diseases and disorders, including can-
zole. tRNA in the cytoplasm exhibits distinct spatial                           cer and neuro-degeneration (20,21). Cancer cells exhibit el-
distribution inconsistent with diffusion, implying that                         evated tRNA levels (20), and tRNA binding to cytochrome
such distribution is actively maintained. We propose                            C (22–25), resulting in tRNA-mediated inhibition of cy-
that tRNA biological complexes and/or cytoplasmic                               tochrome C in mitochondria, is implicated in the shift of
electric fields are the likely regulators of cytoplasmic                        cancer cells to anaerobic respiration (26,27).
                                                                                   Despite its emerging role in multiple biological processes,
tRNA spatial distribution.
                                                                                little is known about the subcellular distribution of different
                                                                                tRNA pools and its dynamics under physiological changes,
INTRODUCTION                                                                    e.g., during stress response. A better understanding of
                                                                                tRNA nuclear/cytoplasmic trafficking mechanisms will aid
Transfer ribonucleic acid (tRNA) is a 76–93 nucleotide-                         in elucidating how cells regulate tRNA subcellular distri-
long adaptor molecule that links a given amino acid to a                        bution, what factors affect tRNA trafficking, how tRNA
specific messenger RNA (mRNA) codon and transfers this                          trafficking differs between healthy and diseased/cancerous
amino acid to a nascent polypeptide chain at the ribosomal                      cells, and how viruses such as HIV take advantage of tRNA
site of protein synthesis (1). Until recently, it was believed                  trafficking mechanisms to enter the nucleus.
that mature tRNA molecules, following their transcription                          Prior studies of tRNA trafficking have mostly relied on
in the nucleus, are exported to the cytoplasm to undergo                        fluorescent in-situ hybridization (FISH) (28) that provides
aminoacylation and participate in translation (2). Only re-                     static snapshots of tRNA distribution in fixed cells, but
cently has it been recognized that mature tRNA under-                           no real-time information on tRNA dynamics. Barhoom
goes retrotranslocation from the cytosol into the nucleus,

* To   whom correspondence should be addressed. Tel: +1 215 898 8363; Email: bau@seas.upenn.edu
Present address: Chunyi Tong, College of Biology, Hunan University, Changsha 410082, P.R. China.


C The Author(s) 2018. Published by Oxford University Press on behalf of Nucleic Acids Research.
This is an Open Access article distributed under the terms of the Creative Commons Attribution License (http://creativecommons.org/licenses/by/4.0/), which
permits unrestricted reuse, distribution, and reproduction in any medium, provided the original work is properly cited.
Nucleic Acids Research, 2019, Vol. 47, No. 4 2003
et al. (29,30) previously have demonstrated that rhodamine were injected with 25 M FAM-80-DNA in place of rhd-
labeled tRNA (rhd-tRNA) can be aminoacylated within tRNA. Cell cultures were maintained in a stage incubator
cells and participate in protein synthesis. Here, we microin- (LCI Chamlide) at 37◦ C and 5% CO2 .
ject rhd-tRNA into cultured mouse embryonic fibroblasts
(MEFs) and image intracellular tRNA dynamics in live
cells. Imaging
Our results demonstrate that, during nutrient depriva- Spinning disk confocal images were collected at the cell’s
tion, tRNA rapidly retro-translocates from the cytoplasm bottom, mid-height, and top (Figure 1A) and digitized with
into the nucleus. In agreement with earlier studies (11), Matlab™ by extracting the intensity of the green color.
this transport is both actively regulated and reversible. To estimate reaction rate constants, cytoplasmic intensity
Since all the rhd-tRNA originates in the cytoplasm, no nu- was determined by averaging emission intensity from the
clear tRNA synthesis is required to support the reversible indicated 5 pixel × 5 pixel rectangular regions next to
tRNA retrotranslocation that we observe. Retrograde nu- the nuclear membrane (Figure 1B) and from the spatially-
clear tRNA accumulation is suppressed in cells treated with averaged cytoplasmic intensity.
the translation inhibitor puromycin and is enhanced in cells
treated with the microtubule inhibitor nocodazole. Strik-
ingly, tRNA exhibits a distinct, non-linear distribution in RESULTS
the cytoplasm that is inconsistent with molecular diffusion.
tRNA retrograde translocation under starvation conditions
Higher tRNA concentration is maintained in the vicinity of
the nuclear envelope, possibly at the main sites of protein To detect changes in intracellular tRNA distribution in re-
synthesis. We formulate a simple lumped parameter model sponse to stress, we subjected MEFs to varying degrees
to estimate the rate constants for tRNA nuclear import of nutritional stress (0–100% normal media in PBS) for 2
and export as functions of stress level, and examine various h prior to injecting bulk rhodamine-labeled tRNA (rhd-
causative mechanisms for the unexpected tRNA concentra- tRNA) into the cytoplasm, and then imaged rhd-tRNA flu-
tion distribution in the cytoplasm. Our work constitutes the orescence emission in these cells for 1 h following injection
first quantitative analysis of tRNA dynamics in a eukaryotic with a confocal microscope (Figure 1). In all cases (Fig-
cell. ures 2–5), rhd-tRNA rapidly (within a minute) accumulated
around the nuclear membrane to form a ring of fluores-
MATERIALS AND METHODS cence, while the nucleus remained relatively dark. As time
progressed, nuclear rhd-tRNA concentration increased and
Fluorescently labeled tRNA
the width of the perinuclear ring decreased (Figure 4A),
Rhodamine-labeled bulk tRNA (bulk rhd-tRNA) was pre- until nuclear rhd-tRNA concentration attained an asymp-
pared as previously described (29). totic, steady-state value (Figure 5). Interestingly, within our
spatial resolution and irrespective of nutritional stress level,
Cell culture fluorescence emission intensity was nearly uniform inside
the nucleus, but varied spatially within the cytoplasm, de-
Spontaneously immortalized Mouse Embryonic Fibrob-
creasing with increasing radial distance from the nucleus
lasts (MEF) were cultured in 44.5% DMEM (HyClone),
(Figure 4). These observations were carried out within a
44.5% F10 nutrient mix, 10% fetal bovine serum (HyClone),
thin confocal slice and thus were not affected by the vari-
and 1% Penicillin/Streptomycin mix on glass-bottom cell
ation in the cytoplasm thickness between the perinuclear
culture dishes (MatTek Corp.) and kept in a Fisher Isotemp
region and the cell periphery (SI–S2). Similar to the exper-
incubator at 37◦ C and 5% CO2 . For nutritional stress, cul-
iments carried out by Plochowietz et al. (31), wherein la-
ture media was mixed with PBS at various proportions. Pure
beled tRNA was introduced into bacterial cells, most of the
PBS solution corresponded to complete nutritional starva-
rhd-tRNA molecules appeared to move freely. A few ag-
tion (0% nutrition).
gregates of rhd-tRNA, were, however, visible. These may
correspond to receptor-bound tRNAs and/or to tRNA
Microinjection
liposomes/granules recently reported in neurons (32). The
Bulk rhd-tRNA was dissolved in molecular grade wa- extent of rhd-tRNA nuclear accumulation increased as nu-
ter and back loaded into filamented, pulled quartz mi- tritional stress increased (Figure 5).
cropipettes (S9). The rhd-tRNA solution was ∼25 M, en- We estimated the rate constants for tRNA entry into (kin ,
abling prolonged observations while maintaining linearity min−1 ) and export from (kout , min−1 ) the nucleus as func-
between rhd-tRNA concentration and emission intensity. tions of the level of nutrition (Table 1) by fitting the fluo-
The loaded micropipettes were then connected to an Eppen- rescence intensity ratio (FIR = CN /CC , Figure 5) of the
dorf Femtojet microinjection system and mounted on an average nuclear concentration (CN ) and cytoplasmic con-
Eppendorf Transferman NK2 piezoelectric micromanipu- centration (CC ) at a distance of 1.5 m from the nuclear
lator attached to the Leica DMI4000 Microscope with Yok- membrane to Equation (1). Equation (1) is derived (SI–S3)
agawa CSU-X1 Spinning Disk Confocal Attachment. Cells from a model which assumes that the cytoplasmic mem-
were microinjected with rhd-tRNA volume equivalent to brane is impermeable to tRNA and that transport processes
∼10% of the cell volume (to an average cellular concentra- within the cytoplasm and the nucleus are relatively rapid in
tion of ∼2.3 M rhd-tRNA) at a point away from the nu- comparison to transport through the nuclear envelope, so
cleus (Figure 1). Similar procedures were used when cells that the concentration distributions in the nucleus and cy-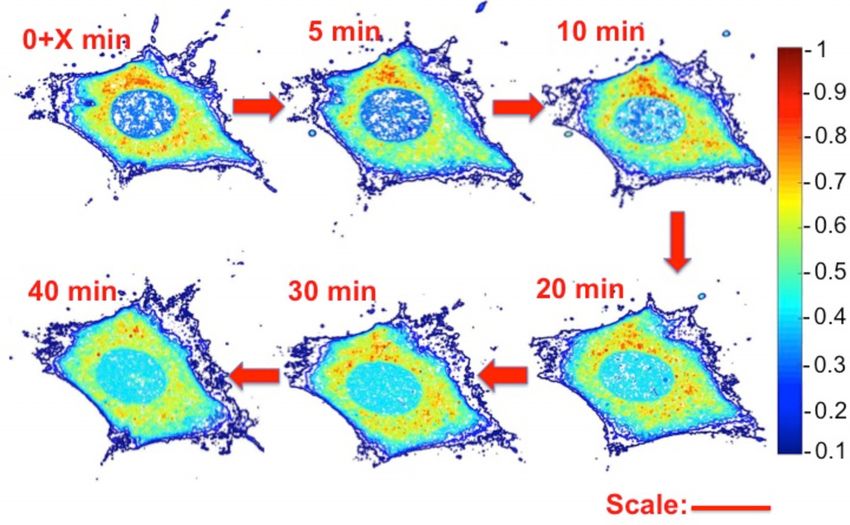
2004 Nucleic Acids Research, 2019, Vol. 47, No. 4
Figure 1. Cartoon of a Mouse Embryonic Fibroblast (MEF). (A) Cell cross-section and confocal slices at cell’s bottom, mid-height, and top. (B) Mid plane
cross-section. The average fluorescence intensity emitted from the indicated 5 × 5 pixel rectangular regions next to the nuclear membrane was used to
determine the ratio between the nuclear and cytoplasmic fluorescence intensity (FIR) and in the model we use to estimate reaction rate constants.
Figure 3. Surface plots of normalized fluorescent emission intensity dis-
tribution from a 0.4 m-thick confocal slice located at cell’s mid-height at
various times following rhd-tRNA injection. Full nutrition. The emission
intensity was normalized with the maximum intensity in the first image.
Similar images from confocal slices at the cell’s bottom and top are shown
in Supplementary Figure SI–S1. Scale bar: 25 m. Time is measured after
X < 30 s from tRNA injection into the cytoplasm.
ble 1), with the decrease in kout surpassing the decrease in
Figure 2. Bulk rhd-tRNA distribution within 0.4 m-thick confocal slices kin .
(located at MEF cells’ mid-height) as a function of time under various nu-
tritional conditions: (A) No nutrition, (B) 25% nutrition, (C) 50% nutrition
and (D) full (100%) nutrition. Scale bar 25 m. Time 0 corresponds to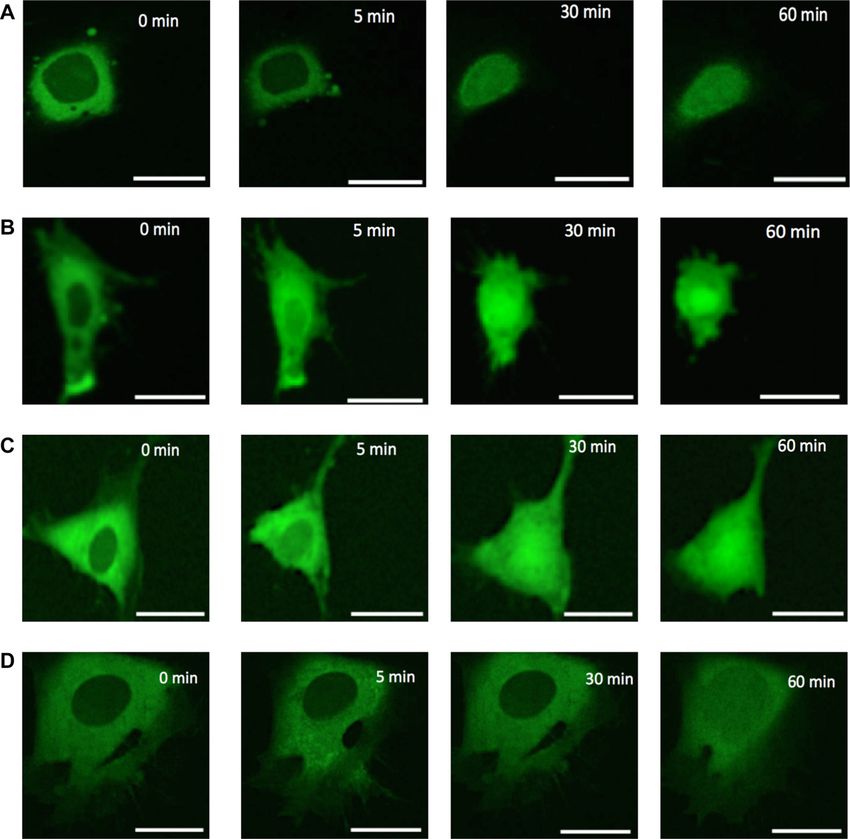
Nucleic Acids Research, 2019, Vol. 47, No. 4 2005
Table 1. Rate constants for different nutritional media (the numbers in parenthesis correspond to standard error)
# of cells
Nutrition kin (min−1 ) kout (min−1 ) FIR∞ = (kin /kout ) (min) R2 *** analyzed
100% nutrition* 0.30 (0.04) 0.32 (0.04) 1.0 (0.1) 2.40 (0.3) 0.58 20
50% nutrition* 0.16 (0.03) 0.10 (0.02) 1.6 (0.2) 8.8 (2.2) 0.97 4
25% nutrition* 0.18 (0.04) 0.08 (0.03) 2.2 (0.2) 12.6 (2.7) 0.97 6
No nutrition* 0.18 (0.04) 0.06 (0.02) 3.0 (0.5) 14.3(2.0) 0.96 20
100% nutrition + 2 mM puromycin n.d. n.d. 0.81 (0.1) 1.06 (0.1)** 0.31 11
no nutrition + 2 mM puromycin n.d. n.d. 0.9 (0.06) 1.13 (0.1)** 0.28 5
100% nutrition + 1 min nocodazole n.d. n.d. 0.87 9.3 (2.3)** 0.77 11
100% nutrition + 1 h nocodazole n.d. n.d. 1.16 10.5 (1.5)** 0.94 7
100% nutrition + 2 h nocodazole n.d. n.d. 1.22 10 (1.5)** 0.93 6
100% nutrition + 3 h nocodazole n.d. n.d. 1.45 6.8 (1.1)** 0.94 6
100% nutrition + 4 h nocodazole n.d. n.d. 1.4 5.5 (0.9)** 0.95 6
* Reaction rate constants determined by fitting data to Equation (1).
** Time constants determined by fitting data to equation SE7.
*** Coefficient of determination [42]
n.d. – not determined. Attempts to fit the data to Equation (1) in the presence of either puromycin or nocodazole failed to converge. The reaction rate
constants were determined with equation SI–SE8.
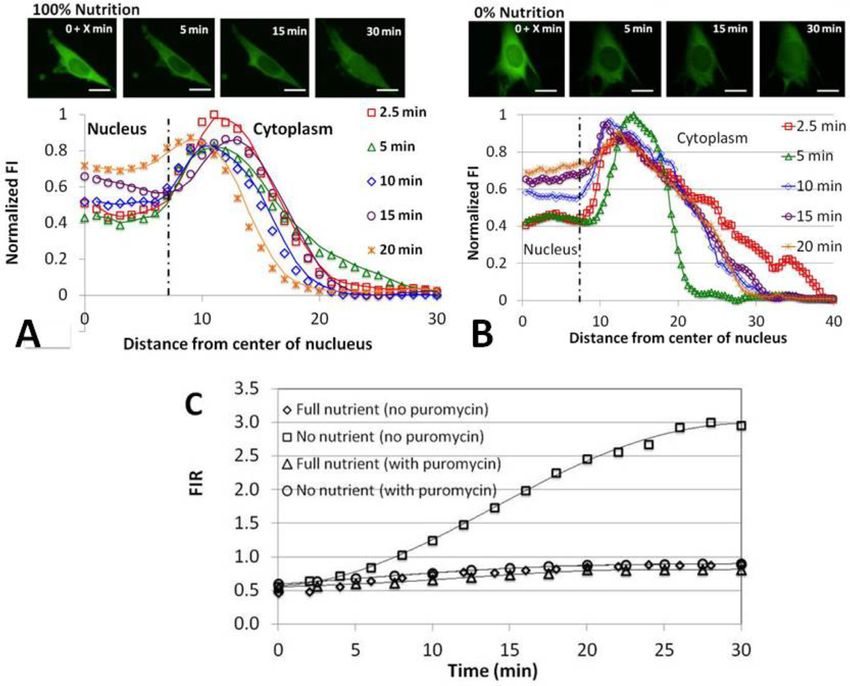
Figure 4. Normalized fluorescence emission intensity along a ray originating at the nucleus center as a function of the distance from the nuclear center
at various times after cell injection of the fluorescent-labeled polynucleotides rhd-tRNA (A, B) and FAM-80-DNA (C) in the presence (100%) (A, C) and
absence (0%) (B) of nutrition in the extracellular solution. The vertical line at 7 m indicates the location of the nuclear membrane. The data is normalized
with the initial maximum intensity (at the peak) to compensate for possible variations in illumination and bleaching across experiments.
Figure 5. The ratio (FIR) of average rhd-tRNA concentration in the nucleus and cytoplasm as a function of time in the presence of 100% (squares), 50%
(diamonds), 25% (triangles), and 0% (circles) nutrient. The symbols and solid lines represent, respectively, experimental data for three cells and predictions
based on Equation (1). Completely filled, textured, and hollow symbols represent three different cells for each nutrient condition. Cells were maintained
in the specified medium for 2 hours prior to rhd-tRNA injection into the cytoplasm. Time t = 0 corresponds to
2006 Nucleic Acids Research, 2019, Vol. 47, No. 4

min the ring of peak rhd-tRNA emission intensity disap-            tion for 30 min after injection, in the presence (100%, Fig-
peared, and emission intensity in the cytoplasm decreased          ure 7A) and absence (0%, Figure 7B) of nutrition (see also
monotonically with radial distance. Similar behaviors were         SI–S6). Both cases exhibit the characteristic non-uniform
observed in the bottom and top confocal slices (Supplemen-         spatial tRNA distribution in the cytoplasm. In the pres-
tary SI–Figure S1).                                                ence of puromycin at both 100% and 0% nutrition, the nu-
   To determine whether the non-uniformity in cytoplas-            clear tRNA concentration increases with time, but never ex-
mic tRNA distribution is specific to tRNA or common to             ceeds the maximum tRNA concentration in the cytoplasm.
fluorescently-labeled polynucleotides, we injected a fluores-      Figure 7C compares FIR in the presence and absence of
cently labeled 80 nt ssDNA (FAM-80-DNA, SI S7), similar            puromycin and in the presence and absence of nutrition. In
in length to tRNA, into cells maintained at 100% nutrition         the presence of puromycin, FIR∞ was nearly unaffected by
and assessed ssDNA concentration distribution in the cell          nutrition level (Table 1) while in the absence of puromycin,
as a function of time (Figure 4C). We hypothesize that an          FIR∞ increased from ∼1 to ∼3 as nutrition level depleted
ssDNA is less likely to have specific interactions with cyto-      from 100% to 0%. Our results differ from those presented
plasmic components than tRNA. The ssDNA distribution               in a prior report (29) showing that FIR increases about 2
in the cytoplasm at full nutrition appeared qualitatively sim-     fold when Chinese hamster ovary cells (CHO) transfected
ilar to that of tRNA (Figure 4A). Thus, tRNA distribution          with Cy3-labeled tRNA are treated with puromycin under
in the cytoplasm, unlike its accumulation in the nucleus,          full nutrition conditions. We have not observed such a pro-
does not appear to be due to a tRNA-specific mechanism.            nounced effect under full nutrition, perhaps due to differ-
                                                                   ences in cell types and/or internal rhd-tRNA concentra-
                                                                   tions in the two experiments. We were unable to estimate
Cells react rapidly to nutrition deprivation
                                                                   reaction rate constants with Equation (1). In Table 1, we re-
In our experiments described above, we maintained cells in         port only time constants based on simple exponential fits
a specific extracellular solution for 2 h, allowing them to        (SI-SE8). Interestingly, by this criterion puromycin appears
attain near-equilibrium with the extracellular environment,        to accelerate tRNA translocation at both 100% and 0% nu-
before injecting rhd-tRNA into the cytoplasm. To exam-             trition, suggesting that puromycin treatment may lead to a
ine how fast the cell responds to variations in its environ-       selective decrease in the levels of one or more proteins that
ment, we injected rhd-tRNA into cells in a 100% nutrition          down-regulate tRNA nuclear transport.
medium and after 30 min changed the medium to PBS so-
lution (0% nutrition). At 100% nutrition, tRNA accumu-
                                                                   Cell exposure to nocodazole enhances tRNA transport rate
lated in the nucleus, attaining FIR ∼0.7 after 30 min (Fig-
ure 6A). This value is smaller than FIR∞ since the time            To examine whether tRNA transport into the nucleus and
of initial incubation was less than that required to estab-        tRNA spatial distribution in the cytoplasm depend on ac-
lish equilibrium. When nutrients were removed from the             tive transport along microtubules, previously implicated in
extracellular solution, FIR increased to >1.0 within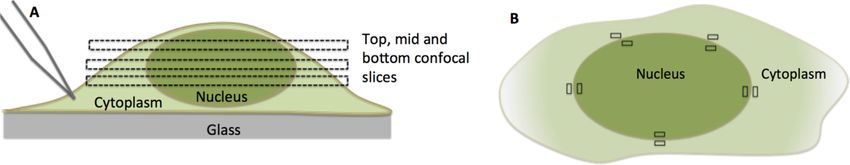
Nucleic Acids Research, 2019, Vol. 47, No. 4 2007

Figure 6. Cytoplasmic tRNA shuttling between nucleus and cytoplasm when the cell media is changed during observation. (A) Cells are deprived of
nutrition by replacing fresh media with PBS after 30 min of observation, resulting in retrograde nuclear accumulation (N = 27). (B) The cell is replenished
with fresh media after 30 min in PBS (0% nutrition), resulting in tRNA export from the nucleus to the cytoplasm (N = 6).

Figure 7. Puromycin suppresses nuclear tRNA aggregation (see SI-S6 for enlarged images). Normalized fluoresence intensity as a function of distance
from the nucleus center in the presece of puromycin and 100% (A) or 0% (B) nutrition. (C) FIR as a function of time in the presence (N = 11) and absence
(N = 5) of puromycin and in the presence and absence of nutrition. X < 30 s.

which tRNA subcellular dynamics can be isolated from                            these important biological molecules, and is applicable to
tRNA transcription, and which is amenable to measure-                           address other important questions in cell biology.
ments in live cells. We monitor in real time the kinetics of
tRNA trafficking between the cytoplasm and the nucleus
following controlled injection of fluorescent rhd-tRNA into                     In the absence of nutrition, tRNA accumulates rapidly and
the cytoplasm of single live cells. Our results improve our                     reversibly in the nucleus
understanding of the behavior of intracellular tRNA. Our                        Our results provide clear evidence that following injection
approach, combining microinjection with fluorescent mi-                         of tRNA into the cytoplasm, accumulation of tRNA in
croscopy, provides a new way to study the diverse roles of                      the nucleus proceeds via a rapid (within minutes) and re-
2008 Nucleic Acids Research, 2019, Vol. 47, No. 4
Figure 8. (A) rhd-tRNA emission intensity from a 0.4 m confocal slice of a cell pre-exposed for 3 h to 100 nM extracellular microtubule de-polymerizing
agent nocodazole. Scale bar 25 m. X < 30 s corresponds to time after injection. See SI-S7 for additional data. (B) Fluorescent intensity along the cell’s
diameter at various times after rhd-tRNA injection into the cell. (C) Fluorescent intensity ratio (FIR) as a function of time under 100% and 0% nutrition
in the absence of nocodazole, and under 100% nutrition and 0.02 (N = 11), 1 (N = 7), 2 (N = 8), 3 (N = 6) and 4 (N = 6) hours pre-exposure to nocodazole.
versible process. Application of a simple kinetic model al- The rapid rise in the time constant for transfer seen in cells
lows us to estimate the import and export reaction rate con- exposed to nocodazole (Table 1) suggests that protein mo-
stants (Supplemental Information S3). At 100% nutrient, tors may participate in tRNA transport in the cytoplasm,
the nuclear rhd-tRNA concentration eventually attains a as demonstrated recently in neural cells (32). On the other
level similar in magnitude to that just outside the nuclear hand, the subsequent decrease in time constant that coin-
membrane (FIR∞ ∼ 1) and the rate constants for tRNA ex- cides with extensive depolymerization, could be attributable
port out of and import into the nucleus are similar (Table 1). to increased cytoplasmic rates of tRNA diffusion and mi-
Both rates decrease as the nutrient level is lowered, but the gration, and implies the existence of tRNA transport mech-
effect is much greater on the export rate, with the resulting anisms other than protein motors. Protein motors are not
imbalance leading to an FIR∞ of three under complete star- the primary mechanism that maintains the non-uniformity
vation (Figure 5, inset). This result is consistent with data of tRNA cytoplasmic concentration distribution, since this
showing net retrograde transport of tRNA under amino distribution is little affected by prolonged nocodazole treat-
acid, glucose, and inorganic phosphate starvation in S. cere- ment.
visiae (2,7,28). Since all rhd-tRNA is initially injected into
the cytoplasm, an FIR greater than one forces the conclu-
sion that, at least at low nutrition, accumulation of tRNA Non-uniform spatial distribution of tRNA in the cytoplasm
in the nucleus cannot be accomplished passively via nuclear We consistently observe a non-uniform concentration dis-
pores and must require active pumping. When the high nu- tribution of rhd-tRNA between the perinuclear region and
trition extracellular medium is refurnished, tRNA migrates the cell periphery at cell’s midheight. At short times, the cy-
reversibly and rapidly from the nucleus to the cytoplasm toplasmic tRNA concentration peaks a short distance from
and FIR decreases to about one (Figure 6B), consistent with the nuclear membrane and declines towards the plasma
our model predictions (SI–S5). membrane (Figure 4). The height of the peak relative to the
nuclear tRNA concentration decreases as time increases.
If diffusion alone were responsible for cytoplasmic tRNA
Pharmaceuticals modify tRNA import and export
transport, we would expect the rhd-tRNA concentration
Both tRNA import and export are known to proceed via following injection to decline as we approach the nuclear
specific protein carriers (3), making it somewhat unexpected envelope; we see the opposite. Furthermore, at equilibrium,
that the translation inhibitor puromycin suppresses nuclear one would expect a uniform tRNA concentration through-
tRNA accumulation under starvation conditions (Figure out the cytoplasm. Clearly, this is not the case. Rather, the
7 and Table 1) and maintains FIR∞ ∼ 1 in the absence cytoplasmic tRNA concentration decreases as the distance
(0%) of nutrition. The detailed mechanisms underlying the from the nucleus increases (Figure 4).
rate results reported in Table 1 and the role of puromycin We exclude imaging artifacts (SI–S4), leakage of tRNA
remain to be elucidated. Equally unclear are the detailed through the plasma membrane (SI S5), and protein motors
mechanisms giving rise to the effects of the depolymeriz- as primary mechanisms for non-uniform tRNA distribu-
ing drug nocodazole, but some speculations are warranted. tion. So what causes non-uniform cytoplasmic tRNA distri-Nucleic Acids Research, 2019, Vol. 47, No. 4 2009
bution? Below, we propose two plausible mechanisms that (ATP) to electric energy via ionic pumps that generate elec-
might be responsible. tric fields and polarize the cell to support a biological pro-
cess. We believe that such an admittedly speculative hypoth-
esis is worth pursuing.
Proposed mechanism 1 for nonuniform tRNA distribution:
Specific tRNA interactions
SUPPLEMENTARY DATA
tRNA interactions in the cytoplasm could cause non-
uniform distribution, with a tendency to concentrate tRNA Supplementary Data are available at NAR Online.
near the nucleus. Consistent with this mechanism is the
spatial distribution of hot spots, representing tRNA aggre-
ACKNOWLEDGEMENTS
gates (Figure 3 and Supplementary Figure SF2). Such hot
spots could be due to tRNA binding to cell components, Drs Iuliia Pavlyk and Pavan Vedula from the Department of
such as polysomes and multi-aminoacyl-tRNA synthetase Biomedical Sciences, School of Veterinary Medicine, Uni-
complexes (MSCs). Indeed, MSCs are recruited by stress- versity of Pennsylvania, assisted with cell culture. Con-
granules, a depot for mRNA and translation components focal microscopy was carried out at the Penn Veterinary
(32). Alternatively, or in addition, the hot spots could repre- Medicine Imaging Core with Gordon Ruthel’s assistance.
sent tRNA granules, distinct from stress granules, that have
recently been reported when tRNAs are transfected into
FUNDING
neuroblastoma cells by either electroporation or lipofection
(32). However, the similarities in the non-uniform cytoplas- National Institute of Health: National Institute of
mic distributions of FAM-80-DNA and rhd-tRNA (Figure Biomedical Imaging and Bioengineering [NIH NIBIB
4) argue against a tRNA-specific mechanism as being solely 1R21EB016343] to the University of Pennsylvania; Anna
responsible for the observed non-uniformity. Kashina’s lab is funded by NIH [R35GM122505]; Barry
Cooperman’s lab is funded by NIH [R01GM-080376].
Funding for open access charge: Institution.
Proposed mechanism 2 for non-uniform tRNA distribution:
Conflict of interest statement. None declared.
Electrophoresis
A mechanism that would be common to all polynucleotides
is migration in an electric field (electrophoresis). An elec- REFERENCES
tric field directed from the nucleus vicinity outwards within 1. Alberts,B., Bray,D., Hopkin,K., Johnson,A., Lewis,J., Raff,M.,
the confocal slice at cell’s midheight would apply an elec- Roberts,K. and Walter,P. (2013) Essential Cell Biology, 4th edn.
Taylor & Francis Group, pp. 2013.
trostatic force to the negatively-charged polynucleotides, 2. Hopper,A.K. and Shaheen,H.H. (2008) A decade of surprises for
causing them to migrate towards the nucleus. Such a field tRNA nuclear-cytoplasmic dynamics. Trends Cell Biol., 18, 98–104.
might arise from ionic pumps in the plasma and/or nuclear 3. Chatterjee,K., Nostramo,R.T., Wan,Y. and Hopper,A.K. (2018)
membranes that induce ionic currents in the cytoplasm. Al- tRNA dynamics between the nucleus, cytoplasm and mitochondrial
though cell injury resulting from microinjection might in- surface: Location, location, location. Biochim. Biophys. Acta Gene
Regul. Mech., 1861, 373–386.
duce an electric field in the cytoplasm (34), such an electric 4. Hopper,A.K. (2013) Transfer RNA post-transcriptional processing,
field would be short–lived, lasting a few minutes, inconsis- turnover, and subcellular dynamics in the yeast saccharomyces
tent with the lengthy steady-state we observed. cerevisiae. Genetics, 194, 43–67.
The two mechanisms considered above are not mutually 5. Shaheen,H.H. and Hopper,A.K. (2005) Retrograde movement of
tRNAs from the cytoplasm to the nucleus in Saccharomyces
exclusive. The rough ER is near the nucleus. High local cerevisiae. PNAS, 102, 1290–11295.
tRNA concentration may be caused by interactions with 6. Kramer,E.B. and Hopper,A.K. (2013) Retrograde transfer RNA
the ribosomes in the rough ER, especially at full nutrition, nuclear import provides a new level of tRNA quality control in
explaining the concentration peaks in Figure 4. The pres- Saccharomyces cerevisiae. PNAS, 110, 21042–21047.
ence of the peak in tRNA concentration outside the nuclear 7. Murthi,A., Shaheen,H.H., Huang,H.Y., Preston,M.A., Lai,T.P.,
Phizicky,E.M. and Hopper,A.K. (2010) Regulation of tRNA
membrane can also be attributed to variations in the cy- bidirectional Nuclear-Cytoplasmic trafficking in saccharomyces
toplasm’s electric properties. Interestingly, the electric field cerevisiae. Mol. Biol. Cell, 21, 639–649.
may assist in protein synthesis by counteracting diffusion 8. Yoshihisa,T., Yunoki-Esaki,K., Ohshima,C., Tanaka,N. and Endo,T.
and concentrating tRNA next to the ribosome. (2003) Possibility of cytoplasmic pre-tRNA splicing: the yeast tRNA
splicing endonuclease mainly localizes on the mitochondria. Mol.
Our results strongly support the notion that, in starving Biol. Cell, 14, 3266–3279.
cells, tRNA trafficking across the nuclear envelope is ac- 9. Lund,E. and Dahlberg,J.E. (1998) Proofreading and aminoacylation
tively controlled, is rapid (within minutes), and reversible. of tRNA before export from the nucleus. Science, 282, 2082–2085.
The dependence of import and export rate constants on 10. Kadaba,S., Krueger,A., Trice,T., Krecic,A.M., Hinnebusch,A.G. and
nutrition level suggests that ATP levels might mediate this Anderson,J. (2004) Nuclear surveillance and degradtion of
hypomodified initiator tRNAMet in S. cerevisiae, Genes Dev., 18,
control. The process is modulated by pharmaceuticals - ret- 1227–1240.
rograde tRNA nuclear accumulation is suppressed in cells 11. Shaheen,H.H., Horetsky,R.L., Kimball,S.R., Murthi,A.,
treated with puromycin and enhanced in cells treated with Jefferson,L.S. and Hopper,A.K. (2007) Retrograde nuclear
nocodazole. accumulation of cytoplasmic tRNA in rat hepatoma cells in response
to amino acid deprivation. PNAS, 104, 8845–8850.
Lastly, we have demonstrated that our results can plausi- 12. Miyagawa,R., Mizuno,R., Watanabe,K. and Ijiri,K. (2012)
bly be explained by the hypothesis that even a non-excitable Formation of tRNA granules in the nucleus of heat-induced human
cell can function as a battery, converting chemical energy cells. Biochem. Biophys. Res. Commun., 418, 149–155.2010 Nucleic Acids Research, 2019, Vol. 47, No. 4
13. Watanabe,K., Miyagawa,R., Tomikawa,C., Mizuno,R., 25. Mei,Y.D., Yong,J., Liu,H.T., Shi,Y.G., Meinkoth,J., Dreyfuss,G. and
Takahashi,A., Hori,H. and Ijiri,K. (2013) Degradation of initiator Yang,X.L. (2010) tRNA binds to cytochrome c and inhibits caspase
tRNA Met by Xrn1/2 via its accumulation in the nucleus of activation. Mol. Cell, 37, 668–678.
heat-treated HeLa cells. Nucleic Acids Res., 41, 4671–4685. 26. Zhao,Y., Butler,E. and Tan,M. (2013) Targeting cellular metabolism
14. Chen,D.-F., Lin,C., Wang,H.-L., Zhang,L., Dai,L., Jia,S.-N., to improve cancer therapeutics. Cell Death Dis., 4, e532.
Zhou,R., Li,R., Yang,J.-S., Yang,F. et al. (2016) An La-related protein 27. Michelakis,E.D., Webster,L. and Mackey,J.R. (2008) Dichloroacetate
controls cell cycle arrest by nuclear retrograde transport of tRNAs (DCA) as a potential metabolic-targeting therapy for cancer. Br. J.
during diapause formation in Artemia. BMC Biol., 14, 1741–7007. Cancer, 99, 989–994.
15. Huynh,L.N., Thangavel,M., Chen,T., Cottrell,R., Mitchell,J.M. and 28. Whitney,M.L., Hurto,R.L., Shaheen,H.H. and Hopper,A.K. (2007)
Praetorius-Ibba,M. (2010) Linking tRNA localization with activation Rapid and reversible nuclear accumulation of cytoplasmic tRNA in
of nutritional stress responses. Cell Cycle, 9, 3112–3118. Response to Nutrient Availability. Mol.Biol. Cell, 18, 2678–2686.
16. Eckwahl,M.J., Telesnitsky,A. and Wolin,S.L. (2016) Host RNA 29. Barhoom,S., Kaur,J., Cooperman,B.S., Smorodinsky,N.I.,
packaging by rotaviruses: anewly synthesized story. mBio, 7, Smilansky,Z., Ehrlich,M. and Elroy-Stein,O. (2011) Quantitative
e02025-15. single cell monitoring of protein synthesis at subcellular resolution
17. Zaitseva,L., Myers,R. and Fassati,A. (2006) tRNAs promote nuclear using fluorescently labeled tRNA. Nucleic Acids Res., 39, e129.
import of HIV-1 intracellular reverse transcription complexes. PLoS 30. Barhoom,S., Farrell,I., Shai,B., Dahary,D., Cooperman,B.S.,
Biol., 4, e332. Smilansky,Z., Elroy-Stein,O. and Ehrlich,M. (2013) Dicodon
18. Lborra,F.J., Jackson,D.A. and Cook,P.R. (2001) Coupled monitoring of protein synthesis (DiCoMPS) reveals levels of
transcription and translation within nuclei of mammalian cells. synthesis of a viral protein in single cells. Nucleic Acids Res., 41, e177.
Science, 293, 2239–2242. 31. Plochowietz,A., Farrell,I., Smilansky,Z., Cooperman,B.S. and
19. Dahlberg,J.E., Lund,E. and Goodwin,E. (2003) Nuclear translation: Kapanidis,A.N. (2017) In vivo single-RNA tracking shows that most
what is the evidence? RNA, 9, 1–8. tRNA diffuses freely in live bacteria. Nucleic Acids Res., 45, 926–937.
20. Tuller,T. (2012) The effect of dysregulation of tRNA genes and 32. Pilotte,J., Chan,S.W., Farnum,J.B., Thomas,W.M., Smilansky,Z. and
translation efficiency mutations in cancer and neurodegeneration. Vanderklish,P.W. (2018) A heterogeneous tRNA granule structure
Front. Genet., 3, 201. exhibiting rapid bidirectional neuritic transport. Eur. J. Cell Biol, 97,
21. Pavon-Eternod,M., Gomes,S., Geslain,R., Dai,Q., Rosner,M.R. and 168–179.
Pan,T. (2009) tRNA over-expression in breast cancer and functional 33. Cassimeris,L.U., Wadswarth,P. and Salmon,E.D. (1986) Dynamics of
consequences. Nucleic Acids Res, 37, 7268–7280. microtubule depolymerization in Monocyes. J. Cell Biol., 102,
22. Hou,Y.M. and Yang,X.L. (2013) Regulation of cell death by transfer 2023–2032.
RNA. Antioxid. Redox Sign., 19, 583–594. 34. Luxardi,G., Reid,B., Maillardc,P. and Zhao,M. (2014) Single cell
23. Mei,Y.D., Stonestrom,A., Hou,Y.M. and Yang,X.L. (2010) wound generates electric current circuit and cell membrane potential
Apoptotic regulation and tRNA. Protein Cell, 1, 795–801. variations that requires calcium influx. Integr. Biol., 6, 662–672.
24. Mei,Y.D., Yong,J.S., Stonestrom,A. and Yang,X.L. (2010) tRNA and
cytochrome c in cell death and beyond. Cell Cycle, 9, 2936–2939.You can also read