DSP Quant Fund Title to come
←
→
Page content transcription
If your browser does not render page correctly, please read the page content below
DSP Quant Fund
[Title      toequity
 (An open ended come]scheme investing based on a quant model theme)

[Sub-Title to come]

Portfolio Updates

                  Date           Strictly for Intended Recipients Only
May 2022
* DSP India Fund is the Company incorporated in Mauritius, under which ILSF is the corresponding share class
Executive Summary
  Performance since previous re-balance: The fund has underperformed the benchmark S&P S&P BSE200 TRI by 7.5% over
  the past 7 months (from the last rebalance in September 2021 till April 2022).

  Performance since inception: Since inception, the fund has an outperformance of 1.1% (annualized) vs its benchmark S&P
  BSE 200 TRI as on 30 April 2022. Overall, the fund has exhibited superior up-capture down-capture ratios (slide 3). Essentially
  it has generated higher alpha in weak markets and captured a large part of the upside.

  Recent underperformance of Low Volatility strategies: Low volatility factor simply refers to a portfolio construction
  technique that creates a portfolio of stocks that exhibit lower volatility with respect to the broader market. The low volatility
  anomaly refers to the empirical evidence that seems to suggest that low volatility securities tend to generate higher risk-
  adjusted returns over the long term than can be explained by the CAPM (Capital Asset Pricing Model) which suggests that
  investors should be rewarded for taking higher risk. The defensive characteristics of the low volatility strategies make them
  uniquely attractive for investors looking to lower drawdowns during market turmoil. While the recent underperformance of
  low volatility strategies has been challenging, the significant macro headwinds facing the strategy cannot be understated. We
  have made an attempt to contextualize the underperformance with the extreme drawdowns that we have witnessed in long
  duration fixed income instruments

 Source: MFIE-ICRA analytics, Internal , FactSet.
 Returns are for Direct plan – growth option

             Refer to Annexure 1 and 2 for performance in SEBI prescribed format and of other schemes managed by same Fund Manager. Past performance may or may   2
             not sustain in future and should not be used as a basis for comparison with other investments.
DSP Quant Fund Performance (as of 29 Apr 2022)
Growth of INR 10,000 Investment at Inception
20,000
Direct YTD 6 month 1 year Inception
Regular -8.7% -8.0% 13.7% 17.7%
18,000 Fund-Dir
Index
Fund-Reg -8.9% -8.4% 12.9% 16.9%
16,000
Index -0.4% -1.6% 20.2% 16.6%
14,000
Benchmark index is S&P BSE200 TRI
INR Value
12,000 Risk Metrics Direct - G Regular - G Index
Jensen’s Alpha 2.4% 1.6%
10,000 Beta 0.90 0.90 1
Standard Deviation 21% 21% 22%
8,000 Information Ratio 0.19 0.04
Sharpe Ratio 0.67 0.63 0.6
6,000 Sortino Ratio 0.73 0.68 0.63
Feb-20
Sep-20
Sep-21
Dec-19
Dec-20
Dec-21
Jun-19
Aug-19
Jun-20
Aug-20
Jan-21
Aug-21
Jan-22
Jul-19
Oct-19
Apr-20
Jul-20
Apr-21
Jul-21
Apr-22
Nov-19
Mar-20
Nov-20
Mar-21
Nov-21
Mar-22
May-21
Up Capture 91% 89%
Down Capture 87% 88%
Source: MFIE-ICRA analytics, Internal; The performance numbers are total return series from 10-Jun-2019 to 29-Apr-2022 for the direct and regular growth option. Benchmark index is S&P BSE200 TRI
Jensen's Alpha is a risk-adjusted performance measure of the excess returns of the portfolio above or below that predicted by the CAPM or capital asset pricing model, given the portfolio’s beta and
the market returns. Beta is a measure of the volatility or systematic risk of a portfolio to that of market represented by fund’s benchmark. Standard deviation is a measure of volatility which measures
how widely individual performance returns, within a performance series, are dispersed from the average or mean value. Lower standard deviation is considered to be better. Information ratio is a
measure of risk adjusted return. It divides the portfolio’s excess return relative to benchmark by its tracking error vs. the benchmark. Sharpe ratio is a risk-adjusted measure calculated as the ratio of
excess portfolio return over the risk free rate divided by the portfolio standard deviation. The Sharpe ratio determines return per unit of risk. Sortino ratio is a variation of the Sharpe ratio that
differentiates downside volatility from total volatility. It is calculated as the ratio of excess return (portfolio return less risk free rate) to the standard deviation of negative returns (downside
deviation) instead of the total standard deviation of portfolio returns. A higher Information Ratio, Sharpe Ratio and Sortino ratio is considered to be better. Up/Down capture measures annualized
performance of the portfolio in up/down markets relative to the market benchmark. A ratio above 1 is considered to be better. Risk free rate (3.49% end Mar’22) is represent by overnight MIBOR rate
published by FBIL
Refer to Annexure 1 and 2 for performance in SEBI prescribed format and of other schemes managed by same Fund Manager. Past performance may or 3
may not sustain in future and should not be used as a basis for comparison with other investments. It is not possible to directly invest in indexFactor Cyclicality: An Eye on Inflation
Factors are known to be cyclical. To study impact on inflation on factors, we have characterized the periods between Sep 2005 and Sep
2021 using macro indicators OECD India CLI (an indicator of growth) and India CPI (Consumer Price Index) growth rate (YoY). The periods
under study are ‘Overheating’ and ‘Stagflation’. During these periods, we have studied the returns of Quality, Growth and Value factor
portfolios and compared with the S&P BSE 200 TRI and the Quant model (multifactor).
The overheating period corresponds with rising OECD India CLI (robust growth) accompanied by rising CPI
The stagflationary period corresponds with falling OECD India CLI (slowing growth) and sticky/rising CPI
For more on OECD India CLI, please visit Leading indicators - Composite leading indicator (CLI) - OECD Data
MAPPING MACRO CONDITIONS TO FACTORS
MACRO↓ INFLATION MACRO↑
Weaker ↑ Economy INFLATION↑
economy Stubbornly peaking Capacity
high prices shortages
Quality Value
tends to tends to Outperform
STAGFLATION OVERHEATING
Outperform Growth &
Growth & Value Quality
Quality RECESSION GOLDILOCKS
Growth
tends to tends to
Outperform Outperform
Growth & Value Quality & Value
MACRO↑
MACRO↓ INFLATION
Economy INFLATION↓
Economy ↓
picking steam Still subdued
slowing Demand
due to spare
collapse
capacity
OECD- Organisation for Economic Co-operation and Development, CLI-Composite leading Indicator, YoY-Year over Year
4Recent underperformance of Low Volatility strategies
While the recent underperformance of low volatility strategies has been challenging, the significant macro headwinds facing the
strategy cannot be understated. We have made an attempt to contextualize the underperformance with the extreme drawdowns that
we have witnessed in long duration fixed income instruments.
The chart below is the peak to trough return drawdown for an ETF that mimics the behavior of US treasury bonds with 20+ yrs
maturity. The current selloff in longer dated US treasury bonds has resulted in the biggest peak to trough drawdown in the history of
this ETF which goes back 20 years.
We tried to analyze the impact of long-term interest rates on the Low volatility/Low beta factor premium. For the analysis we
regressed the quarterly performance of the Dow Jones Market Neutral Anti Beta index (as a proxy for the Low volatility factor
premium) versus the TLT ETF (iShares 20+ Year Treasury Bond (TLT) exchange traded fund (ETF)).
We find that there is a very strong positive correlation between the two return series. In other words, falling longer term yields act as
a very strong tailwind for low volatility strategies. Conversely, when long term yields rise, they act as a substantial headwind for the
performance of low volatility strategies
40
TLT - Peak to Trough drawdown y = 0.6097x - 0.6757
30
0%
Low beta - High Beta (US) dispersion
20
-5%
10
-10%
0
-15%
-20 -10 0 10 20 30
(%, Qtr)
-20% -10
-25% -20
-30% -30.5% -30
-35% -40
2013
2002
2003
2004
2005
2006
2007
2008
2009
2010
2011
2012
2014
2015
2016
2017
2018
2019
2020
2021
2022
-50
TLT Performance (%, Qtr)
Source: Bloomberg.
5Portfolio Details
Names in red italics refer to names added in the recent re-balance. L = Large Cap, M = Mid Cap
Name Mkt Cap % of Assets Name Mkt Cap % of Assets Name Mkt Cap % of Assets
Bajaj Finance L 4.7 HCL Technologies L 3.1 Ambuja Cements L 2.1
Bajaj Finserv L 4.0 L
Infosys L 2.9 Asian Paints 2.9
HDFC Bank L 2.9
L Pidilite Industries L 3.1
HDFC Life Insurance L 2.2 L&T Infotech 2.2
HDFC Limited L 2.9 L Shree Cement L 1.6
Mphasis 2.2
ICICI Bank L 4.2 L
TCS L 3.3 UltraTech Cement 2.5
ICICI Lombard L 2.4
L ACC M 2.0
ICICI Prudential L 1.7 Tech Mahindra 2.4
Kotak Bank L 3.1 Wipro L 2.4 Coromandel Int. M
1.1
Financials 28.1 IT 18.4 Materials 15.3
Britannia Industries L 1.3 Cipla L 2.8 Bajaj Auto Limited L 1.4
Dabur India L 1.8 L
Dr. Reddy's 1.1 Page Industries M 2.7
Hindustan Unilever L 1.5
Abbott India M 0.9 L
ITC L 1.9 Titan Company 3.5
Marico L 2.9 Alkem Laboratories M 1.1 L
Hero Motocorp 1.7
Nestle India L 1.8
M M
Colgate-Palmolive M 1.5 IPCA Laboratories 1.3 Relaxo Footwears 0.8
Cons. Staple 12.6 Healthcare 7.3 Cons. Disc 10.1
Larsen & Toubro L 3.0 Torrent Power M 0.9
Astral M 2.0
Cummins India M 1.3 Utilities 0.9
LTTS M 1.0
Industrials 7.3
Portfolio details as on 29 Apr 2022, since this reflects the full impact of the portfolio re-balance carried on in March end. Exits in the March 31, 2022 rebalance: HDFC Asset Management, Dr. Lal
PathLabs, Pfizer Limited , Oracle Financial Services Software. For 31 March 2022 Portfolio please refer to the Factsheet of March 2022
The sector(s)/stock(s)/issuer(s) mentioned in this presentation do not constitute any research report/recommendation of the same and may or may not have any future position in these 6
sector(s)/stock(s)/issuer(s).. The portfolio of the scheme is rebalanced every March and September endRelative attribution by sector
(Performance since the previous rebalance) 30 September 2021 to 29 April 2022
Portfolio Benchmark Relative Attribution
Average Total Contrib. To Average Total Contrib. To Allocation Selection Total
Sector Weight Return Return Weight Return Return Effect Effect Effect
Communication Services -- -- -- 2.8 -6.5 -0.2 0.2 -- 0.2
Consumer Discretionary 9.2 11.0 0.8 7.5 5.6 0.3 0.1 0.4 0.5
Consumer Staples 10.9 -5.7 -0.5 7.8 -4.9 -0.4 -0.0 -0.1 -0.1
Energy -- -- -- 10.3 9.1 1.0 -1.0 -- -1.0
Financials 28.5 -14.0 -4.4 31.6 -8.2 -2.9 0.2 -1.8 -1.6
Health Care 7.7 -17.0 -1.3 5.1 -5.1 -0.2 -0.2 -1.0 -1.1
Industrials 7.1 -1.5 -0.2 6.0 6.2 0.3 0.1 -0.5 -0.4
Information Technology 21.4 -11.3 -2.0 14.4 -7.3 -0.8 -0.2 -0.9 -1.1
Materials 14.1 -2.8 -0.4 9.5 1.3 0.2 0.1 -0.6 -0.4
Real Estate -- -- -- 0.6 -17.9 -0.1 0.1 -- 0.1
Utilities 0.8 7.4 0.0 4.4 44.4 1.6 -1.4 -0.2 -1.6
Cash and Hedges* 0.2 -- -- -- -- -- -0.6 -- -0.6
Total 100.00 -8.4 -8.4 100.00 -1.2 -1.2 -2.53 -4.7 -7.2
* Cash and Hedges includes SLB (Securities Lending and Borrowing) and F&O (Futures & Option) related gains/losses
• Overweight on Insurance and Healthcare was a significant detractor
• Within Materials, Cement overweight and Metals underweight were the portfolio were the biggest performance detractors
• Underweight on Utilities also a significant performance drag
Source: Factset, Portfolio – DSP Quant Fund; Benchmark – S&P BSE 200 TRI Index; The portfolio of the scheme is rebalanced every March and September end
Returns presented are gross basis; Attribution data has been sourced from FactSet which uses bottom up methodology whereby constituents of both the index and the Fund are priced at the same point
in time. FactSet returns do not take into account Transaction costs or Management fees. FactSet assumes trades go through at closing prices rather than the actual price that may have been traded at
during the day. This data is not of audit quality but is considered useful management information i.e. it will fail to pick up the impact of transaction prices differing from daily closing prices.
The sector(s)/stock(s)/issuer(s) mentioned in this presentation do not constitute any research report/recommendation of the same and may or may not have any future position in these
sector(s)/stock(s)/issuer(s).
Refer to Annexure 1 and 2 for performance in SEBI prescribed format and of other schemes managed by same Fund Manager. Past performance may or may not7
sustain in future and should not be used as a basis for comparison with other investments. It is not possible to directly invest in indexRelative attribution by security of DSP Quant Fund
(Performance since the previous rebalance) 30 September 2021 to 29 April 2022
Portfolio Benchmark Attribution
Average Average Total
Holding Weight Total Return Weight Total Return Effect
Top 5 relative stock contributors 100.0 -8.4 100.0 -1.2 -7.2
Page Industries Limited 2.4 44.6 0.2 44.6 0.7
HDFC Bank Limited 2.9 -13.2 6.5 -13.2 0.5
Kotak Mahindra Bank Limited 0.4 -3.0 2.4 -10.7 0.4
Titan Company Limited 3.0 13.7 1.0 13.7 0.3
Housing Development Finance Corporation 3.7 -19.0 4.6 -19.0 0.2
Bottom 5 relative stock contributors
Reliance Industries Limited 0.0 0.0 8.2 10.9 -1.0
Adani Green Energy Limited 0.0 0.0 0.7 151.7 -0.6
Bajaj Finserv Limited 4.5 -16.2 1.0 -16.2 -0.5
ICICI Prudential Life Insurance Co. Ltd. 2.2 -21.7 0.2 -21.7 -0.5
ICICI Lombard General Insurance Co. Ltd. 2.4 -19.2 0.3 -19.2 -0.4
• Page Industries and Corporate banks underweight were the top contributors to the fund outperformance
• Overweight on Insurance was a significant detractor
• Not owning Reliance Industries and Adani Green Energy also contributed to the fund underperformance
Source: Factset, Portfolio – DSP Quant Fund; Benchmark – S&P BSE 200 TRI Index; The portfolio of the scheme is rebalanced every March and September end
Returns presented are gross basis; Attribution data has been sourced from FactSet which uses bottom up methodology whereby constituents of both the index and the Fund are priced at the same point
in time. FactSet returns do not take into account Transaction costs or Management fees. FactSet assumes trades go through at closing prices rather than the actual price that may have been traded at
during the day. This data is not of audit quality but is considered useful management information i.e. it will fail to pick up the impact of transaction prices differing from daily closing prices.
The sector(s)/stock(s)/issuer(s) mentioned in this presentation do not constitute any research report/recommendation of the same and may or may not have any future position in
these sector(s)/stock(s)/issuer(s).
Refer to Annexure 1 and 2 for performance in SEBI prescribed format and of other schemes managed by same Fund Manager. Past performance may or may not 8
sustain in future and should not be used as a basis for comparison with other investments. It is not possible to directly invest in indexPerformance of DSP Quant Fund v/s Individual factors - Quarterly
32.2%
23.8% 24.2%
22.6%
14.4%
11.7% 12.6%
10.3% 10.5% 9.6% 10.4%
8.7% 8.0% 8.9%
6.8% 7.8% 7.0% 7.4%
4.9%
3.6%
2020 Q3 2020 Q4 2021 Q1 2021 Q2
15.0%
12.0% 12.9% 13.8%
10.1%
1.7% 1.7%
0.2% 0.3%
-0.8% -0.4% -1.2% -0.2% -0.5% -0.7% -1.6%
-2.1% -2.8%
-4.8%
2021 Q3 2021 Q4 -6.0% 2022 Q1 2022 Q2
DSP Quant Fund S&P BSE 200 TRI Quality Growth Value
The performance numbers are total return series from 30-Jun-2020 to 29-Apr-2022. DSP Quant Fund performance numbers are for direct plan growth option. Factor portfolios are created using factor tilting
approach representing portfolios having stocks displaying high values on the respective factor. The factor portfolios are rebalanced every March and September. Data Source: FactSet, Bloomberg, DSP
Investment Managers. Past performance may or may not sustain in future and should not be used as a basis for comparison with other investments.
Refer to Annexure 1 and 2 for performance in SEBI prescribed format and of other schemes managed by same Fund Manager. Past performance may or may not sustain
in future and should not be used as a basis for comparison with other investments. Refer Scheme information document for detailed investment strategy. Figures
mentioned for performance of the Factors of the Quant Model do not in any manner indicate the returns/performance of the scheme. the portfolio of the scheme is
rebalanced at end of every March and September. 9Performance of DSP Quant Fund v/s Individual factors (annualized, since
inception)
QUANT FUND V/S INDIVIDUAL FACTORS (10th Jun 2019 – 29th Apr 2022)
S&P BSE 200 TRI
Growth Factor
Quality Factor
Value Factor
Quant Fund
25%
19.9%
20% 17.8%
16.6%
15.0%
15% 13.4%
10%
5%
0%
The performance numbers are total return series from 10-Jun-2019 to 29-Apr-2022, depicted in annualized terms. DSP Quant Fund performance numbers are for direct plan growth option.
Factor portfolios are created using factor tilting approach representing portfolios having stocks displaying high values on the respective factor. The factor portfolios are rebalanced every March
and September. Data Source: FactSet, Bloomberg, DSP Investment Managers.
Combining multiple factors instead of using single factors is expected to provide diversification benefits
Refer to Annexure 1 and 2 for performance in SEBI prescribed format and of other schemes managed by same Fund Manager. Past performance may or may not sustain
in future and should not be used as a basis for comparison with other investments. Refer Scheme information document for detailed investment strategy. Figures
mentioned for performance of the Factors of the Quant Model do not in any manner indicate the returns/performance of the scheme. the portfolio of the scheme is
rebalanced at end of every March and September. 10Performance of DSP Quant Fund v/s Eliminated buckets
QUANT FUND V/S ELIMINATED BASKETS (10th JUN 2019 – 29th APR 2022)
Forensic analysis RED
S&P BSE 200 TRI
High Leverage
Undertakings
Flags
Public Sector
Quant Fund
35% High Beta Decomposing the performance
31.0% of stock baskets on the basis of
30% each elimination criteria
25%
20% 17.7% 16.6%
14.0%
15% 10.6%
8.5%
10% Majority of the baskets
5% highlighted by the elimination
0% criteria DETRACTED VALUE
from the index performance
QUANT FUND V/S ELIMINATED BASKETS (31st SEP 2021 - 29th APR 2022)
40% 34.2%
30% Even after factoring in a sharp
20% reversal observed in the year
10.3%
10% 5.1% 3.8% to date period
0% The performance numbers are total return series from 10-Jun-
-1.2% 2019 to 29-Apr-2022 for DSP Quant Fund Direct plan growth
-10% option. Eliminated basket portfolios are created using cap
-8.7% weighted methodology for the Eliminated Baskets. Data Source:
-20% FactSet, Bloomberg, DSP Investment Managers..
Highlights the importance of the ELIMINATION STAGE in the overall investment process
Refer to Annexure 1 and 2 for performance in SEBI prescribed format and of other schemes managed by same Fund Manager. Past performance may or may not sustain in future and should
not be used as a basis for comparison with other investments. Refer Scheme information document for detailed investment strategy. It is not possible to invest directly in an index. Figures
mentioned for performance of the Factors of the Quant Model do not in any manner indicate the returns/performance of the scheme. the portfolio of the scheme is rebalanced at end of every
11
March and September.Performance of DSP Quant Fund v/s Composite eliminated basket
QUANT FUND V/S ELIMINATED BASKETS (Inception to 29th Apr 2022)
QUANT FUND
S&P BSE 200
ELIMINATED
COMPOSITE
BASKET
Composite eliminated basket
TRI
DETRACTED SUBSTANTIAL VALUE
from Index performance
20% 17.7% 16.6%
14.8%
10% Highlighted the importance of the
ELIMINATION STAGE in the overall
investment process
0%
QUANT FUND V/S ELIMINATED BASKETS (30th SEP 2021 - 29th APR 2022 )
10%
Even after factoring in a sharp
reversal observed in the year
to date period
1.6%
0%
-1.2% The performance numbers are total return series from 10-Jun-2019
to 29-Apr-2022 for DSP Quant Fund Direct plan growth option.
Performance is in annualized terms for periods greater than 1 year
and in absolute terms for periods of less than 1 year. Eliminated
basket portfolios are created using cap weighted methodology for
the Eliminated Baskets. Data Source: FactSet, Bloomberg, DSP
-10% -8.7% Investment Managers.
Alpha generated via the elimination process
Refer to Annexure 1 and 2 for performance in SEBI prescribed format and of other schemes managed by same Fund Manager. Past performance may or may not sustain in future and should
not be used as a basis for comparison with other investments. Refer Scheme information document for detailed investment strategy. It is not possible to invest directly in an index. Figures
mentioned for performance of the Factors of the Quant Model do not in any manner indicate the returns/performance of the scheme. the portfolio of the scheme is rebalanced at end of every
March and September.
12DSP Quant Fund – Performance of new entries since March 2022 rebalance
-30% -20% -10% 0% 10% 20% 30% 40%
S&P BSE 200 TRI (Benchmark) -1.2%
ICICI Prudential -21.8%
Pfizer -21.1%
Ultratech Cement -10.4%
Relaxo Footwears -7.7%
L&T -0.2%
ICICI Bank 7.4%
L&T Tech. Serv 30.9%
The performance numbers are return series from 30-Sep-2021 to 29-Apr-2022 Source: Factset. Past performance may or may not sustain in
future and should not be used as a basis for comparison with other investments.
The sector(s)/stock(s)/issuer(s) mentioned in this presentation do not constitute any research report/recommendation of the same and may or may not 13
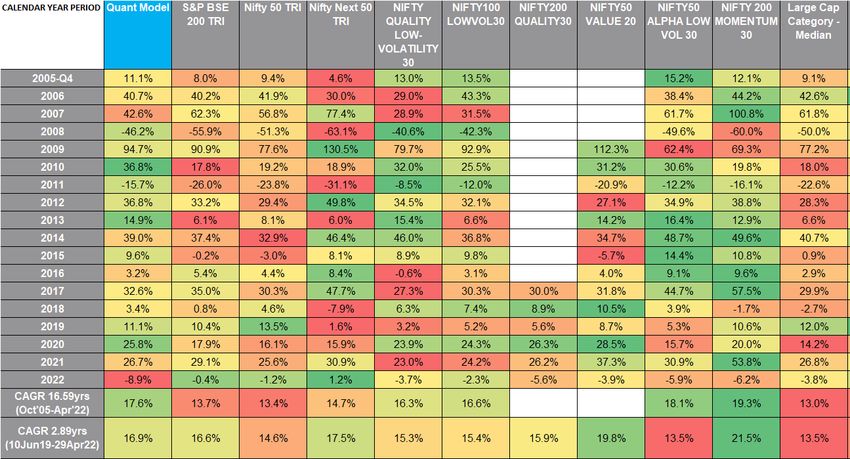
have any future position in these sector(s)/stock(s)/issuer(s).Calendar year returns
Source: MFI and Factset.. Past performance may or may not sustain in future and should not be used as a basis for
comparison with other investments. Figures mentioned for performance of the Quant Model do not in any manner
indicate the returns/performance of the scheme.
14INVESTMENT PROCESS
Investment Process
BASED ON A QUANT MODEL 200 stock
universe Exclude stocks which may destroy value
× High debt
ELIMINATE STOCKS
× Excessive volatility in stock prices
from the S&P BSE 200 Index × Inefficient capital allocators
× Poor quality of reported earnings
~ 100 stocks Select final list by ranking stocks based on average scores for:
SELECT GOOD COMPANIES ✅ Quality
✅ Growth
from the above shortlist ✅ Value
Weights assigned to manage risks
Single Stock exposure limits
30 – 50 stocks Single Sector exposure limits
ASSIGN WEIGHTS
Exposure limits based on stock liquidity
to create the final portfolio
REVIEW & REBALANCE every six months (Mar & Sep)
Model converts sound investing principles into a RULES BASED investment process
16Stage 1 : Criteria used for elimination
NON-ALIGMENT OF POOR QUALITY OF
HIGHLY LEVERAGED HIGHLY VOLATILE
MANAGEMENT REPORTED
COMPANIES STOCKS
INCENTIVES EARNINGS
× High DEBT TO EQUITY × High BETA × High PRICE × Ownership × LOW reliability of earnings
(applicable to all sectors VOLATILITY Criteria × WEAK balance sheets
ex financials) × POOR cash conversion
× Potential governance issues
Disproportionately Shareholder wealth Forensic analysis of
Difficulty to service Typically highly high stock price financials disclosures
interest payments cyclical businesses volatility on a relative creation is not a
primary goal can throw up
& absolute basis potential red flags
Business decisions Accounting &
Raises risk of defaults Haven’t added value
which further to equity holders over maybe driven by Management issues
Potential red flag
tightens liquidity the long term other considerations can lead to severe
value destruction
In case of defaults,
creditors get Minority shareholders
preference over get sub-optimal
equity holders returns
Extensive criteria to identify and eliminate potential value destroyers from the investible universe
17Details of Forensic Analysis
PARAMETERS CONSIDERED IN THE FORENSIC OVERLAY
Large divergence in accounting v/s cash flow
entries suggest aggressive accounting policies
Examples: Divergence in
REPORTED × EBITDA (earnings before interest, taxes, depreciation and
Imprudent management actions can EARNINGS amortization ) v/s Cash Flow from Operations
QUALITY × Interest entry in Cash Flow Statement v/s P&L Statement
destroy minority shareholder value × Annual depreciation rates
Examples:
× High promoter pledge
× High related party transactions MANAGEMENT BALANCE Badly managed balance sheets at
× High loans and advances ACTIONS SHEET HEALTH higher risk of financial distress
Examples: Weak metrics on
× Interest coverage ratio
× Debt/Equity market capitalization
× Credit rating
Aggressive growth -> Asset quality issues->
Solvency risk ANALYSIS FOR
High short term funding -> Liquidity risk FINANCIALS : WORKING
ALM, ASSET CAPITAL CYCLE Cash flow conversion & liquidity issues
Examples:
× High NPA(Non Performing Assets) QUALITY ETC. are early signs of business problems
growth Example: Variability and deterioration in
× High Short term debt to total debt × Debtor days, inventory days and creditor
× Provisioning cover days
Forensic analysis is a critical part of the elimination process
EBITDA –Earnings before Interest, Taxes, Depreciation and Amortization , NPA-Non Performing Assets, ALM-Asset Liability Management
18Stage 2 : Selection process
SELECTION PROCESS FLOW
Select metrics for
~ 100 STOCKS Determine core each factor, rank Select companies 30 – 50 STOCKS
investment each company on with the highest
(remaining after the (final portfolio
principles also every factor and average factor
elimination stage) known as Factors* arrive at an average scores selection)
factor score
*Based on research, established in back-tests
EVALUATING FACTORS
Core Showing a
investment history of
principles generating
alpha Factors convert core investment
principles into easily measurable metrics
Which is constantly Used to arrive at
reviewed for adherence to factors which
the core principles are quantifiable
Factors have historically been principal
drivers of alpha
Help to
And ideally have
construct a
low correlation
diversified
with each other
portfolio
19Stage 2 : Selection of good companies
EVALUATING COMPANIES ACROSS MULTIPLE FACTORS
QUALITY FACTOR GROWTH FACTOR
✔ High RETURN ON EQUITY (with) ✔ High EARNINGS GROWTH
(a) GOOD GOOD (consensus estimates)
✔ CONSISTENT Earnings growth COMPANY PROSPECTS
Strong growth
Profitable and well
prospects
run companies
(at a) Attract investor
Steady earnings GOOD PRICE interest
streams
Receive a premium
Receive a premium in in the market
the market
VALUE FACTOR
Potential to generate
✔ Attractive DIVIDEND YIELD Relatively inexpensive
excess returns during
stocks compared to
phases of value
✔ High FREE CASH FLOW YIELD the market
discovery
Using a multi-factor approach to assess companies in a holistic manner
20Stage 3 : Optimization process
ASSIGN WEIGHTS TO 30 – 50 SELECTED STOCKS AND CREATE FINAL PORTFOLIO
MAXIMIZE PORTFOLIO FACTOR SCORE
Maximize
(weighted average factor score) portfolio
factor
exposure
LOWER OF 10% OR 10X OF
WEIGHT IN S&P BSE 200 INDEX
Semi- Optimized (avoid concentration, ensure
SEMI ANNUAL REBALANCING Stock level liquidity/capacity)
Annual weights for each
(to minimize turnover) constraints
rebalancing selected stock
Sector level
constraints MAX SECTOR ACTIVE WEIGHT = 10%
(avoids risk of sector rotation)
Optimization done with the objective of creating a diversified portfolio
21Risk Management embedded into the Quant model
No sector concentration (sector weights not more than 10% more than the benchmark weight)
No stock concentration (stock weights capped at 10% and stock active weights also capped)
Stocks with limited/low liquidity assigned weights of no more than 1% (measured through days
taken to liquidate the position using average market volumes)
Avoiding stocks with high leverage, forensic red flags, high price volatility – highly volatile stocks
Avoiding stocks that show weakening growth, profits and margins – disrupted business models
Valuation risk managed through relative ranking approach that automatically penalizes companies
which do not pay dividend or do not generate meaningful free cash flows
Relative ranking model avoids loss making companies
Disclaimer : The above indicates the strategy/investment approach currently followed by the Scheme(s) and the same may change
in future depending on market conditions and other factors.
22Risks of investing in the Scheme
The Quant model may go through periods of underperformance and there is no guarantee that the
backtested results will be achieved
The scheme invests in equities and is subject to general risks associated with investments in equity
markets such as price risk, liquidity risk
23Annexure 1 – Performance of DSP Quant Fund in SEBI prescribed format
Performance details provided herein are of regular plan growth option as of 30 Apr 2022 24Annexure 2 – Performance of schemes managed by same Fund Managers
Performance details provided herein are of regular plan growth option as of 30 Apr 2022 25Annexure 2 – Performance of schemes managed by same Fund Managers
Performance details provided herein are of regular plan growth option as of 30 Apr 2022 26Annexure 2 – Performance of schemes managed by same Fund Managers
Appointment of Fund Manager is effective from May 1, 2022. Performance details provided herein are of regular plan growth option as of 30 Apr 2022 27Annexure 2 – Performance of schemes managed by same Fund Managers
Appointment of Fund Manager is effective from May 1, 2022. Performance details provided herein are of regular plan growth option as of 30 Apr 2022 28Product labelling details
Fund Product Suitability Scheme Riskometer Benchmark Riskometer
S&P BSE 200 TRI
This open ended equity scheme is suitable for investors who
are seeking*
DSP Quant Fund
(An open ended equity
Long term capital growth
scheme investing based on a
Investment in active portfolio of stocks screened, selected,
quant model theme)
weighed and rebalanced on the basis of a predefined
fundamental factor model
* Investors should consult their financial advisers if in doubt about whether the Scheme is suitable for them.
29Disclaimer
In this material DSP Investment Managers Private Limited (the AMC) has used information that is publicly available, including information developed in-house. Information
gathered and used in this material is believed to be from reliable sources. The AMC however does not warrant the accuracy, reasonableness and / or completeness of any
information. The data/statistics are given to explain general market trends in the securities market, it should not be construed as any research report/research recommendation.
We have included statements / opinions / recommendations in this document, which contain words, or phrases such as “will”, “expect”, “should”, “believe” and similar
expressions or variations of such expressions that are “forward looking statements”. Actual results may differ materially from those suggested by the forward looking statements
due to risk or uncertainties associated with our expectations with respect to, but not limited to, exposure to market risks, general economic and political conditions in India and
other countries globally, which have an impact on our services and / or investments, the monetary and interest policies of India, inflation, deflation, unanticipated turbulence in
interest rates, foreign exchange rates, equity prices or other rates or prices etc. The sector(s)/stock(s)/issuer(s) mentioned in this presentation do not constitute any research
report/recommendation of the same and may or may not have any future position in these sector(s)/stock(s)/issuer(s). The portfolio of the scheme is subject to changes
within the provisions of the Scheme Information document of the scheme. There is no assurance of any returns/potential/capital protection/capital guarantee to the
investors in this Scheme. Past performance may or may not sustain in future and should not be used as a basis for comparison with other investments. This document
indicates the investment strategy/approach/framework currently followed by the Scheme and the same may change in future depending on market conditions and other
factors. All figures and other data given in this document are as on 30 Apr 2021 (unless otherwise specified) and the same may or may not be relevant in future and the same
should not be considered as solicitation/ recommendation/guarantee of future investments by the AMC or its affiliates. Investors are advised to consult their own legal, tax and
financial advisors to determine possible tax, legal and other financial implication or consequence of subscribing to the units of schemes of DSP Mutual Fund. For complete
details on investment objective, investment strategy, asset allocation, scheme specific risk factors please refer the scheme information document and key information
memorandum of the scheme, which are available at AMC and registrar offices and investor service centres/AMC website- www.dspim.com. For Index Disclaimer click
Here
Mutual Fund investments are subject to market risks, read all scheme related documents carefully.
30INVESTMENT MANAGERS
You can also read