Driving Activity Recognition Using UWB Radar and Deep Neural Networks
←
→
Page content transcription
If your browser does not render page correctly, please read the page content below
sensors
Article
Driving Activity Recognition Using UWB Radar and Deep
Neural Networks
Iuliia Brishtel 1,2, *, Stephan Krauss 1 , Mahdi Chamseddine 1 , Jason Raphael Rambach 1
and Didier Stricker 1,2

                                         1   Department of Augmented Vision, German Research Center for Artificial Intelligence, Trippstadter Str. 122,
                                             67663 Kaiserslautern, Germany
                                         2   Department of Computer Science, RPTU, Erwin-Schrödinger-Str. 57, 67663 Kaiserslautern, Germany
                                         *   Correspondence: Iuliia.Brishtel@dfki.de

                                         Abstract: In-car activity monitoring is a key enabler of various automotive safety functions. Existing
                                         approaches are largely based on vision systems. Radar, however, can provide a low-cost, privacy-
                                         preserving alternative. To this day, such systems based on the radar are not widely researched. In
                                         our work, we introduce a novel approach that uses the Doppler signal of an ultra-wideband (UWB)
                                         radar as an input to deep neural networks for the classification of driving activities. In contrast to
                                         previous work in the domain, we focus on generalization to unseen persons and make a new radar
                                         driving activity dataset (RaDA) available to the scientific community to encourage comparison and
                                         the benchmarking of future methods.

                                         Keywords: modern radar applications; artificial intelligence and machine learning for radar; radar
                                         sensors for driver monitoring; radar signal processing techniques

                                         1. Introduction
Citation: Brishtel, I.; Krauss, S.;
                                               Under the increasing level of automation available in production vehicles, continuous
Chamseddine, M.; Rambach, J.R.;
                                         driver monitoring becomes a crucial safety factor [1]. To ensure drivers remain undistracted
Stricker, D. Driving Activity
                                         in the driving loop [2] and to prevent a negative impact of the autonomous system on
Recognition Using UWB Radar and
                                         the ability of drivers to take over [3–5], multiple methods from various research fields
Deep Neural Networks. Sensors 2023,
23, 818. https://doi.org/10.3390/
                                         including human–machine interaction, psychology, computer science, and ergonomics
s23020818
                                         have been investigated. Thus, in-cabin driver monitoring cameras [6,7] and eye-tracking
                                         systems were tested [3,8–12] and partly integrated into production vehicles. Each of these
Academic Editors: Adam M.                technologies has its own strengths and weaknesses. For instance, despite the high precision
Kawalec, Marta Walenczykowska
                                         of distraction recognition [13,14], in-cabin cameras are considered by many drivers as
and Ksawery Krenc
                                         an intrusion into their privacy. Furthermore, eye-tracking systems cannot fully infer the
Received: 15 November 2022               engagement of the drivers in the driving loop even if their eyes are directed on the road [9].
Revised: 19 December 2022                      Radar technologies experience a growing interest in the field of human activity recog-
Accepted: 4 January 2023                 nition (HAR) and human monitoring. Compared to other optical systems, radar provides
Published: 10 January 2023               unrivaled advantages in terms of privacy, robustness to environmental conditions, low sen-
                                         sitivity to obstacles and hazards, as well as usability [15], enlarging the number of potential
                                         areas of application. While the main area of radar applications for HAR remains indoor
                                         activity classification [4,15–22], vital sign monitoring [23–25] and fall detection [26,27],
Copyright: © 2023 by the authors.
                                         another prospective field is driver monitoring. Several companies have already integrated
Licensee MDPI, Basel, Switzerland.
                                         radar-based solutions for presence and seat occupancy detection [28] as well as vital sign
This article is an open access article
                                         recognition [29–31]. Recent studies also point to the feasibility of radar systems to recognize
distributed under the terms and
                                         drivers’ behavior and physical state even in moving vehicles using radar [30,32].
conditions of the Creative Commons
                                               Most of the studies deploying radar systems for HAR reported outstanding classifica-
Attribution (CC BY) license (https://
                                         tion performance of their machine learning models: in some cases, multi-class classifications
creativecommons.org/licenses/by/
4.0/).
                                         exceeded an average accuracy of 90% [4,19,20,22,32]. However, a detailed examination of

Sensors 2023, 23, 818. https://doi.org/10.3390/s23020818                                                      https://www.mdpi.com/journal/sensors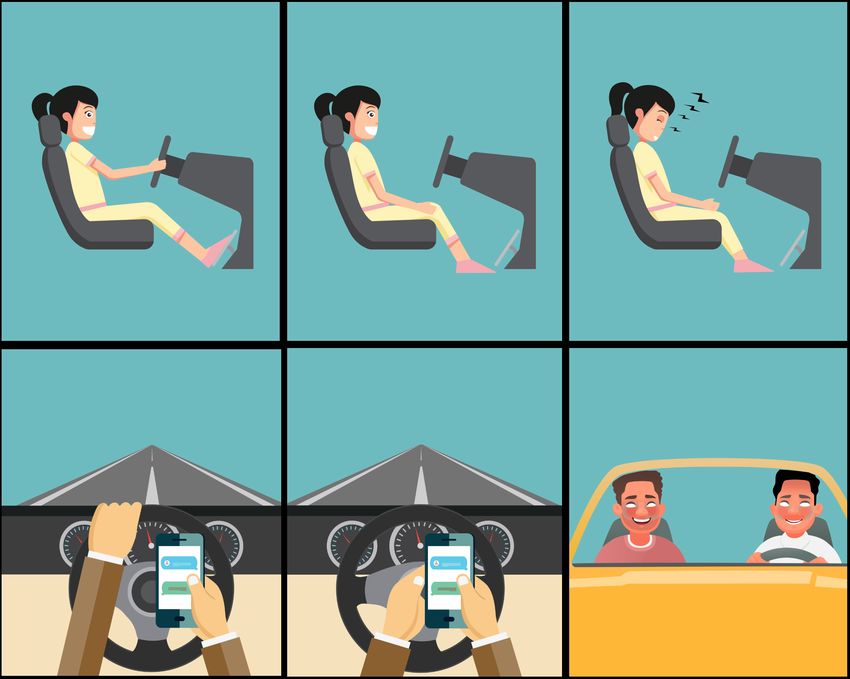
Sensors 2023, 23, 818                                                                                           2 of 15

                        these studies raises several questions regarding the generalization ability of the models. In
                        particular, radar data acquired from multiple persons are commonly split randomly into
                        training and test datasets [4,19,20,22]. As a consequence, data from the same participant
                        can potentially be seen by the model both during training and validation. Taking into
                        account the general ability of radar for biometric authentication [33,34], this technique
                        does not investigate the ability of the model to generalize to new users. Another prob-
                        lem is the limited availability of radar datasets, which is crucial for the reproducibility of
                        reported results.
                             Addressing the aforementioned safety issues including driver distraction or long-term
                        autopilot utilization, we investigate the feasibility of a low-cost UWB radar for driving
                        activity recognition. In particular, we record six activities associated with conventional,
                        autonomous, and distracted driving. Because of safety issues for the driver and passen-
                        gers, as well as currently restricted legal utilization of the autopilots under local law, the
                        study was performed under simulated driving conditions. Using a Convolutional Neural
                        Network (CNN) and a Long Short-Term Memory neural network (LSTM), we evaluate
                        the generalization ability of the network by comparing the prevalent practice of random
                        stratified data splitting versus the more strict leave-one-participant-out cross-validation
                        method. We use Doppler data with a simple interquartile range (IQR) normalization
                        method avoiding extensive pre-processing steps (which might heavily depend on the used
                        radar system [35]). This ensures the real-time application capability of the system and
                        enhances the transferability of the method between different radar systems. Finally, in
                        contrast to prior work on the topic, we provide access to the dataset acquired in this study
                        in order to encourage comparison and enable the reproducibility of results. While several
                        radar datasets in HAR and the healthcare domain are available [36–38], to the best of our
                        knowledge, so far, there are no public datasets available that contain radar data of driving
                        activities. To summarize, our work introduces the following main contributions:
                        •    We introduce a novel method for normal, autonomous, and distracted driving activity
                             recognition using an ultra-wideband radar and Deep Neural Networks.
                        •    We evaluate the generalization ability of radar-based driving activity recognition to
                             persons not seen in the training data.
                        •    We show that applying an IQR normalization method significantly improves the
                             generalization ability of the neural networks for previously unseen persons.
                        •    We introduce RaDA, the first UWB radar dataset for driving activity classification, and
                             make it publicly available to facilitate the comparison and benchmarking of methods
                             in the field.

                        2. Related Work
                        2.1. Radar and Driver Recognition
                              A wide range of radar types can be found in the field of HAR [15]. The most commonly
                        used types can be divided into two families: Continuous-Wave (CW) and Pulse radars.
                        Because an extensive overview of radar systems is not in the scope of this work, we focus
                        only on the systems that were used in this work and related studies.
                              Continuous-wave radars continuously transmit radio energy at high frequencies, and
                        the radar echo is received and processed continuously as well. Frequency-Modulated
                        Continuous-Wave (FMCW) radars belong to the CW group and transmit a frequency-
                        modulated electromagnetic wave and capture its scattering from the targets. Based on the
                        properties of the captured scattering, the distance, velocity, size, and orientation of the
                        targets can be calculated [39]. In contrast to CW radars, pulsed radars transmit for a short
                        time followed by a long pause while the radar is in receive mode. Ultra-wideband (UWB)
                        is a family of pulsed radars that transmit low-powered pulses over a wide spectrum [16]
                        allowing them to have a higher range resolution resulting in more fine-graded information
                        about the target [40]. UWB radars are able to resolve the conflict between Doppler and
                        range resolution while capturing the Doppler information of each scattering center of the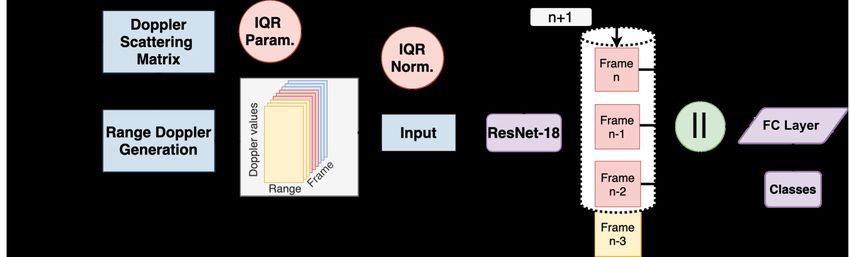
Sensors 2023, 23, 818                                                                                            3 of 15

                        human body [15]. Moreover, they are robust to multi-path distortion [41] and have a low
                        energy consumption.
                              Despite the rising interest in radar in the context of in-cabin driver monitoring, the
                        existing work comprises only very few publications. The potential of pulse ultra-wideband
                        radar for in-cabin driver health monitoring and smartphone utilization was demonstrated
                        in a study by Leem et al. [30]. The authors provided a detailed description of pre-processing
                        and reconstruction of the leaking breathing pattern under different driving activities.
                        They also introduced an algorithm to detect drivers’ smartphone usage, pointing at radar
                        technology as a potential technique for preventing car crashes. Similarly, Ding et al. used
                        an FMCW radar for the detection of inattentive driver behavior [32]. The authors run
                        a series of experiments in a real car environment, where the drivers performed seven
                        different activities including head flexion, rotation, and shaking, as well as body movement,
                        sleepy behavior, and picking up a smartphone. Using range–Doppler maps, they extracted
                        a new activity representation called a dynamic-Doppler trajectory (DRDT) map. Then,
                        the associated activities from the DRDT range of interest, Doppler energy change, and
                        dispersion features were extracted and used to build machine learning algorithms. Using
                        decision trees, SVM, KNN and ensemble classifiers, the highest average accuracy they
                        achieved for the task of in-cabin activity classification was 95%. It is important to note that
                        the recorded activities primarily considered head motions, flexion, and rotation.

                        2.2. Radar and Deep Learning
                              The research on HAR demonstrated outstanding results and multiple advantages of
                        DL techniques for the classification of radar data. In particular, previous studies showed
                        that radar echo data can be treated both as an image in the form of a spectrogram or as time
                        series of the intensity values [15].
                              Using a pre-trained and fine-tuned ResNet-18 and simulated micro-Doppler spec-
                        trograms, Du et al. [42] achieved an average accuracy of 97.92% for six classes including
                        walking, boxing, crawling, jumping, and standing. Shao et al. [20] recorded six participants
                        performing similar actions as in the aforementioned work using a UWB radar. Creating
                        a simple CNN model and using only range information for model training, they reached
                        an average accuracy of 95.24% for activity recognition. However, their validation dataset
                        resulted from a random splitting of the data on the level of individual samples and not
                        participants. Using a dataset with 1633 micro-Doppler spectrograms relating to six classes
                        including falling, Taylor et al. [19] evaluated six different machine learning models. They
                        showed that CNN (in combination with PCA) achieved the highest classification accuracy
                        of 95.30%. Finally, Vandersmissen et al. [39] released two datasets containing gesture
                        and event data captured by an FMCW radar along with a video camera. They evaluated
                        five different modifications of LSTM and CNN networks on 2347 and 1505 samples of
                        six different types of gestures and events (entering and leaving the room, sitting down,
                        standing up, clothe, unclothe). They found that a 3D-ResCNN achieved the lowest error
                        rate of 1.67% in the classification performance of events while random splitting and 2.97%
                        when using leave-one-out cross-validation, respectively. In addition, the authors pointed
                        at the existing opportunity for radar and video data fusion for situations where visual
                        information becomes inaccessible or undesirable.
                              Considering radar data as time series with time-varying properties, several authors
                        proposed LSTM-based classification approaches for HAR. Using raw spectrograms of six
                        obtained activities (walking, sitting down, standing up, picking up an object, drinking
                        water, and falling), Taylor et al. [19] reported an average accuracy of 80.48% for Uni-LSTM
                        and 83.53% for Bi-LSTM. Noori et al. [22] classified five activities (lying, sitting on the bed
                        with the legs on the bed, sitting on the bed with the legs on the floor, standing, and walking)
                        obtained from 13 participants using a UWB radar. Using an Enhanced Discriminant analysis
                        with LSTM, they achieved an average classification accuracy of 99.6%. However, after
                        applying the leave-one-out cross-validation strategy, the overall classification performance
                        dropped to 66%. Li et al. [43] investigated a bi-directional LSTM approach for HAR.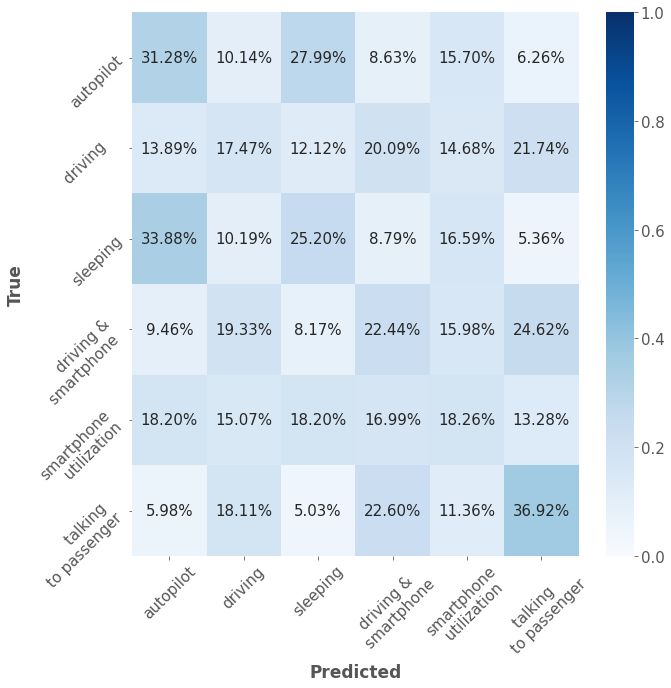
Sensors 2023, 23, 818                                                                                               4 of 15

                        They used six activities (walking, running, jumping, boxing, standing, creeping) from
                        the MOCAP database [44] to build an LSTM model. Their bi-directional LSTM achieved
                        90.3% accuracy. They also evaluated the impact of the sequence length on the classification
                        performance and found a length between 0.6 and 1 second to be sufficient for the optimal
                        classification performance [43].
                             Taking these results together, it can be concluded that both visual and time-varying
                        representations of radar data perform on a very high level in human action recognition tasks.
                        At the same time, only a few works [22,39,45] reported results for random stratified data
                        splitting and cross-validation, where a significant difference was observed. Importantly,
                        the aforementioned studies used classes such as regular walking, crawling, standing up,
                        and sitting down, where each action itself has a unique, clearly distinguishable pattern.

                        3. Proposed Approach
                             As motivated earlier, we use a residual neural network and an LSTM to classify six
                        different driving activities recorded with a UWB radar. The radar hardware automatically
                        outputs the pulse-Doppler data after internally performing the fast Fourier transforms
                        (FFT) on the time domain samples. We then define the elements of the range-Doppler map
                        W as wk, f ∈ R, where w denotes the Doppler pulse for a given range bin k and Doppler
                        frequency f . Range-Doppler maps Wt are generated at each frame measurement t.
                             Based on empirical studies that showed two seconds of distracted behavior are suffi-
                        cient for an increased risk of accidents [9,46], we chose a window size of 1 s. Prior to being
                        processed by deep learning models, the acquired data were cleaned from outliers using the
                        interquartile range (IQR). As outliers, we considered range-Doppler bins with an amplitude
                        exceeding the range: Q3 + 1.5 ∗ IQR, where Q3 is the third quartile (or 75th percentile).
                        Excessive amplitude values are caused by strong reflections from metallic objects, e.g., in
                        parts of the car seats. The values exceeding this range were replaced by the maximum
                        value within this range. We selected the IQR method because it automatically adapts to the
                        scale of data and determines cut-off points which are independent of the specific type of
                        radar (e.g., FMCW, UWB). Importantly, the IQR coefficient was calculated on the training
                        data only and was applied for data normalization in training as well as validation.
                             The architecture of our ResNet-based approach (see Figure 1) was designed with real-
                        time application in mind. We transform the radar data into spectrograms that represent
                        range-Doppler maps. Three of them cover approximately a time span of 1 s (more details in
                        Section 4.1). Each range-Doppler map is processed independently by the same ResNet-18
                        to extract features. The features of the last three frames are kept in a ring buffer. This way,
                        whenever a new frame arrives, only this single frame needs to be processed by ResNet.
                        Then, the features of the three frames are concatenated and classified jointly by a fully-
                        connected layer. Training of this architecture is performed through the use of three parallel
                        ResNet-18 instances that share their weights. This ensures the proper flow of the gradients
                        during training and enables training with random shuffling.

                        Figure 1. Flow diagram of the inference pipeline of the proposed approach. n represents the frame
                        counter. The Doppler data are fed to the ring buffer frame by frame. Three frames, which represent
                        roughly one second, are then concatenated. The concatenated frame data are further forwarded to
                        the fully connected (FC) layer of the network.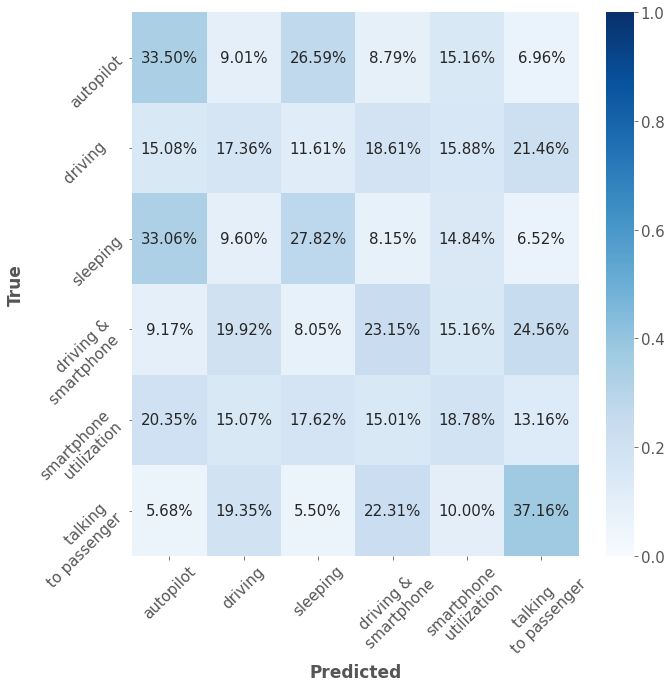
Sensors 2023, 23, 818 5 of 15
4. Experimental Setup and Dataset
In this section, we describe the performed experiments for in-cabin driver activity
classification. We start with the baseline definition based on the re-implementation of the
work of Ding et al. [32]. Then, we investigate the performance of ResNet-18 and an LSTM.
4.1. Radar
We used the ultra-wideband (UWB) radar sensor X4M02 http://laonuri.techyneeti.
com/wp-content/uploads/2019/02/X4M02_DATASHEET.pdf (accessed on 14 November
2022) which can detect and monitor human movements within the operating detection
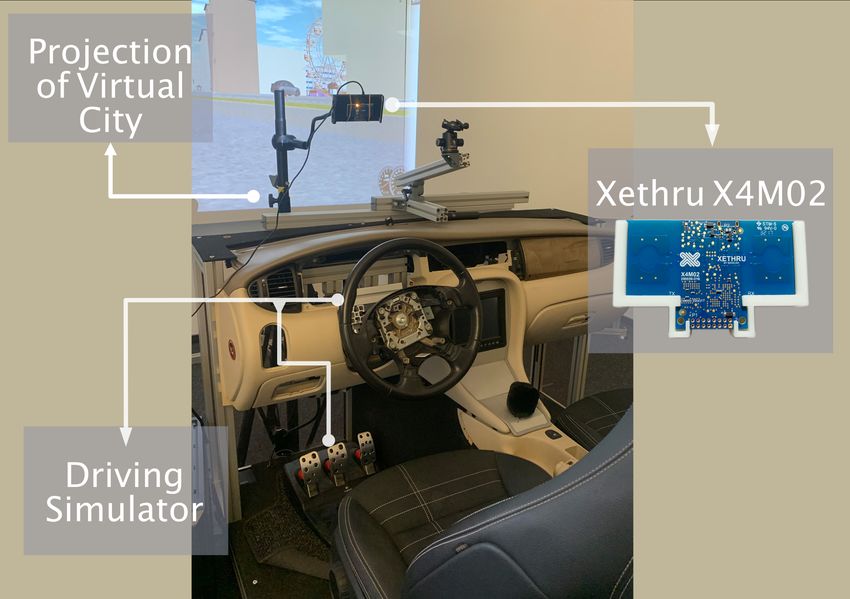
range [25]. Table 1 lists the radar settings used for data recording. The radar placement
was carried out following the empirical evaluations of Thullier et al. [47]. The detection
zone was set to 0.40 to 1.20 m, and the sensor was placed at a height of 60 cm over the
cockpit directed at the center of the driver seat (see Figure 2) to minimize obstacles and
interference. This corresponds to a placement of the radar at the top of the windshield in a
real car.
Table 1. Technical settings of Xethru X4M02 used for data recording.
Parameter Value
Bandwidth (GHz) 7.25–10.20
Frames Per Second 50
Doppler Samples 1024
Doppler Frequency Range (Hz) −8.5–8.5
Range Bins 24
Measurement Range (m) 0.4–1.2
Figure 2. View of the driving simulator recording environment with the UWB Radar Xethru X4M02
in place.
We used the library ModuleConnector https://github.com/novelda/Legacy-SW (ac-
cessed on 14 November 2022) to develop our own script for recording and extraction of
radar data. The radar was sampled with an extended frequency of 50 Hz. Because of the in-
ternal buffering process http://laonuri.techyneeti.com/wp-content/uploads/2019/02/X4
M200_DATASHEET.pdf (accessed on 14 November 2022) of the Xethru radar, the resulting
Doppler data had a frequency of 2.9 Hz. We acquired pulse-Doppler data containing the
pulse magnitudes for all range bins and range values in the measured domain as well as
the Doppler frequencies.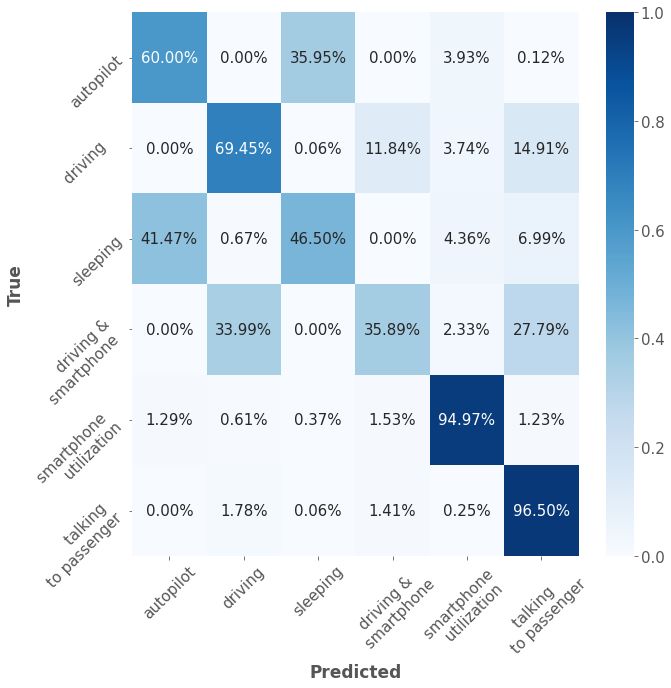
Sensors 2023, 23, 818                                                                                              6 of 15

                        4.2. Driving Simulation Environment
                             The dataset was acquired in a mounted driving simulator which consisted of a Jaguar
                        XJ 4.2 V8 Executive cockpit along with the integrated input controller Logitech G27 Driving
                        Force comprised of a steering wheel, throttle, and brake pedals. To achieve a realistic
                        driving behavior, the highly immersive driving simulation software OpenDS https://
                        opends.dfki.de/ (accessed on 25 July 2021) was used. All driving tasks were performed
                        using an automatic transmission.

                        4.3. RaDA Dataset
                             Ten participants (one female) were asked to perform six activities as introduced in
                        Table 2 and shown in Figure 3. Each participant performed the activities in the same fixed
                        order. Each activity was recorded separately in a continuous manner. The total recording
                        duration for each activity was set to one minute (small deviations exceeding one minute are
                        possible). Thus, the provided dataset includes approximately 60 min of driving activities.
                        Table 3 provides information about the height and weight of participants included in the
                        dataset.

                        Table 2. Overview of the data extracted from RaDA. Each file contains a one-second window from a
                        particular driving action.

                                      No.                           Action                      Nb. of Samples
                                       1                            Driving                           1747
                                       2                           Autopilot                          1844
                                       3                            Sleeping                          1708
                                                             Driving & smartphone
                                       4                                                              1692
                                                                   utilization
                                       5                     Smartphone utilization                   1715
                                       6                      Talking to passenger                    1700
                                   Total size                                                        10,406

                        Figure 3. Overview of six driving activities recorded with UWB radar Xethru X4M02. Top (left to
                        right): Driving, Autopilot, Sleeping. Bottom (left to right): Driving and Smartphone Utilization,
                        Smartphone Utilization, Talking to Passenger. Credits: Adobe Stock.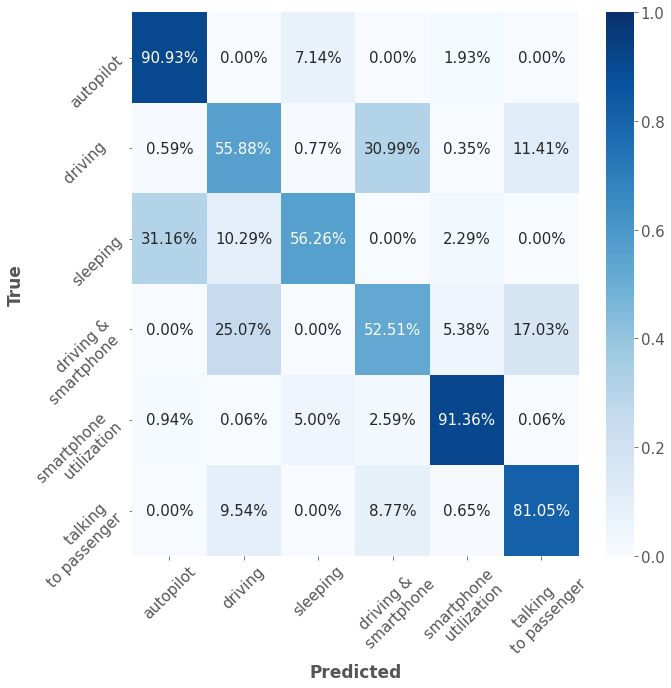
Sensors 2023, 23, 818                                                                                              7 of 15

                                  Table 3. Weight and height of participants in the RaDA dataset.

                                             Participant                      Height (cm)                     Weight (kg)
                                                    1                             188                             85
                                                    2                             169                             50
                                                    3                             178                             64
                                                    4                             180                             93
                                                    5                             178                             90
                                                    6                             167                             74
                                                    7                             172                             55
                                                    8                             179                             77
                                                    9                             170                             63
                                                    10                            164                             59

                                  Action Performance Protocol
                                  1.   Autopilot. While driving with autopilot, participants were instructed to keep their hands
                                       on their knees while sitting in the simulator and observing the virtual environment.
                                  2.   Driving. Participants were asked to drive freely through the virtual city following the
                                       general traffic rules. They were also instructed to turn at least once.
                                  3.   Sleeping. For the sleeping action, participants were asked to take a comfortable position
                                       in the driving chair while keeping their head in ventral flexion, close their eyes and relax.
                                  4.   Smartphone utilization. We used the same instruction as for autopilot, with the addition
                                       to check e-mails or social media using their smartphone with both hands.
                                  5.   Driving and Smartphone utilization. During this action, the participants had to perform
                                       driving while steering the wheel with the left hand and checking e-mails, social media,
                                       etc. using their right hand.
                                  6.   Talking to passenger. A second person was invited as a passenger to take the front
                                       seat. The drivers were instructed to actively communicate with the passenger while
                                       rotating their head toward the passenger and using the right hand for gesticulation if
                                       preferred. At the same time, they had to perform regular driving.
                                        Figure 4 represents the Doppler spectrograms for each class. Figure 3 provides graphi-
                                  cal representations of the six recorded classes. The aforementioned driving activities belong
                                  to three driving behaviors: normal driving (driving), autonomous driving (autopilot), and
ensors 2023, 1, 0                 distracted driving (remaining classes), where the classes sleeping and smartphone utiliza-8 of 16
                                  tion are considered as distracted behavior during autonomous driving. The definition of
                                  distracted driving behavior was in accordance with [48].

                                                                          (a) Autopilot

                                                                           (b) Driving
                                  Figure 4. Cont.
Sensors 2023, 23, 818 8 of 15
(b) Driving
(c) Sleeping
(d) Smartphone utilization
(e) Driving & Smartphone utilization
(f) Talking to passenger
FigureFigure 4. Range-Doppler
4. Range-Doppler spectrograms
spectrograms of six
of six (a–f)
(a–f) in-cabinactivities
in-cabin activities captured
captured by
bythe
theradar.
radar.Three
Three
images within one class represent roughly one
images within one class represent roughly one second. second.
5. Experiments and Results
In this section, we describe the performed experiments for driver behavior recognition
using range-Doppler maps. We report the results using Classification Accuracy (correctly
classified activity windows divided by the total number of activity windows), and the
F1-score for a better comparison (see Table 4). For the deep learning models, we used
the PyTorch library [49], while for the classic machine learning algorithms the scikit-learn
library was used.Sensors 2023, 23, 818 9 of 15
Table 4. Average classification performance for driving activity recognition on the RaDA dataset
using a re-implementation of the Ensemble classifier ([32]), ResNet-18 & LSTM. Bold: best results.
IQR
Architecture Validation Type Accuracy F1-Score
Norm.
Ding et al. [32] 10-fold cross-validation X 0.263 0.261
Ding et al. [32] Cross-validation (Leave-one-out) X 0.252 0.249
ResNet-18 Random splitting (80% / 20%) – 1.0 1.0
ResNet-18 Random splitting (80% / 20%) X 1.0 1.0
ResNet-18 Cross-validation (Leave-one-out) – 0.674 0.640
ResNet-18 Cross-validation (Leave-one-out) X 0.713 0.690
LSTM Cross-validation (Leave-one-out) – 0.439 0.351
LSTM Cross-validation (Leave-one-out) X 0.672 0.590
We ran two different experiments for data splitting and evaluation. In the first experi-
ment, we used random stratified data splitting for the acquired radar data into training
(80%) and test (20%) sets as in studies [4,19,20,22]. This was performed to evaluate the
ability of the architecture to overfit on the radar data of specific persons. In the second
experiment, we performed leave-one-out cross-validation, where the whole data of one
participant were withheld from the training dataset and used for validation only. The
cross-validation was repeated 10 times according to the number of participants. The final
accuracy is reported as an average value of over ten participants. We additionally provide
confusion matrices for the best-performing models (see Figure 5). Importantly, the goal is
not to directly compare the classification performance between ResNet and LSTM. Given
the difference in the model architectures and the way they treat data, there is no way
to provide an honest comparison between them. We rather evaluate the performance of
ResNet-18 and LSTM on the given dataset. To examine the scalability of the systems with
lower computational power, we calculated the inference time of the ResNet-18 on a Geforce
GTX 1080Ti GPU. The resulting inference time was 10.38 ms. The inference for a single
sequence using LSTM on an Intel Core i9-9880H CPU took on average 55.5 ms. Both results
validate the real-time capability of the approach.
(a) Resnet-18 with leave-one-out cross-validation. (b) LSTM with leave-one-out cross-validation.
Figure 5. Confusion matrices of obtained classification results using ResNet-18 and LSTM.
5.1. Baseline Classification
Setting a baseline to compare our method to is challenging due to the very small
number of existing radar-based driver monitoring approaches overall, with none providingSensors 2023, 23, 818 10 of 15
a source code or a dataset for comparison. Nevertheless, in order to define a baseline, we
re-implemented the method proposed by [32] based on the information provided in their
paper. The method uses range-Doppler frames and time-Doppler spectrograms obtained
from the in-cabin driver recording to generate features. Because of hardware differences,
in our implementation, we focused on the features extracted from the range-Doppler
trajectory (RDT), in particular, dynamic Doppler, Doppler range and dynamic power because of
the similarity to our output data. Among the 12 classifiers evaluated by [32], the ensemble
classifier with bagged trees achieved the highest classification accuracy of 93.3% for the
range-Doppler trajectory reported on their dataset. We calculated the features on the level
of single participants using a window size of one second (or three frames) with 2/3 overlap
(see Figure 6). We did not use a high-pass filter of 10 Hz to mask low-frequency activities
and did not manipulate the range of the Doppler as it was proposed in the paper, since
this information could be crucial for distinguishing our classes (e.g., hands on the wheel
while driving vs. autonomous driving). Instead, we used the IQR-range normalization
where values exceeding the 75th percentile were not considered for the Doppler-trajectory
computation. In the next step, following the architecture of the best-performing classifier
and the training steps (see [32]), we built a bagging classifier. The training and testing
datasets were generated in two ways: splitting the data as equally as possible into ten folds
and using nine of them for training, and one for validation, as proposed by [32]. Next,
leave-one-participant-out cross-validation was performed to achieve a possible comparison
to our method. The reported results are the average over the validation splits.
(a) Autopilot (b) Driving (c) Sleeping
(d) Smartphone utilization (e) Driving & Smartphone utilization (f) Talking to passenger
Figure 6. Range-Doppler trajectories of six (a–f) in-cabin activities calculated using the method of [32].
Each trajectory contains a single frame (0.34 s).
Figures 7a,b represent the obtained confusion matrices for the classification perfor-
mance using the ensemble classifier of [32]. Using random stratified data splitting for
training and testing, the model achieved an average classification accuracy of 26.3% over
six classes. The highest classification accuracy of 37.16% was observed for the class talking
to passenger. Autopilot was the second best predicted class with an accuracy of 33.50%. The
classification accuracy for the four remaining classes was between 0.69 and 11.15 percentage
points over the level of random guessing at 16.67%. A slightly lower classification accuracy
but a similar classification pattern was observed after applying leave-one-participant-out
cross-validation. The highest classification accuracy of 36.92% was observed for the class
talking to passenger, which was followed by class smartphone utilization. The remaining
classes were either slightly over or under the level of random guessing. The obtained
performance drastically deviates from the one reported in the original work of [32]. The
low classification performance on the RaDA dataset can be explained in several ways.Sensors 2023, 23, 818 11 of 15
First, fundamental differences exist between our UWB radar and the FMCW radar used
in the original study. Secondly, the higher sampling rate used in [32] could bear a larger
amount of available data for model training. In our work, the minimal size of the window
was constrained by the frame rate of the used radar. Next, the proposed method did
not explicitly consider possible outliers in the data while focusing on the high-frequency
components. Finally, in the original work, their classes considered primarily hand-crafted
features including head position and rotation (that were class-differentiating), while our
data also include scattering information from the torso. Taking these results together, the
proposed method of [32] did not perform well on our data.
(a) Random stratified data splitting. (b) Leave-one-out cross-validation.
Figure 7. Confusion matrices of the obtained classification results using Ensemble classifier ([32]).
5.2. ResNet-18
We trained a standard PyTorch implementation of ResNet-18 with weights pre-trained
on ImageNet-1K. The stochastic gradient descent (SGD) optimizer with a momentum
of 0.9 was used. To decrease the training time, we used the One Cycle Learning Rate
scheduler [50]. This method is based on the phenomena of “super-convergence” which can
be observed when training with the one-cycle learning rate schedule. Furthermore, the
larger possible maximum learning rate can result in an additional increase in classification
performance. The maximum learning rate was set to 0.01. The initial learning rate was
chosen to be one-tenth of the maximum learning rate. We used a mini-batch size of 40
and trained for 20 epochs. A higher number of epochs did not lead to any significant
improvement in classification performance. For the training and validation, the input data
were repeated three times in the channel dimension and resized to 224 × 224 pixels.
5.3. LSTM
We built a uni-directional LSTM model. The number of features in the hidden state
was set to 6, and the number of recurrent layers was 2. The learning rate of 0.001 was used.
To prevent overfitting, a dropout layer with a 20% dropout rate was used. The mini-batch
size was set to 8, and the number of epochs was set to 80. The number of input features
was set to 1024 × 24 corresponding to the Doppler frequency range and bin range. We
used the whole sequence of each action split into single frames (approximately 0.34 s per
frame) for training and validation. Because of slight variations in the length of obtained
recordings, all sequences were cropped to the shortest length of 163 frames (56.21 s) for the
model training and evaluation. Data exceeding this range were neglected.Sensors 2023, 23, 818 12 of 15
6. Results
The classification performance for the ResNet-18 architecture is reported in Table 4. The
perfect average accuracy of 100% over all 6 classes was achieved with random data splitting
both with and without IQR normalization. However, a drop in accuracy of 28.7 percentage
points was observed for the same architecture when using leave-one-out cross-validation.
Without IQR normalization, this decrease was almost 32.6 percentage points. Clearly, the
random splitting leads the model to overfit strongly, which is possibly due to the prevalence
of features specific to individual persons. In contrast, the models show a rather moderate
result when being evaluated using cross-validation. This demonstrates the challenge of
inter-person generalization of systems trained with radar data and also the challenge level
of the driving monitoring application. Therefore, the models with random splitting are not
considered to be the best.
The highest average classification accuracy of 71.3% was obtained for the ResNet-18
model using IQR normalization (see Figure 5a). The class smartphone utilization belongs
to the most well-predicted classes with 91.36% accuracy, which was followed by autopilot
with 90.93% and talking to passenger with 81.05%, respectively. The lowest accuracy values
were observed for the classes driving and smartphone utilization and driving with 52.51% and
55.88%, respectively. Class driving had a high confusion with the class driving and smartphone
utilization, whereas the latter had a high confusion with the classes driving and talking to
passenger. Importantly, all of these three classes shared the same basic driving activity. In
addition, the position of the right hand, as well as the intensity of the smartphone utilization
was moderated by the need to maintain the proper lane and to avoid any collision, which
could additionally impede the class prediction. Similarly, the confusion between the classes
sleeping and autopilot can be explained. In the experimental condition, sleeping was defined
as a specific head flexion for which the depth varied among participants. Taking into
account that in both classes, the subject remained still in the driving chair, we assume that
this confusion rate is due to the definition of the experimental class. The absence of IQR
normalization leads to a decrease in the average classification accuracy to 67.4%.
For the training and evaluation of the LSTM model, we used only the leave-one-
out cross-validation method. The highest average classification accuracy of 67.2% was
observed using IQR normalization. The classes talking to passenger followed by smartphone
utilization achieved the highest classification accuracy (see Figure 5) with 96.50% and 94.97%,
respectively, which were followed by the class driving with 69.54% accuracy. The lowest
classification accuracy was observed for the class driving and smartphone utilization with
35.98%. The confusion pattern between the classes sleeping and autopilot; and driving and
smartphone utilization, talking to passenger and driving resembled those in the ResNet-18
model. The high confusion between the classes driving and smartphone utilization with the
classes driving and driving and talking to passenger can be explained in an analogous manner
as for ResNet-18. Importantly, to estimate a single class, the LSTM model received the
whole one-minute sequence. Therefore, the proposed results are rather for a general model
evaluation and not for a real-time driver monitoring scenario. The absence of the IQR
normalization led to a drop in the classification accuracy to 43.9%. Interestingly, while in the
case of ResNet-18, the use of IQR normalization led to an increase of 3.9 percentage points
in classification accuracy, for the LSTM model, the difference amounted to 23.3 percentage
points.
7. Conclusions
In this work, we presented a novel dataset with driving activities captured by a low-
cost UWB radar. Our proposed driving activity recognition approach has demonstrated
the feasibility of the system to recognize distracted driving behavior. It has also shown a
significant improvement in classification accuracy compared to the state-of-the-art machine
learning method that uses Doppler-trajectory features. Furthermore, we have evaluated
different cross-validation techniques. It was demonstrated that radar-based activity recog-
nition cannot be easily generalized to a new, unseen driver. Finally, we have shown that aSensors 2023, 23, 818 13 of 15
simple normalization technique is able to significantly increase the classification accuracy
of the deep neural networks on new, unseen drivers, especially for the LSTM model.
In the future work, a large-scale evaluation of the proposed approach under varying
driving conditions and a larger number of participants could be performed. It is also
important to investigate ways to reduce the ambiguity between the classes with high
confusion levels, as it is vital for the correct system response in safety-critical driving
scenarios.
Author Contributions: Conceptualization, I.B.; methodology, I.B., M.C.; software, I.B.; validation,
I.B., S.K., M.C.; formal analysis, I.B., S.K., M.C.; resources, D.S.; data curation, I.B.; writing—original
draft preparation, I.B., S.K., M.C., J.R.R.; writing—review and editing, J.R.R., S.K.; visualization, I.B.;
supervision, D.S.; funding acquisition, D.S. All authors have read and agreed to the published version
of the manuscript.
Funding: This research received no external funding.
Institutional Review Board Statement: The study was approved by the internal ethics board of the
German researcher Center for Artificial Intelligence, Kaiserslautern.
Informed Consent Statement: Written informed consent has been obtained from the patient to
publish this paper.
Data Availability Statement: Data and materials are available from the website: http://projects.dfki.
uni-kl.de/rada/ (accessed on 14 November 2022).
Acknowledgments: We would like to thank our participants who took part in the study. We are also
deeply grateful to Robert Syrnicki for his excellent support in the study preparation and data acquisition.
Conflicts of Interest: The authors declare no conflict of interest.
References
1. Joiner, I.A. Chapter 4—Driverless Vehicles: Pick Me Up at the. . . ? In Emerging Library Technologies; Joiner, I.A., Ed.; Chandos
Information Professional Series; Chandos Publishing: Irving, TX, USA, 2018; pp. 69–94. [CrossRef]
2. Brishtel, I.; Schmidt, T.; Vozniak, I.; Rambach, J.R.; Mirbach, B.; Stricker, D. To Drive or to Be Driven? The Impact of Autopilot,
Navigation System, and Printed Maps on Driver’s Cognitive Workload and Spatial Knowledge. ISPRS Int. J. Geo-Inf. 2021,
10, 668. [CrossRef]
3. Gold, C.; Dambock, D.; Lorenz, L.; Bengler, K. “Take over!” How long does it take to get the driver back into the loop? Proc. Hum.
Factors Ergon. Soc. Annu. Meet. 2013, 57, 1938–1942. [CrossRef]
4. Yang, S.; le kernec, J.; Fioranelli, F.; Romain, O. Human Activities Classification in a Complex Space Using Raw Radar Data. In
Proceedings of the 2019 International Radar Conference (RADAR), Toulon, France, 23–27 September 2019; pp. 1–4. [CrossRef]
5. Liang, N.; Yang, J.; Yu, D.; Prakah-Asante, K.; Curry, R.; Blommer, M.; Swaminathan, R.; Pitts, B. Using eye-tracking to investigate
the effects of pre-takeover visual engagement on situation awareness during automated driving. Accid. Anal. Prev. 2021,
157, 106143. [CrossRef]
6. Katrolia, J.; Mirbach, B.; El-Sherif, A.; Feld, H.; Rambach, J.; Stricker, D. Ticam: A time-of-flight in-car cabin monitoring dataset.
In Proceedings of the British Machine Vision Conference (BMVC), London, UK, 22–25 November 2021.
7. Martin, M.; Roitberg, A.; Haurilet, M.; Horne, M.; Reiß, S.; Voit, M.; Stiefelhagen, R. Drive&act: A multi-modal dataset for
fine-grained driver behavior recognition in autonomous vehicles. In Proceedings of the IEEE/CVF International Conference on
Computer Vision, Seoul, Republic of Korea, 27 October–2 November 2019; pp. 2801–2810.
8. Brishtel, I.; Krauß, S.; Schmidt, T.; Rambach, J.R.; Vozniak, I.; Stricker, D. Classification of Manual Versus Autonomous Driving
based on Machine Learning of Eye Movement Patterns. In Proceedings of the 2022 IEEE International Conference on Systems,
Man, and Cybernetics (SMC), Prague, Czech Republic, 9–12 October 2022; pp. 700–705.
9. Victor, T.W.; Tivesten, E.; Gustavsson, P.; Johansson, J.; Sangberg, F.; Aust, M.L. Automation Expectation Mismatch: Incorrect
Prediction Despite Eyes on Threat and Hands on Wheel. Hum. Factors 2018, 60, 1095–1116. [CrossRef]
10. Louw, T.; Merat, N. Are you in the loop? Using gaze dispersion to understand driver visual attention during vehicle automation.
Transp. Res. Part C Emerg. Technol. 2017, 76, 35–50. [CrossRef]
11. Zeeb, K.; Buchner, A.; Schrauf, M. Is take-over time all that matters? The impact of visual-cognitive load on driver take-over
quality after conditionally automated driving. Accid. Anal. Prev. 2016, 92, 230–239. [CrossRef]
12. Cabrall, C.; Eriksson, A.; Dreger, F.; Happee, R.; de Winter, J. How to keep drivers engaged while supervising driving automation?
A literature survey and categorisation of six solution areas. Theor. Issues Ergon. Sci. 2019, 22, 332–365. [CrossRef]
13. Templeton, B. New Tesla Autopilot Statistics Show It’s Almost as Safe Driving with It as without. 2020. Available online:
https://www.forbes.com/sites/bradtempleton/2020/10/28/new-tesla-autopilot-statistics-show-its-almost-as-safe-driving-
with-it-as-without/ (accessed on 14 November 2022).Sensors 2023, 23, 818 14 of 15
14. Volvo Cars. Volvo Cars to Deploy In-Car Cameras and Intervention against Intoxication, Distraction. 2019. Available
online: https://www.media.volvocars.com/global/en-gb/media/pressreleases/250015/volvo-cars-to-deploy-in-car-cameras-
and-intervention-against-intoxication-distraction (accessed on 14 November 2022).
15. Li, X.; He, Y.; Jing, X. A Survey of Deep Learning-Based Human Activity Recognition in Radar. Remote Sens. 2019, 11, 1068.
[CrossRef]
16. Bryan, J.; Kwon, J.; Lee, N.; Kim, Y. Application of ultra-wide band radar for classification of human activities. Radar Sonar Navig.
IET 2012, 6, 172–179. [CrossRef]
17. Bouchard, K.; Maitre, J.; Bertuglia, C.; Gaboury, S. Activity Recognition in Smart Homes using UWB Radars. Procedia Comput. Sci.
2020, 170, 10–17.
18. Zhu, S.; Xu, J.; Guo, H.; Liu, Q.; Wu, S.; Wang, H. Indoor Human Activity Recognition Based on Ambient Radar with Signal
Processing and Machine Learning. In Proceedings of the 2018 IEEE International Conference on Communications (ICC), Kansas
City, MO, USA, 20–24 May 2018; pp. 1–6. [CrossRef]
19. Taylor, W.; Dashtipour, K.; Shah, S.A.; Hussain, A.; Abbasi, Q.H.; Imran, M.A. Radar Sensing for Activity Classification in Elderly
People Exploiting Micro-Doppler Signatures Using Machine Learning. Sensors 2021, 21, 3881. [CrossRef] [PubMed]
20. Shao, Y.; Guo, S.; Sun, L.; Chen, W. Human Motion Classification Based on Range Information with Deep Convolutional Neural
Network. In Proceedings of the 2017 4th International Conference on Information Science and Control Engineering (ICISCE),
Changsha, China, 21–23 July 2017; pp. 1519–1523. [CrossRef]
21. Yang, Y.; Hou, C.; Lang, Y.; Guan, D.; Huang, D.; Xu, J. Open-set human activity recognition based on micro-Doppler signatures.
Pattern Recognit. 2019, 85, 60–69. [CrossRef]
22. Noori, F.M.; Uddin, M.Z.; Torresen, J. Ultra-Wideband Radar-Based Activity Recognition Using Deep Learning. IEEE Access 2021,
9, 138132–138143. [CrossRef]
23. Mercuri, M.; Liu, Y.H.; Lorato, I.; Torfs, T.; Wieringa, F.; Bourdoux, A.; Van Hoof, C. A Direct Phase-Tracking Doppler Radar
Using Wavelet Independent Component Analysis for Non-Contact Respiratory and Heart Rate Monitoring. IEEE Trans. Biomed.
Circuits Syst. 2018, 12, 632–643. [CrossRef]
24. Yarovoy, A.; Ligthart, L.; Matuzas, J.; Levitas, B. UWB radar for human being detection. IEEE Aerosp. Electron. Syst. Mag. 2006,
21, 10–14. [CrossRef]
25. Saeed, U.; Shah, S.; Alotaibi, A.; Althobaiti, T.; Ramzan, N.; Abbasi, Q.; Shah, S. Portable UWB RADAR Sensing System for
Transforming Subtle Chest Movement Into Actionable Micro-Doppler Signatures to Extract Respiratory Rate Exploiting ResNet
Algorithm. IEEE Sensors 2021, 21, 23518–23526. [CrossRef]
26. Erol, B.; Amin, M.; Boashash, B.; Ahmad, F.; Zhang, Y. Wideband radar based fall motion detection for a generic elderly. In
Proceedings of the 2016 50th Asilomar Conference on Signals, Systems and Computers, Pacific Grove, CA, USA, 6–9 November
2016; pp. 1768–1772. [CrossRef]
27. Jokanovic, B.; Amin, M.; Ahmad, F. Radar fall motion detection using deep learning. In Proceedings of the 2016 IEEE Radar
Conference (RadarConf), Philadelphia, PA, USA, 2–6 May 2016; pp. 1–6. [CrossRef]
28. Ramaiah, K. In-Cabin Radar Can Sense Children in Second- and Third-Row Vehicles. Available online: https://www.
electronicproducts.com/in-cabin-radar-can-sense-children-in-second-and-third-row-vehicles/ (accessed on 14 November 2022).
29. InnoSenT. Incabin Radar Monitoring. Available online: https://www.innosent.de/en/automotive/incabin-radar-monitoring/
(accessed on 14 November 2022).
30. Leem, S.; Khan, F.; Cho, S.H. Vital Sign Monitoring and Mobile Phone Usage Detection Using IR-UWB Radar for Intended Use in
Car Crash Prevention. Sensors 2017, 17, 1240. [CrossRef]
31. MOBIS, H. The New Radar-based Occupant Alert System To Keep Your Children Safe. Available online: https://www.
hyundaimotorgroup.com/story/CONT0000000000002988 (accessed on 14 November 2022).
32. Ding, C.; Chae, R.; Wang, J.; Zhang, L.; Hong, H.; Zhu, X.; Li, C. Inattentive Driving Behavior Detection Based on Portable FMCW
Radar. IEEE Trans. Microw. Theory Tech. 2019, 67, 4031–4041. [CrossRef]
33. Sakamoto, T. Personal Identification Using Ultrawideband Radar Measurement of Walking and Sitting Motions and a Convolu-
tional Neural Network. arXiv 2020, arXiv:2008.02182.
34. Li, J.; Zeng, Z.; Sun, J.; Liu, F. Through-Wall Detection of Human Being’s Movement by UWB Radar. IEEE Geosci. Remote. Sens.
Lett. 2012, 9, 1079–1083. [CrossRef]
35. Congzhang, D.; Jia, Y.; Cui, G.; Chen, C.; Zhong, X.; Guo, Y. Continuous Human Activity Recognition through Parallelism LSTM
with Multi-Frequency Spectrograms. Remote Sens. 2021, 13, 4264. [CrossRef]
36. Ahmed, S.; Wang, D.; Park, J.; Cho, S.H. UWB-gestures, a public dataset of dynamic hand gestures acquired using impulse radar
sensors. Sci. Data 2021, 8, 102. [CrossRef] [PubMed]
37. Fioranelli, D.F.; Shah, D.S.A.; Li1, H.; Shrestha, A.; Yang, D.S.; Kernec, D.J.L. Radar sensing for healthcare. Electron. Lett. 2019,
55, 1022–1024. [CrossRef]
38. Bocus, M.J.; Li, W.; Vishwakarma, S.; Kou, R.; Tang, C.; Woodbridge, K.; Craddock, I.; McConville, R.; Santos-Rodriguez, R.;
Chetty, K.; et al. OPERAnet, a multimodal activity recognition dataset acquired from radio frequency and vision-based sensors.
Sci. Data 2022, 9, 474. [CrossRef] [PubMed]
39. Vandersmissen, B.; Knudde, N.; Jalalvand, A.; Couckuyt, I.; Dhaene, T.; De Neve, W. Indoor human activity recognition using
high-dimensional sensors and deep neural networks. Neural Comput. Appl. 2020, 32, 12295–12309. [CrossRef]Sensors 2023, 23, 818 15 of 15
40. Fontana, R. Recent system applications of short-pulse ultra-wideband (UWB) technology. IEEE Trans. Microw. Theory Tech. 2004,
52, 2087–2104. [CrossRef]
41. Zhang, C.; Kuhn, M.; Merkl, B.; Fathy, A.; Mahfouz, M. Accurate UWB indoor localization system utilizing time difference of
arrival approach. In Proceedings of the 2006 IEEE Radio and Wireless Symposium, San Diego, CA, USA, 17–19 January 2006;
pp. 515–518. [CrossRef]
42. Du, H.; He, Y.; Jin, T. Transfer Learning for Human Activities Classification Using Micro-Doppler Spectrograms. In Proceedings
of the 2018 IEEE International Conference on Computational Electromagnetics (ICCEM), Chengdu, China, 26–28 March 2018.
[CrossRef]
43. Li, X.; He, Y.; Yang, Y.; Hong, Y.; Jing, X. LSTM based Human Activity Classification on Radar Range Profile. In Proceedings
of the 2019 IEEE International Conference on Computational Electromagnetics (ICCEM), Shanghai, China, 20–22 March 2019;
pp. 1–2. [CrossRef]
44. University, C.M. CMU Graphics Lab Motion Capture Database. Available online: http://mocap.cs.cmu.edu/ (accessed on 14
November 2022).
45. Shrestha, A.; Li, H.; le kernec, J.; Fioranelli, F. Continuous human activity classification from FMCW radar with Bi-LSTM networks.
IEEE Sensors J. 2020, 20, 13607–13619. [CrossRef]
46. Liang, Y.; Lee, J.; Yekhshatyan, L. How Dangerous Is Looking Away from the Road? Algorithms Predict Crash Risk from Glance
Patterns in Naturalistic Driving. Hum. Factors 2012, 54, 1104–1116. [CrossRef]
47. Thullier, F.; Maitre, J.; Gaboury, S.; Bouchard, K. A Systematic Evaluation of the XeThru X4 Ultra-Wideband Radar Behavior.
Procedia Comput. Sci. 2022, 198, 148–155. [CrossRef]
48. Regan, M.A.; Hallett, C. Chapter 20—Driver Distraction: Definition, Mechanisms, Effects, and Mitigation. In Handbook of Traffic
Psychology; Porter, B.E., Ed.; Academic Press: San Diego, CA, USA, 2011; pp. 275–286. . [CrossRef]
49. Paszke, A.; Gross, S.; Massa, F.; Lerer, A.; Bradbury, J.; Chanan, G.; Killeen, T.; Lin, Z.; Gimelshein, N.; Antiga, L.; et al. PyTorch:
An Imperative Style, High-Performance Deep Learning Library. Adv. Neural Inf. Process. Syst. 2019, 32, 8026–8037.
50. Smith, L.N.; Topin, N. Super-convergence: Very fast training of neural networks using large learning rates. In Proceedings of the
Artificial Intelligence and Machine Learning for Multi-Domain Operations Applications; Pham, T., Ed.; International Society for Optics
and Photonics: Washington, DC, USA, 2019; Volume 11006, pp. 369–386. [CrossRef]
Disclaimer/Publisher’s Note: The statements, opinions and data contained in all publications are solely those of the individual
author(s) and contributor(s) and not of MDPI and/or the editor(s). MDPI and/or the editor(s) disclaim responsibility for any injury to
people or property resulting from any ideas, methods, instructions or products referred to in the content.You can also read