ELEMENT: D12.3 FRENCH ESTUARY SITE ASSESSMENT
←
→
Page content transcription
If your browser does not render page correctly, please read the page content below

ELEMENT: D12.3
FRENCH ESTUARY SITE
ASSESSMENT

Date of Delivery: 07/28/2021

ELEMENT: D12.3
[FRENCH ESTUARY SITE
ASSESSMENT]

ELEMENT: D12.3
[FRENCH ESTUARY SITE
ASSESSMENT]

ELEMENT: D12.3
[FRENCH ESTUARY SITE
ASSESSMENT]
 This project has received funding from the European Union’s Horizon 2020 research and
 innovation programme under grant agreement number 815180.

Document Details
FIELD DETAIL
 Effective Lifetime Extension in the Marine Environment for Tidal
PROJECT TITLE
 Energy
PROJECT ACRONYM ELEMENT

GRANT AGREEMENT 815180

FUNDING SCHEME Research and Innovation

PROJECT DURATION 36 months, from June 2019 to May 2022

DOCUMENT NUMBER ELEMENT-EU-0023

REPORT TITLE D12.3 French Estuary site assessment
DELIVERABLE ID AND
 D12.3
TYPE
DISSEMINATION LEVEL Public

AUTHOR Florian Castillo (INNOSEA)

DOCUMENT VERSION 2

STATUS Final version
 Maria Ikhennicheu (INNOSEA)/Bruno Borgarino (INNOSEA)
REVIEWED BY Annig Lehnertz (IDETA)
 Gavin McPherson (NOVA)
APPROVED BY Gavin McPherson (NOVA)

Revision History
VERSION STATUS DATE OF ISSUE AUTHORS REVIEWER
1 Draft 07/08/2021 Florian Castillo Maria Ikhennicheu (INNOSEA)
 (INNOSEA) Bruno Borgarino (INNOSEA)
2 Final 07/28/2021 Florian Castillo Maria Ikhennicheu (INNOSEA)
 version (INNOSEA) Annig Lehnertz (IDETA)
 Gavin McPherson (NOVA)

 This project has received funding from the European Union’s Horizon 2020 research and 2
 innovation programme under grant agreement number 815180.
Contents
1. Executive summary ........................................................................................................................ 4
2. Abbreviations ................................................................................................................................. 5
3. Introduction .................................................................................................................................... 6
4. Task Description ............................................................................................................................ 7
4.1. Objectives .................................................................................................................................. 7
4.2. Sub-tasks ................................................................................................................................... 7
5. Methodology ................................................................................................................................... 8
5.1. Site Suitability criteria table ..................................................................................................... 8
 Suitability criteria ............................................................................................................................. 10
 Criteria weight .................................................................................................................................. 12
 Criteria grading system ................................................................................................................... 13
5.2. Evaluation of potential ............................................................................................................ 15
5.3. Socio-economic impact evaluation ........................................................................................ 18
6. Data gathering ............................................................................................................................. 22
7. Stakeholders interview ................................................................................................................ 25
8. Results .......................................................................................................................................... 27
8.1. Sites review ............................................................................................................................. 27
8.2. Sites’ comparison ................................................................................................................... 28
9. Conclusion .................................................................................................................................... 31
10. Appendix .................................................................................................................................. 32
11. References .............................................................................................................................. 37

 This project has received funding from the European Union’s Horizon 2020 research and 3
 innovation programme under grant agreement number 815180.
1. EXECUTIVE SUMMARY
This work was realized to satisfy deliverable D12.3 as part of the work package 12 of the ELEMENT
project (Grant agreement 815180). It aims to assess French estuary and river sites’ potential for
tidal stream energy projects.

To achieve this work a multicriteria analysis was performed, including evaluation of technical
criteria (such as current velocity, potential, and water depth), socio-economic criteria (such as
employment and gross added value created), regulation applicable to France (coastline regulation,
Natura2000), human activities (including fishery or recreational boating) and environmental
parameters (migratory fishes). Two specific methodologies, presented in this study, were applied
to assess the site potential for tidal stream energy projects, and evaluate local benefits (gross
added value and jobs). In addition, stakeholders were interviewed to collect their opinion on the
attractivity of France regarding tidal energy.

This study underlined the lack of information freely available regarding parameters of interest,
particularly for estuaries and rivers. Consequently, some nearshore locations, for which more data
are available, have been included in the study.

Multicriteria analysis showed that most of the potential is concentrated in nearshore locations
such as in the Alderney Race, The Raz-de-Sein or Fromveur Passage. However, it revealed interest
of smaller locations in estuaries and rivers such as the Gironde Estuary and Gulf of Morbihan.
Interviews have identified other locations such as isolated sites (islands) or industrial sites. Some
sites appeared to be less interesting for project development as underlined by some stakeholders
such as Arcachon bay and Adour River. The final grades are 72.4 (Raz de Sein), 71.9 (Paimpol-
Bréhat), 69.4 (Alderney Race), 68.9 (Fromveur passage), 67.3 (Raz-Barfleur), 59.7 (Passage de la
Jument and Pont de Pierre Garonne), 58.2 (Etel river), 46.9 (Adour) and 42.3 (Arcachon Bay).

 This project has received funding from the European Union’s Horizon 2020 research and 4
 innovation programme under grant agreement number 815180.
2. ABBREVIATIONS
GVA Gross Value Added
ORE Offshore Renewables
RCFS Réserve de Chasse et de Faune Sauvage (Hunt and wildlife reserve)
R&D Research and Development
SEA Social Economic Account
 Service Hydrographique et Océanographique de la Marine (French Naval
SHOM
 Hydrographic and Oceanographic Department)
SME Small and Medium Enterprises
UXO UneXploded Ordonance
 Zone Naturelle d’Intérêt Ecologique, Faunistique et Floristique (Natural
ZNIEFF
 zone of ecological interest, fauna and flora)

 This project has received funding from the European Union’s Horizon 2020 research and 5
 innovation programme under grant agreement number 815180.
3. INTRODUCTION
A Funding Grant was awarded from the European Union’s Horizon 2020 research and innovation
program to develop and validate an innovative tidal turbine control system, using the tidal turbine
itself as a sensor, to deliver a step change improvement in the performance. This will demonstrate
Effective Lifetime Extension in the Marine Environment for Tidal Energy (ELEMENT), driving the EU
tidal energy sector to commercial reality. This was in response to the call LC-SC3-RES-11-2018:
Developing solutions to reduce the cost and increase performance of renewable technologies.

This document relates to design work undertaken as part of work package (WP) 12 focusing on
socioeconomic impact assessment and is submitted to satisfy deliverable D12.3 of the ELEMENT
project. WP12 is more particularly focused on the analysis of the socio-economic regional impact
of tidal energy. A first task aims at performing a case study on socio-economic impact of a tidal
energy project on the local and regional economy around Étel (D12.2). A second part aims at
assessing French estuaries and run of river sites, which is the purpose of this document (D12.3).
Eventually a task is focused on assessing the potential impact of tidal energy on the wider
European economy (D12.4).

Site characterization is a key point of project development to assess theoretical energy generation
potential and also environmental, social and economic impacts. Developing multicriteria analyses,
considering technical, socio-economic and environmental parameters, could help stakeholders to
select a suitable zone for tidal energy project. This document summarizes such a methodology,
which has been applied to 10 sites in the ELEMENT project.

This document is structured as follows:
 • Section 4 summarizing task description
 • Section 5 presenting the applied methodology
 • Section 6 listing the data gathering process
 • Section 7 summarizing interviews performed with some tidal energy stakeholders
 • Section 8 presenting results
 • Section 9 drawing conclusions
 • Section 10 Annex: maps of target sites

References used within this report are identified using [#] and listed in section 11.

 This project has received funding from the European Union’s Horizon 2020 research and 6
 innovation programme under grant agreement number 815180.
4. TASK DESCRIPTION

4.1. Objectives
The objective of task T12.3 was initially to undertake a mapping of estuaries/river sites in France,
as described in D1.1 (Grant agreement) that may be suitable for tidal energy deployment. A pre-
screening was realized, focusing on both major estuaries (Garonne, Loire, Seine, Rhône) and
smaller ones (Étel river, Adour, Abers regions in Brittany, Somme, Pertuis Charentais, etc.). It
quickly became apparent that appropriate public data were missing for many of these sites. It was
therefore decided with partners to expand the scope of work to include also nearshore locations
(Alderney Race, Fromveur Passage, etc.) to have a larger overview of French potential. Estuaries
correspond to areas where rivers meet the sea, composed of brackish water (a mixture of fresh
and salty seawater). Tidal currents influence the flow pattern of estuaries. Nearshore locations
correspond here to open sea sites.

4.2. Sub-tasks
Task 12.3 is divided into three tasks presented in this section.

Task 12.3.1 Suitability criteria
In this subtask a multicriteria analysis matrix was developed to assess the suitability of a site for
tidal stream energy implementation, based on various criteria. These criteria cover different
aspects such as technical, socio-economical and environmental factors. These are presented in
section 5.1.

Task 12.3.2 Data gathering, formatting and analysis
In this subtask the data needed to perform the analysis defined within subtask 12.3.1 was
collected, based on data freely available, as a typical use case. Indeed, we consider that at the site
screening phase, a tidal energy project developer has not yet the finance to acquire high-resolution
site-specific data. In addition, this data was formatted to extract value of interest and analyzed to
attribute a grade to the site and assess accuracy of the data. Relevant stakeholders were also
interviewed to confirm findings from the multicriteria analysis.

Task 12.3.3 Potential for local content
This subtask focused on the criterion “potential local content”. Within this subtask, a methodology
was developed to assess potential benefits of a tidal project at a national level in terms of job
creation and Gross Value Added (GVA), which is an economic indicator evaluating net output of
goods and services produced (mathematically corresponding to the difference between gross
output and intermediate consumption).

 This project has received funding from the European Union’s Horizon 2020 research and 7
 innovation programme under grant agreement number 815180.

5. METHODOLOGY
To identify suitable areas for a tidal energy project, this study focused on various categories of
parameters: technical criteria (current speed, depth, etc.), socio-economic criteria (employment
creation, GVA, supply chain, etc), regulation applicable to France, covering environmental criteria,
human activities and ecological diagnostics. More details are given on these parameters in section
5.1. Collected data come from public sources only or are freely given by public collectives, industrial
partners or companies. Details on data sources are given in section 6.

5.1. Site Suitability criteria table
Site selection
To identify locations suitable for tidal energy deployment in Metropolitan France, various sources
were used. First, a pre-screening analysis based on depth and minimal current velocity was
performed. Based on initial discussions with Nova, the threshold was set to a maximal sea surface
current velocity of 2m/s for a mean spring tide. In addition, a 3m minimum depth was used.
Industrials and the French “Syndicat des Energies Renouvelables” plan that the minimal current
velocity required for tidal turbines installation will be a maximum current velocity of 1.5 m/s at sea
surface for a mean spring tide [1]. This value of 1.5 m/s was then considered, in order to increase
the diversity of locations considered during this study.

For nearshore locations, maximal current velocity was obtained from Service Hydrographique et
océanographique de la Marine (SHOM) data [2]. The SHOM, is a French public establishment of
an administrative nature which provides a public service in hydrography and maritime cartography.
These data give maximal current velocity at the surface for a mean spring tide. For smaller
locations not covered by SHOM models, or where resolution is not high enough to capture local
flow acceleration, the maximum current velocity was obtained using scientific publications. This
approach is a limitation of the method, as only the most powerful locations and sites for which
current speed has already been assessed are available for consideration.

Water depth was estimated based on data from SHOM and nautical charts from Navionics [3].

This pre-screening analysis allowed to identify the following locations Table 5.1-1.

 Type of site (nearshore,
 Site Ocean/Sea/Estuary/River Département1
 river/estuary)
 Royan Estuary Gironde Gironde
 Saint-Estèphe Estuary Gironde Gironde
 Saint-Nazaire Estuary Loire Loire-Atlantique
 Paimboeuf Estuary Loire Loire-Atlantique
 Honfleur Estuary Seine Calvados
 Tancarville Estuary Seine Seine-Maritime
 Lyon River Rhône Rhône
 Ria d’Etel Estuary (Aber) Etel Morbihan
 Fromveur Passage Nearshore Atlantique Finistère
 Aber Wrac’h Estuary (Aber) Wrac’h Finistère
 Aber Ildut Estuary (Aber) Ildut Finistère
 Aber d’Elorn Estuary (Aber) Elorn Finistère
 La roche Jagu Estuary (Aber) Trieux Côtes d’Armor
 Rance Estuary (Aber) Rance Côtes d’Armor
 Alderney Race (Raz-
 Nearshore British Channel Manche
 Blanchard)
 Raz-barfleur Nearshore British Channel Manche

1 French administrative division

 This project has received funding from the European Union’s Horizon 2020 research and 8
 innovation programme under grant agreement number 815180.

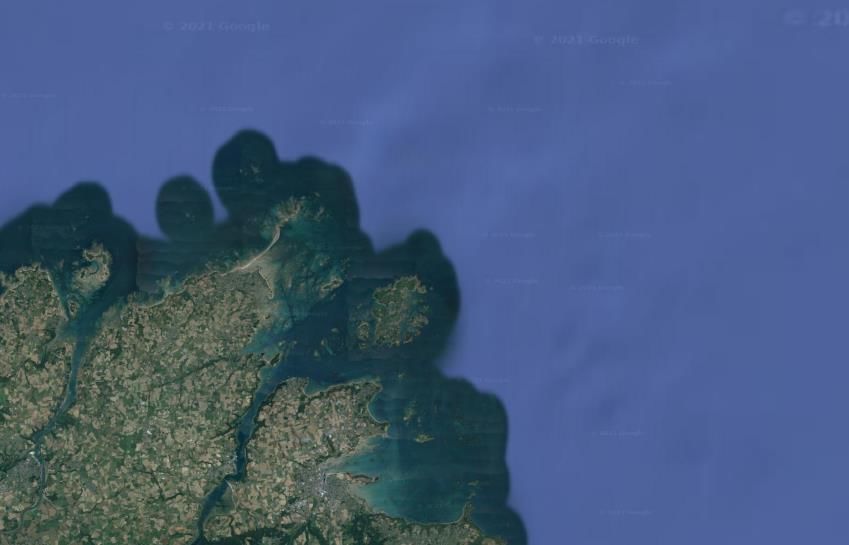
Type of site (nearshore,
 Site Ocean/Sea/Estuary/River Département1
 river/estuary)
Pertuis de Maumusson Estuary (Aber) Seudre Charente-Maritime
 Pont de Pierre
 Estuary Garonne (Gironde) Gironde
 (Bordeaux)
 Adour (Bayonne) Estuary Adour Pyrénées-Atlantiques
 Paimpol-Bréhat Nearshore British Channel Côtes d’Armor
 Raz-de-Sein Nearshore Atlantique Finistère
Passage de la Jument Estuary (Gulf) Golfe du Morbihan Morbihan
 Arcachon Bay Estuary Bassin d’Arcachon Gironde
 Table 5.1-1 Sites considered during pre-screening phase

To reduce this list to a shortlist of 10 locations, the availability of the most critical data was
assessed for each location. Several sites were not considered due to lack of data. Some of the
sites for which the current speed has never been assessed may be missed opportunities or simply
sites that are not suitable for tidal energy.

Eventually, the following 10 locations from pre-screening analysis were chosen for the full analysis.
A picture of each site obtained using Google Earth [4] is available in appendix.

 Ocean/Sea/Estuary/River
 Site Type of site (nearshore, river/estuary) Index
 (département2)
 Ria d’Etel Estuary (Aber) Etel (Morbihan) 1
 Fromveur Passage Nearshore Atlantique (Finistère) 2
 Alderney Race (Raz-
 Nearshore British Channel (La Manche) 3
 Blanchard)
 Raz-Barfleur Nearshore British Channel (La Manche) 4
 Pont de Pierre Estuary La Garonne (Gironde) 5
 L’Adour (Pyrénées-
 Adour Estuary 6
 Atlantiques)
 British Channel (Côtes
 Paimpol-Bréhat Nearshore 7
 d’Armor)
 Raz-de-Sein Nearshore Atlantique (Finistère) 8
 Golfe du Morbihan
Passage de la Jument Estuary (Gulf) 9
 (Morbihan)
 Arcachon Bay Estuary Bassin d’Arcachon (Gironde) 10
 Table 5.1-2 10 Sites considered for the study

2 French administrative division

 This project has received funding from the European Union’s Horizon 2020 research and 9
 innovation programme under grant agreement number 815180.

3 4

 7
 2

 8 9 1

 5
 10

 6

 Figure 5.1.1 10 Sites selected for the analysis

Suitability criteria
Once the 10 sites were chosen, they were graded based on a specific criteria system. Those criteria
are detailed below.

Table 5.1-3 summarizes the different criteria used to perform the site assessment and gives a
description of each.

 Technical criteria Description
 Maximal sea surface current velocity at mean spring tide
 High speed current
 (coef.95 - see section 5.2)
 Technical potential (MW) calculated following methodology
 Technical potential (MW installed)
 described in section 5.2
 Turbulence intensity (%) estimated based on site
 Turbulence
 configuration
 Depth Minimum depth for a mean spring tide
 Tidal range Maximum tidal range at the specified location
 Type of soil at the specified location (sand, mud, rocks,
 Soil conditions
 etc.)
 Presence of a navigation route. This criterion is tricky to
 assess, impact being different depending on conditions
 Navigation area (high water depth, fixed bottom tidal turbines or floating
 ones). But as discussed later, cross-conditionality is not
 considered.
 Servitude (vicinity of gas pipeline, etc.) Distance to a servitude such as gas pipeline or power cable
 Accessibility Evaluation of site accessibility by road or boat
 Access to electrical connection
 Distance to a connection point (without power restriction)
 (distribution network)

 This project has received funding from the European Union’s Horizon 2020 research and 10
 innovation programme under grant agreement number 815180.
Socio-economic criteria Description
 Local content Project Economic impact (jobs created and GVA3)
 Regional strategy for offshore Regional help to support offshore renewables (R&D4
 renewables projects, subsidies, etc.)
 Existing companies with capacities for offshore renewables
 Active SME5: start-ups in the sector
 in the region
 Other offshore renewables activities or projects close to the
 Possible synergies with current
 studied location. “Possible synergies” means potential cost
 offshore renewable activities
 reductions by sharing infrastructures, workers, etc.
 Presence of academic stakeholders in the region of the
 Relevant academic stakeholders studied location. They could create synergies with industrial
 partners, develop R&D projects, revenues, etc.
 Regulation applicable to France Description
 Special European protection areas for fauna and flora that
 Natura 2000
 would require further authorizations before installation
 Protected area (zone of interest for architecture, arts, etc.)
 Listed site that would require further authorizations for tidal farm
 construction
 Special protection areas for fauna and flora that would
 ZNIEFF6 I and II (birds) require further authorizations before installation. Type II
 refers to bigger areas, while Type I is more restrictive.
 Coastline regulation aiming at protecting the coastline to
 Loi littoral (coastline regulation)
 avoid erosion and coastal flooding.
 Special protection areas for animals that would require
 RCFS7
 further authorizations for tidal farm construction
 Human activities Description
 Fishery Evaluation of fishery activities in the studied area
 Port activity Evaluation of port activities in the studied area
 Shipwrecks Presence of shipwrecks in the studied area
 UXO8 Presence of UXO in the studied area
 Tourism - recreational boating Level of recreational boating in the studied area
 Military zone Presence of a military zone in the studied area
 Ecological diagnostics Description
 Migratory fish Presence of migratory fishes in the studied area
 Presence of habitats or inventory zone in the studied area.
 Habitats (mudflats, seabed) & Habitats refer to areas important for fauna and flora
 Inventory zone - roselières, vasières preservation, while inventory zone are areas used to
 assess environmental state of a site
 Table 5.1-3 Suitability criteria used to perform site assessment

Further criteria could have been considered such as “Water usage” (water pumping, hydroelectric
dam), “Existing infrastructure on site” (floating platform, export cable) or “Relevant local supply
chain”. These criteria, initially listed in D12.1, appeared to be not relevant (no water usage on
nearshore locations) and were therefore disregarded. In addition, some criteria appear to be not
discriminating (i.e all sites had the same grade because they are equivalent or because data are
not sufficiently accurate to discriminate) and were disregarded, such as “Sediment and suspended
objects”. These changes have led to a refinement of the categories initially stated in D12.1.

3 GVA: Gross value added
4 R&D: Research and Development
5 SME: Small and Medium Enterprise. Only SME were considered because they represent most of companies

involved in this sector today.
6 ZNIEFF : Zone naturelle d’intérêt écologique, faunistique et floristique (Natural zone of ecological interest,

fauna and flora)
7 RCFS: Réserve de Chasse et de Faune Sauvage (Hunt and wildlife reserve)
8 UXO: UneXploded Ordnance

 This project has received funding from the European Union’s Horizon 2020 research and 11
 innovation programme under grant agreement number 815180.
Criteria weight
Criteria presented above do not have the same importance regarding project development. To
underline this importance each criterion is weighted. Definition of these weight factors are given
in Table 5.1-4.

 Categories Weight
 Possible exclusion criterion 5
 Primary criteria for site selection 4
 Criterion with impact on project but not a main site selection driver 3
 Criterion that should be considered but does not significantly impact the project 2
 Criterion that can be overlooked 1
 Table 5.1-4 Weight factor system

The weight allocated to a criterion was reviewed with WP12 partners. It must be underlined that
the table does not account for cross-conditionality. For instance, if water depth is low, navigation
area could be an exclusion criterion, but it is covered here. A percentage is also given,
corresponding to the weight of the final grade.

Table 5.1-5 gives weight factor for each criterion. A grade of 5 has a contribution of 5.1% to the
final grade, 4 of 4.1%, 3 of 3.1%, 2 of 2.1% and 1 of 1%.

 Technical crtieria Weight
 High speed current 5
 Technical/Practical potential (MW installed/Energy Yield GWh) 4
 Turbulence 3
 Depth 5
 Tidal range 3
 Soil conditions 4
 Navigation area 3
 Servitude (vicinity of gas pipeline, etc.) 4
 Accessibility 3
 Access to Enedis electrical connection (distribution network) 4
 Socio-economic criteria Weight
 Local content 5
 Regional strategy for offshore renewables 3
 Active SME:startups in the sector 1
 Possible synergies with current offshore renewable activities 3
 Relevant academic stakeholders 3
 Regulation applicable to France Weight
 Natura 2000 3
 Listed site 4
 ZNIEFF I and II (birds) 4
 Loi littoral (coastline regulation) 4
 RCFS (Hunt and wildlife reserve) 2
 Human activities Weight
 Fishery 3
 Port activity 5
 Ship wrecks 3
 UXO 4
 Tourism - recreational boating 2
 Military zone 5
 Ecological diagnostics Weight
 Migratory fish 3
 Habitats (mudflats, seabed) & Inventory zone - roselières,
 3
 vasières
 Table 5.1-5 Weight factor allocated to criteria

 This project has received funding from the European Union’s Horizon 2020 research and 12
 innovation programme under grant agreement number 815180.
Criteria grading system
For each criterion, a grade is given. It was decided to use a grading system between 1 and 3 for
each criterion. 3 corresponds to the most favorable case while 1 is the worst. A grade of 1
combined with a weight factor of 5 corresponds to a potential exclusion criterion (i.e tidal turbine
cannot be installed at the selected site) and would thus be the least favourable combination. Table
5.1-6 gives the grading system for each criterion as well as a justification.

 Technical crtieria Grading system Justification
 The lowest bound is based on turbines cut-in
 3: ≥ 2.5 m/s 2: 2.5 > ≥ 1.5 m/s 1: < current speed which is generally between 0.5
 High speed current
 1.5m/s and 1 m/s [5] (so maximum current speed
 below this value will not be efficient).
 Technical/Practical Values are chosen to split site between most
 3 ∶ ≥ 500
 potential (MW powerful tidal farms intermediate, and small
 2: 500 > ≥ 5 1: < 5
 installed) ones.
 High probability when rough soil, strong
 3: bathymetry variations, visible boil at sea
 Turbulence 2: surface, irregularities in seashore, medium
 1: ℎ ℎ probability for more protected area with weak
 features, else low probability
 Water depth range are based on turbines
 technologies diameters. Below 5m, only small
 3 ∶ ≥ 10
 Depth turbines can be used (20kW), between 10 and
 2: 10 > ≥ 5 1: < 5
 5m, medium ones (20-100kW), while above
 10m large turbines can be used.
 3 ∶ ≤ 3
 Tidal range 2: 3 ≤ < 10 Arbitrary selected based on industrial criteria
 1: ≥ 10
 3: if smooth rock or other smooth seabed, Smooth soil and rock will simplify mooring
 Soil conditions 2: if rough but stable, 1: if rough or installations while difficulties will increase
 unstable depending on stabilities of rough soil.
 Navigation area 3: if site is out of navigation area, 1: if not /
 3: if no servitude, 2: if servitudes (at a 250m was selected as criterion because it was
 Servitude (vicinity of
 distance >250m), 1: if servitude (at a considered a typical distance for anchor radius
 gas pipeline, etc.)
 distance ≥ 5 1: < 5
 was based on potential criteria
 Strategy is roughly analysed based on local
 3: Well-developed strategy
 Regional strategy for policies, funding, etc. Large strategy is
 2: Existing but incomplete strategy
 offshore renewables assumed for Bretagne and Normandie while
 1: No or limited strategy
 medium is assumed for Nouvelle-Aquitaine
 3: high number of SME dedicated to ORE
 Number of SME dedicated to ORE were
 Active SME:startups 2: medium number of SME dedicated to
 roughly calculated based on INNOSEA
 in the sector ORE
 knowledge and [6] (at a regional level)
 1:low number of SME dedicated to ORE

 This project has received funding from the European Union’s Horizon 2020 research and 13
 innovation programme under grant agreement number 815180.
Synergies are evaluated based on number of
 Possible synergies 3: if synergies are strong
 projects, test sites, etc, at a regional level.
with current offshore 2: if synergies are small
 Strong means diversity of project while small
renewable activities 1:if synergies are impossible
 means few project
 Presence strength is evaluated by number of
 3: strong presence teams working on subject related to ORE.
 Relevant academic
 2: moderate presence Strong presence is assumed for Bretagne and
 stakeholders
 1:weak presence Normandie while moderate is assumed for
 Nouvelle-Aquitaine
Regulation applicable
 Grading system Justification
 to France
 Natura 2000 3: if site is out of zone9, 1: if site is in zone /
 3: if site is out of zone, 2: if equipment in
 Listed site /
 zone, 1: if site is in zone
 3: if site is out of zone, 2: if site is in ZNIEFF ZNIEFF 1 would require further authorization
ZNIEFF I and II (birds)
 II, 1: if site is in ZNIEFF I so presence of ZNIEFF 1 and 2 were split
Loi littoral (coastline
 3: if site is out of zone, 1: if site is in zone /
 regulation)
 RCFS (Hunt and
 3: if site is out of zone, 1: if site is in zone /
 wildlife reserve)
 Human activities Grading system Justification
 Dedicated zone means strong professional
 3: if no fishery, 2: if usual fishery zone, 1: if fishery zone (several professional boats,
 Fishery
 dedicated zone trawling, netting). “Usual” implies recreational
 or few professional (angling)
 3: if nearby port available for tidal project
 activity (
5.2. Evaluation of potential
This section presents the methodology applied to calculate the potential (maximum installed
capacity in MW). Potential annual energy production could not be calculated as it would require
data such as current speed timeseries which were missing.

Potential calculation (MW)
As presented in section 5.1, power production potential is part of the suitability criteria. To compare
locations, a methodology is applied to evaluate the potential. This section presents the
methodology used.

Several potentials could be calculated depending on hypothesis considered. The instantaneous
maximum fluid power [W/m²] is defined by:
 1
 = 3
 2

where, is the seawater density [1025 / 3 ] and U the maximum horizontal component of the
flow velocity [m/s].

The maximum theoretical power exploitable by a tidal turbine is given by:

 1 2
 = 3
 2 4 ,

Where D is the turbine diameter (m) and , the maximum power coefficient (also known as
Betz limit, equal to 16/27). In reality, the power coefficient is below , . A power coefficient
of 0.4 is usually a satisfying value for current tidal technologies deployed [7] and will be used in
this study.

Four virtual tidal turbines were considered (20kW, 50kW, 70kW and 100kW) in the task, and
diameter associated with each turbine was provided by Nova.

To avoid wake losses due to flow disturbance downstream from the tidal turbine, a farm density is
defined. Usually, two numbers are defined, one representing the lateral spacing ( ) between two
turbines and one representing the downstream spacing ( ).

The real exploitable power within a seabed area A is then given by:
 1 2
 = 3 ( )
 2 4

Values for and are respectively set to 3.5 and 11 based on Nova’s recommendation.

This definition of power is the one used in this study. If the real exploitable power is above the
rated power, the value is truncated to rated power to reflect control strategy.

The maximum velocity considered in this study is computed using maximum velocities during mean
spring tides, defined for a coefficient between 93 and 97, following methodology used in [7].
In France, the tide coefficient is defined by:
 ℎ −
 = × 100

where, ℎ is the water depth at high tide, the water depth at the low tide, and U the mean tidal
range at the location.

 This project has received funding from the European Union’s Horizon 2020 research and 15
 innovation programme under grant agreement number 815180.
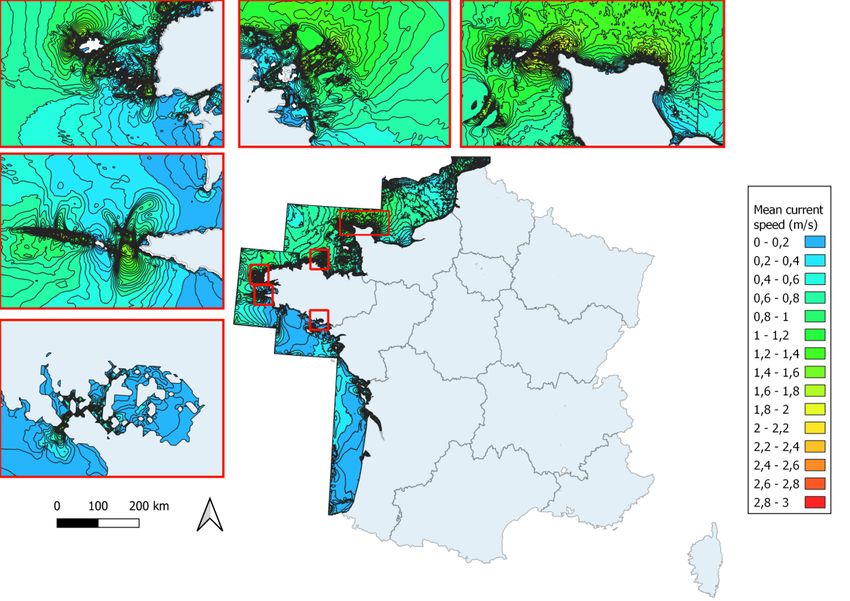
More details on current speeds used for this task are given in section 6. Table 5.2-1 summarizes
parameters used.

 Parameters Value (Unit)
 Power coefficient 0.4 (-)
 Lateral spacing ( ) 3.5 (-)
 Downstream spacing ( ) 11 (-)
 Turbines considered 100-75-50-20 (kW)
 Table 5.2-1 Parameters used for potential estimation

Area
To apply the methodology presented above, the area considered for potential estimation must be
defined. To do so, several technical criteria were listed. The considered areas must fulfill these
criteria.

 1. For each turbine, a criterion on a minimum water depth was set based on technical criteria
 recommended by Nova. The minimum water depth for a 20kW turbine is set to 6.3m, for
 50kW 11m, for 70kW 14m and for a 100kW turbine 19m. A maximum water depth of 50m
 is considered. Beyond that limit, subsea operation become very expensive. It was however
 extended to 60m for Fromveur Passage to reflect real potential of this zone.

 2. Only locations with a current velocity above 1.5 m/s were considered, except for Bayonne.
 The study [8] gives a mean current velocity above 1m/s but below 1.5 m/s for this site.

Eventually, studied areas were geometrically defined to properly calculate the potential. Figure
5.2.1 shows restricted area considered during the study. Red rectangles indicate a studied site (i.e
The Alderney Race, etc). Bordeaux, Bayonne and Etel are not represented. Indeed, areas for
Bayonne and Bordeaux were estimated based on a separate study [8], while no data were available
for Etel. For The Alderney Race, latest maritime boundaries were included, and only French
potential was considered (Channel Islands excluded). Figure 5.2.1 also give current speed
compiled from MARS 2D model [9].

 Figure 5.2.1 Restricted area considered

 This project has received funding from the European Union’s Horizon 2020 research and 16
 innovation programme under grant agreement number 815180.
Figure 5.2.2 summarizes the methodology applied to obtain the potential. A python code was
developed within the project to apply this methodology.

 Zone current
 velocity

 Zone’s
 Tidal turbine Power available
 water
 selection
 depth

 1 3
 , = ² ( )
 2 4
 Figure 5.2.2 Methodology applies to determinate French tidal turbine potential

Results for each site are given in section 8

 This project has received funding from the European Union’s Horizon 2020 research and 17
 innovation programme under grant agreement number 815180.
5.3. Socio-economic impact evaluation

Summary
Different indicators are chosen to evaluate the socio-economic impact of a tidal energy project.
The first is the gross value added (GVA) corresponding to the value of goods and services produced
in a sector of economy. The second is the number of jobs expected to be created by a project.

The number of jobs is decomposed into direct, indirect, and induced jobs. Direct jobs refer to jobs
created within industries directly involved in a project during the different phases. Indirect jobs
come from inter-industry trades while induced jobs reflect employment created by consumer
spending (from salaries). To evaluate the change induced by a project at the national level (for
France), the so-called Input/Output tables [10] and socio-economic accounts (SEA) were used. This
is open-source information, which gives respectively trades between economic sectors and
indicators (employment, capital stocks, etc.). The following sections present the different steps to
achieve these results.

CAPEX and OPEX
The methodology used in this study is based on expenditures. It requires the capital expenditure
(CAPEX) and the operational expenditure (OPEX) of a tidal project. Based on [11] a CAPEX of 7580
€/kW and an OPEX of 505€/kW/year were used. These values were validated with project partners
and correspond to first arrays costs in [11] and will decrease as the sector matures. In addition,
CAPEX and OPEX breakdown were used, to relate tidal turbine project activity to economic sectors,
as explained below. The CAPEX breakdown given in Figure 5.3.1 is used [12].

 Figure 5.3.1 CAPEX breakdown for an early-stage project [12]

No reference for OPEX breakdown was found directly. Categories were decided in consultation with
project partners.

 This project has received funding from the European Union’s Horizon 2020 research and 18
 innovation programme under grant agreement number 815180.
NACE identification
As shown on Figure 5.3.1, the CAPEX breakdown is split between different tidal farm elements.
However, to estimate jobs created and GVA, economic sectors working on these elements must be
identified. For instance, for the tidal turbine generator, the design phase would involve engineering
companies, and the construction phase would involve welders. These companies are then
identified by a code from the Statistical Classification of Economic Activities in the European
Community, commonly referred to as NACE (Nomenclature statistique des Activités économiques
dans la Communauté Européenne). The classification can be found here [13].

During this project, main economic sectors involved in building elements were identified and linked
to their NACE codes. In addition, a part of the CAPEX (or OPEX) has been attributed to each sector.
Figure 5.3.2 shows an example of this process for the tidal generator/platform element.

 Design phase- NACE M71:
 engineering 14
 % CAPEX
 firm: a% 100

 Tidal Construction NACE C25:
 generator/plat phase- 14
 % CAPEX
 form: 14% metallurgic 100
 CAPEX firm: b%

 Construction- NACE F42:
 civil 14
 % CAPEX
 engineering 100
 firm: c%

 Figure 5.3.2 Example of decomposition of farm elements into NACE codes
 (percentages and categories given for example only)

From the CAPEX breakdown (Figure 5.3.1), the following economic sectors were retained in
agreement with project partners.
NACE Code [13] Share (%) Economic sector
 M71 14 Architectural and engineering activities; technical testing and analysis
 C28 28 Manufacture of machinery and equipment n.e.c
 C27 14 Manufacture of electrical equipment
 Manufacture of fabricated metal products, except machinery and
 C25 14
 equipment
 H50 16 Water transport
 F42 5 Civil engineering
 K64 8 Final service activities, except insurance and pension funding
 D35 1 Electricity, gas, steam and air conditioning supply
 Table 5.3-1 CAPEX: economic sectors involved

Regarding OPEX, it was decided with project partners to retain the following categories.

 NACE Code [13] Share (%) Economic sector
 C33 50 Repair and installation of machinery and equipment
 H50 49 Water transport
 D35 1 Electricity, gas, steam and air conditioning supply
 Table 5.3-2 OPEX: economic sectors involved

 This project has received funding from the European Union’s Horizon 2020 research and 19
 innovation programme under grant agreement number 815180.
In this study, the CAPEX is entirely allocated to one year of the project, which would correspond to
the first phase of the project (design, construction and installation), and the same OPEX is used
for each year of the project lifetime (no cost reduction included).

National Share
The two first steps allow to list the different economic sectors (i.e characterized by NACE codes)
involved in the project, and their shares regarding OPEX and CAPEX. In this project, the region of
interest is Metropolitan France. Therefore, a difference must be made between French companies
and international ones. French companies refer to companies based in France and having their
employees in France. Indeed, when developing a project, different companies from the same
economic sector can be involved, and part of them only are French. Hence, only a part of the costs
allocated to a sector would go to French companies. This part is reflected by the national share
applied. Values for these shares were chosen based on Innosea's industrial experience, and results
were compared with other existing evaluations.

An example from wind industry is given here, to illustrate these national shares. Wind turbine
foundations and nacelles construction would both involve companies from sector C25
(Manufacture of fabricated metal products, except machinery and equipment). For the wind farm
of Saint-Nazaire, foundations are built in Belgium, while nacelles are produced in France.
Therefore, the CAPEX share allocated to C25 must be split between French and Belgian companies.

Input/Output Matrices
These steps allow us to obtain for each year and each sector the economic change induced by a
project. Using Input/Output tables, one can obtain gross output (GO) per sector. Introducing SEA
tables to define jobs/GO and GVA/GO coefficients, employment and GVA can be calculated.

Mathematical operations should be realized on the Input/Output table before being used. The
following reference, [14], is one example which introduces the Leontief inverse matrices. These
matrices are mathematically derived from Input/Output matrices and are used to calculate the
economic impact of the project. The difference between type 1 and 2 effects is the inclusion of
householders. Therefore type 1 matrices account for direct and indirect effect, while type 2 also
includes induced effects.

Summary and analysis
This methodology leads to 18 full time equivalent (FTE) direct jobs per MW in phase one (design,
construction and installation), which is above values found for other offshore renewables energies
or in previous studies (3 FTE/MW for tidal energy in [15]). One reason is the hypothesis of the
CAPEX allocation over one single year, while development and construction would require multiple
years. In addition, the OPEX and CAPEX values retained have a strong impact on the results. For
instance, when using alternative values from [11], the number of direct jobs drops to 9.2 FTE/MW
during construction.

During the operation phase, 2.5 FTE per MW (direct and indirect) are found while 0.65 FTE per MW
are given in [15]. Once again, the methodology and values retained, could explain this difference.

Regarding GVA, the analysis gives 6.8 M€/MW (direct + indirect) during construction, and
16 M€/MW including induced effects, while 0.47 M€/MW per year are expected during operation
(1.1 M€/MW including induced effects).

Applying the presented methodology gives results dependent on installed power only. In reality for
a project at a specific location, the technologies deployed, and companies involved would affect
the results.

 This project has received funding from the European Union’s Horizon 2020 research and 20
 innovation programme under grant agreement number 815180.
The aim of the current study being to compare sites by attributing grades, results were considered
consistent and kept for the rest of the analysis. To obtain results for each site, one needs to multiply
these results by the installed capacity. Results for each site are given in section 8.

Figure 5.3.3 summarizes the methodology applied to calculate employments and GVA of a project.

 Total Costs by Link from National share
 Installed
 product Category to of expenditure
 capacity
 category sector by category

 Expenditure Economic
 Total Expenditure
 Expenditure estimated by (incl. Jobs &
 expenditure estimated per
 estimated per sector/ GVA) impact
 estimated per year for
 category industry per per year for
 year France
 year France

 CAPEX National
 (€/MW) and input output
 OPEX matrices
 (€/MW/year)

 Figure 5.3.3 Jobs and GVA assessment methodology

 This project has received funding from the European Union’s Horizon 2020 research and 21
 innovation programme under grant agreement number 815180.
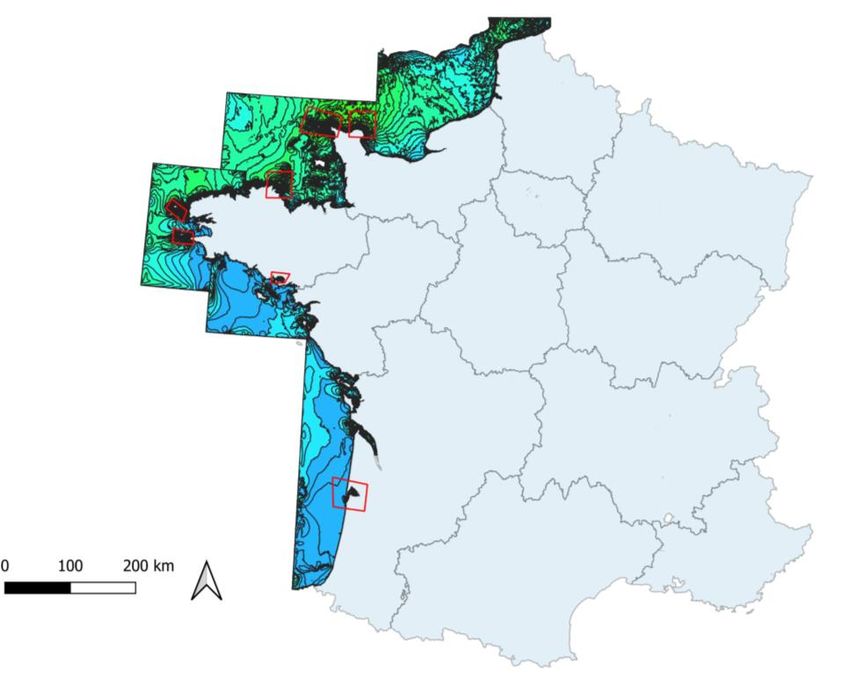
6. DATA GATHERING
This section describes the data sources used and level of accuracy when available.

High speed current
For nearshore locations, such as the Alderney Race or Fromveur passage, maximum surface current
velocity is extracted from SHOM data [16]. Spatial resolution varies from 2 km down to few meters
for some regions [16]. The SHOM underlines that some details are not represented, and some local
currents generated by a local topography are not captured. The last update of this data is 2005.

For Bordeaux and Bayonne, data are not covered by the SHOM. A study gives mean speed velocity
for a mean spring tide [8]. For both locations, the mesh has a cell size of 5m close to regions of
interest. Mean current velocity at Pont de Pierre (Bordeaux) is above 1.5 m/s and mean current
velocity is above 1 m/s at the Adour site (Bayonne). For both locations, maximum velocity was
estimated based on these values. For Bordeaux, the value was compared to other existing sources
[17]. Eventually, for Etel river, a maximum current speed between 2.6 m/s and 4.0 m/s for a
coefficient of 120 is given in [18]. It is reasonable to consider that a maximum current of 2 m/s
will be observed during mean spring tide (coefficient of 93-97). Therefore, 2m/s was kept, and
internal data have been used to validate this value.

To estimate the potential, other data were used for ocean locations such as the Alderney Race or
Fromveur passage. It was decided to use simulations from MARS2D model [19] [9]. MARS2D is a
model developed by IFREMER, to provide predictions for current, water levels, etc. The spatial
resolution of the model used here is 250m and the time resolution is 15 minutes. To follow the
methodology defined in [7], year 2015 was used to extract the current velocity. This year was
selected because it is representative of other years [7]. 37 days have a tidal coefficient between 93
and 97, and the average current velocity over these days was computed for each point of the model.

Figure 6.1 shows the current velocities obtained.

 Figure 6.1 Mean current speed for mean spring tide (coef. 93-97) from Mars 2D [9]

 This project has received funding from the European Union’s Horizon 2020 research and 22
 innovation programme under grant agreement number 815180.
Technical potential
Technical potential was calculated following the methodology established in section 5.2. Current
speeds used to calculate the potential are given above.

Turbulence
Current turbulence intensity is complicated to obtain. Indeed, in-situ data are required to obtain
accurate values. When available, data were used (see below). For other locations, turbulence was
estimated based on bathymetry profile, type of soil, and observation.

For the Alderney Race, different studies exist regarding turbulence intensity. A reference document
[20] was used in this study.

Depth
Water depth is evaluated using data from SHOM [2] and Navionics [3]. Spatial resolution for the
SHOM is 111m [21] . For Bordeaux and Bayonne, data were compared to those used in [8].

Tidal range
Tidal range is evaluated using data from SHOM [2].

Soil conditions
Soil conditions are evaluated using data from SHOM [2]. Spatial resolution is 5 arcminutes [22].
SHOM data gives seabed conditions, which is not sufficient for mooring design, but these data
were used due to lack of more precise data.

Navigation area
Navigation areas are evaluated using data from Navionics [3]. For Bordeaux data were also kindly
provided by the Grand Port Maritime de Bordeaux [23].

Servitude
Servitudes are evaluated using data from SHOM [2] and from Navionics [3].

Accessibility
Accessibility is evaluated using Google Maps, Navionics [3] and SHOM data [2].

Access to Enedis electrical connection
Access to Enedis electrical connection is evaluated using their open data [24]

Natura 2000
Natura 2000 sites are identified using the geoportail [25], a tool developed by IGN [26] and BRGM
[27], two French organizations. Information can also be found on the dedicated website from the
European Environment Agency [28].

Listed site
Listed sites are identified using the geoportail [25], a tool developed by IGN [26] and BRGM [27],
two French organizations.

 This project has received funding from the European Union’s Horizon 2020 research and 23
 innovation programme under grant agreement number 815180.
ZNIEFF I and II
ZNIEFF I and II areas are identified using the geoportail [25], a tool developed by IGN [26] and
BRGM [27], two French organizations.

Loi littoral (coastline regulation)
Coastline regulation is evaluated using the tool published by the Observatoire des Territoires,
which gives cities under regulations [29].

RCFS (Hunt and wildlife reserve)
RCFS areas are identified using the geoportail [25], a tool developed by IGN [26] and BRGM [27],
two French organizations.

Fisheries
Fishing activity was analyzed using various sources. A state of the art of the professional fisheries
is given in [30]. Other studies were also used [31] [8], complemented by online research on each
location.

Port activity
Port activity was measured using various sources (articles [32], [33], scientific papers, port
website, stakeholders’ comments).

Shipwrecks
Areas with shipwrecks are evaluated using data from SHOM [2] and from Navionics [3].

UXO
UXO are evaluated using different criteria. First, a map gives WWII bombings (by Allies) in France
with circle sizes proportional to the number of tons of explosive dropped [34]. In addition, human
activities are used as a key indicator (fishing trawler, existing tidal site). Finally, a literature review
was conducted to check if any UXO has already been found on the location [35], [36].

Tourism – recreational boating
No systematic, quantitative data exist about recreational boating. To evaluate if tourism activity is
high or low, different parameters are evaluated. The number of ports is evaluated using specialized
websites (example for Normandie [37]). In addition, existing studies are used [8], [31].

Military zone
Existing studies are used [8], [31] to evaluate military zones (test sites, ammunition depot). For
locations not covered by these studies, zones are analyzed using Navionics [3].

Migratory fish, habitats, and inventory zones
Presence of migratory fishes, habitats or inventory zone are mainly assessed by information
relative to the PLAGEPOMI (migratory fish protection plan) project [38] from DREAL. Information
are also freely available on special agency websites ( [39], [40], [41], [42]).

 This project has received funding from the European Union’s Horizon 2020 research and 24
 innovation programme under grant agreement number 815180.
7. STAKEHOLDER INTERVIEWS
Interviews were conducted with different tidal energy stakeholders, either academics, industrials
or from administrative services, to draw a conclusion on Metropolitan France tidal energy potential.
They were asked to give their opinion on the attractivity of France regarding tidal energy from
different point of view, such as:
 • Attractivity due to the French potential (i.e. Does France have an important current
 resource?)
 • Development and strength of the supply chain
 • Public supports from administrations and society

Their opinions on retained locations for this study were also sought. This section summarizes the
outcomes from these interviews. The 6 following stakeholders were interviewed (Table ). A total of
14 stakeholders were contacted.

Stakeholders Company/University/Administration Position
Marlène Kiersnowski Énergie de la Lune/SEENEOH Development director at Energie de la Lune
 Assistant professor and researcher at
Grégory Pinon Université du Havre
 Université du Havre
Grégory Germain IFREMER Researcher at IFREMER
 Project manager in MRE at Region Nouvelle-
Guillaume Conan Nouvelle-Aquitaine Region
 Aquitaine
Nicolas Ruiz Guinard Energies CEO at Guinard Energies
Grégory Payne Ecole Centrale de Nantes (ECN) Research Engineer at ECN
 Table 7-1 Stakeholders interviewed

Interviews with the different stakeholders have highlighted that Metropolitan France has a real
potential for tidal energy with the second-best European potential, about 3-5GW [43] after the
United Kingdom (about 9GW [43]) and one of the best in the world. Everyone has underlined a
strong potential in nearshore locations, commonly illustrated by the Alderney Race and the
Fromveur Passage. However, they also agreed, with different enthusiasm, on the potential of tidal
energy in estuary and run of river regions such as the Gironde estuary or for isolated locations
(Molène Island, Chaussée de Sein).

They have also highlighted that France has already developed a strong supply chain, from
developers to manufacturers, that can benefit local communities at different levels, depending on
the region and the project.

Pilot projects, such as Guinard Energies test in the Etel River, tend to demonstrate a good
population acceptance (no legal appeals) regarding this technology, especially when the different
stakeholders are included within the early stages of the project. Particularly, it appears that both
floating and fixed tidal turbines benefit from their small or inexistant visual impact. Additionally,
when water depth is sufficient, bottom fixed tidal turbines are not in the way of navigation.

In addition, interviews have revealed that France benefits from a strong academic fabric, with
several research center and test sites (Seeneoh site at Bordeaux, EDF and Seeneoh site at Paimpol
-Bréhat, Hydrodynamics laboratory of Boulogne-sur-Mer or LHEEA-Ecole Centrale de Nantes for
instance). Some stakeholders have also underlined that, European programs such as H2020 or
Interreg, and regional strategies and support such as from the Normandie region, provide suitable
conditions for tidal energy development.

Several stakeholders also highlighted that some events [44] in the recent years could have
impacted international visibility or attractivity of the sector and reduced national support. For
instance, the lack of feed-in tariff to support the development of the sector or the absence of tidal

 This project has received funding from the European Union’s Horizon 2020 research and 25
 innovation programme under grant agreement number 815180.
energy within the last multiannual energy plan might have reduced the development of tidal
energy. Some stakeholders draw a comparison with the United Kingdom, which has a more
dynamic environment for tidal energy.

Another common comment was the lack of studies to fully characterize tidal energy potential.
Several explanations were listed to explain this lack of data: most developers are currently SMEs,
which cannot deploy means to characterize resources (i.e. developing models with sufficient high
accuracy, validating by in-situ measurements) without financial support or guarantees.
Consequently, at the moment, the focus is only on most powerful locations neglecting other smaller
locations. As a comparison, wind speed data is much easier to obtain, mainly because this data
has several other utilizations (air transport, high rise building, etc.).

Some disparities appeared between opinions, regarding the competitiveness of the different type
of sites (nearshore, estuary, river, isolated location). Some underlined that each type of site can
have a key role in the energetic mix while others think that sites with lower capacity cannot be
competitive except in a few cases. However, everyone agreed on the benefits of tidal energy in
isolated locations.

It is also worth mentioning that most stakeholders highlighted that the tidal sector is mainly in the
R&D phase and costs can significantly change in the next steps.

As a conclusion, all agreed that France is an attractive country for tidal energy and that this energy
source can be part of the French energetic mix, by increasing financial support, R&D projects, and
cooperation between the different stakeholders. In addition, discussions have shown that
opportunities exist in regions for sites that are not yet characterized (rivers, estuaries, isolated
locations). Local utilization (connection to industrial sites, hydrogen production, etc.) is also a great
opportunity giving scope to various types of technologies and sizes.

Finally, ecological benefits are always listed as one of the main advantages of the technology.
Firstly, it can replace fossil fuel generation in isolated locations, helping to decrease greenhouse
gas emissions. Secondly, cohabitation between power production and river continuity can be
improved with tidal turbines which do not require fish ladders. Thirdly, recent studies conclude that
collision risk between mammals and birds and tidal turbines is low [45].

 This project has received funding from the European Union’s Horizon 2020 research and 26
 innovation programme under grant agreement number 815180.
8. RESULTS
This section presents results. Grades for each site can be found in the ELEMENT-EU-
0023_Attachment spreadsheet.

8.1. Site review
The 10 sites retained for the analysis are listed in Figure 5.1.1 and Table 5.1-2. Among these sites,
some are known for being locations with high current resource (Alderney Race, Raz-Barfleur,
Fromveur Passage) and some are known for being test sites (Pont de Pierre-Bordeaux, Etel river,
Paimpol-Bréhat). A prototype of tidal turbine was also installed at Bayonne close to the Adour site
[46] and two tidal turbines should soon be installed at the Passage de la Jument [47].

Sites’ potential
The following potential have been calculated. Potentials with bold font are those found using
methodology described in section 5.2 using Mars2D data. For Bordeaux and Bayonne, the same
methodology is applied based on area and current speed given in [8]. For Etel, data was not
available. In order to attribute a grade, only a range is required for the study, it was thus considered
that potential would be below 5MW. This potential was validated by project partner CHBS.

 Grade attributed
 Site Potential (MW)
 Ria d’Etel ≤5 1
 Fromveur passage 282 2
 Alderney Race (Raz- 3
 1830
 Blanchard)
 Raz-Barfleur 1057 3
 Pont de Pierre ≤5 1
 Adour ≤ 0.5 1
 Paimpol-Bréhat 246 2
 Raz-de-Sein 266 2
 Passage de la Jument 6.1 2
 Arcachon Bay 2.3 1
 Table 8.1-1 Potential (MW) for each site

Sites’ socio-economic impact
 Site Direct jobs Indirect and induced jobs Direct GVA (m€)
 Construction Operation Construction Construction
 Operation phase Operation phase
 phase phase phase phase
 Ria d’Etel 94 5 219 16 8 0.5
 Passage du
 Fromveur
 5308 282 12376 925 464 29
 Raz-Blanchard
(Alderney Race)
 34443 1,832 80320 6000 3012 189
 Raz-Barfleur 19893 1058 46393 3466 1739 109
 Pont de Pierre 94 5 219 16 8 0.5
 Adour 9.4 0.5 22 1.6 1 0.05
Paimpol-Bréhat 4630 246 10797 807 405 25
 Raz-de-Sein 5006 266 11675 872 438 28
 Passage de la
 Jument
 115 6.1 268 20 10 1
 Arcachon Bay 43 2.3 101 7.5 4 0.2
 Table 8.1-2 Potential local content (jobs and GVA) for each site

 This project has received funding from the European Union’s Horizon 2020 research and 27
 innovation programme under grant agreement number 815180.
You can also read