Dried grape Strategic Investment Plan 2022-2026 - Hort Innovation
←
→
Page content transcription
If your browser does not render page correctly, please read the page content below
Dried grape
Strategic Investment Plan
2022-2026
CONTENTS
                                                   Executive summary                                                                  3

                                                   The dried grape Strategic Investment Plan                                          5

                                                     Financial estimates                                                              6

                                                   SECTION ONE: Dried grape industry outcomes                                         7

                                                     Industry outcomes                                                                7

                                                   SECTION TWO: Dried grape industry strategies                                       9

                                                     Strategies to address industry investment priorities                             9

                                                   SECTION THREE: Dried grape SIP monitoring and evaluation                          12
DISCLAIMER:
                                                     Dried grape SIP Monitoring and Evaluation Framework                             13
Horticulture Innovation Australia Limited
(Hort Innovation) makes no representations
and expressly disclaims all warranties (to           Reporting framework                                                             15
the extent permitted by law) about the
accuracy, completeness, or currency of any         SECTION FOUR: Collaboration and cross-industry investment                         16
information published or made available by
Hort Innovation in relation to this SIP.             Strategic science and research focus		                                          16
Your access, use and reliance on any
information published or made available by           Annual investment planning                                                      17
Hort Innovation is entirely at your own risk.
The information published or made available          Investment opportunities through Hort Frontiers                                 17
by Hort Innovation does not take into account
your personal circumstances and you should
make your own independent enquiries                  Australian-grown Horticulture Sustainability Framework                          18
before making any decision concerning
your interests or those of another party or        SECTION FIVE: Hort Innovation                                                    20
otherwise relying on the information.
Hort Innovation is not responsible for, and          Strategic Investment Plan logic                                                 20
will not be liable for, any loss (including
indirect or consequential loss), damage, claim,      Aligning to Hort Innovation investment priorities                               20
expense, cost (including legal costs) or other
liability arising in any way, including from any   SECTION SIX: Appendices                                                           21
Hort Innovation or other person’s negligence
or otherwise from your use or non-use of this
                                                     APPENDIX 1: Industry context                                                    21
SIP, or from reliance on information contained
in the material or that Hort Innovation makes
available to you by any other means.                 APPENDIX 2: Dried grape industry situation analysis                             23

COPYRIGHT NOTICE:                                    APPENDIX 3: People consulted                                                    26
Copyright © Horticulture Innovation
Australia Limited 2021                               APPENDIX 4: Reference material                                                  26
Copyright subsists in this SIP.
                                                     APPENDIX 5: List of acronyms                                                    26
Horticulture Innovation Australia Limited
(Hort Innovation) owns the copyright in the
publication, other than as permitted under
the Copyright Act 1968 (Cth).
Copying in whole or in part of this
publication is prohibited without the prior
written consent of Hort Innovation.
Any request or enquiry to use this
publication should be addressed to:
Communications Manager
Hort Innovation
Level 7, 141 Walker Street
North Sydney NSW 2060
Australia
Email: communications@horticulture.com.au
Phone: 02 8295 2300

HORT INNOVATION                                                  2                     DRIED GRAPE STRATEGIC INVESTMENT PLAN – 2022-2026
EXECUTIVE SUMMARY
    The overarching strategic intent of this Strategic Investment Plan (SIP) is to
    maintain profitability and grow the total value of the Australian dried grape
      industry by concentrating on improved and consistent product quality
                for consumers and increasing the production area.

The dried grape SIP 2022-2026 provides a roadmap to                 The four outcome areas of this SIP cover significant themes
guide Hort Innovation’s investment of dried grape industry          under which programs and investments will be focused.
levies and Australian Government contributions, ensuring            These are listed in priority order for the dried grape industry.
investment decisions are aligned with industry priorities.          Improved productivity is the primary focus, with particular
                                                                    attention to identifying world-leading technologies and
The Australian dried grape industry situation in 2019/20            knowledge available to guide decisions on automation and
is described on page 4 with further information provided            mechanisation options for Australia production systems,
in Appendix 1. There are approximately 250 dried grape              including trellis management, pruning and harvest. The second
growers and producers and two major processors and                  priority is extension and capability, which will assist industry
marketers in Australia.                                             in the communication of best management practices (BMPs)
                                                                    and awareness of outputs from research, development and
The strategic intent of the dried grape SIP provides a
                                                                    extension (RD&E) projects to build the knowledge and skills of
summary of how the dried grape industry will drive change
                                                                    growers and their advisers. Business insights will support the
over the life of the SIP. This will ultimately come about by
                                                                    provision of consumer knowledge and tracking and trade data
growers having access to the tools required to increase their
                                                                    to guide market development opportunities, while demand
profitability through improved product quality and increased
                                                                    creation will assist industry to identify and prioritise export and
production area, ensuring the industry can meet the demands
                                                                    domestic market niches where there is growth potential for
of domestic and international consumers.
                                                                    competitive supply of quality Australian dried grapes.
The financial estimates give an indicative overview of
                                                                    The key performance indicators (KPIs) detail how the impact
the funding available for the period of FY2022-FY2026.
                                                                    of each strategy will be measured, for example, by increasing
Currently the dried grape research and development (R&D)
                                                                    supply of premium product for the increasing demand of export
fund is invested until FY2024. Careful prioritisation will be
                                                                    premium markets for Australian dried grapes through improving
required when funds become available to meet the needs
                                                                    knowledge, attitudes and purchase intent by utilisation of
of the industry.
                                                                    nutrition information to support consumer demand.

HORT INNOVATION                                                 3                     DRIED GRAPE STRATEGIC INVESTMENT PLAN – 2022-2026
EXECUTIVE SUMMARY

                             PRODUCTION AREAS:                                             EXPORT/DOMESTIC:

                  WA
              1%                    SA
                                  3%                    NSW
                                                        17%                               Export 40%     Domestic 60%

                                               VIC
                                               79%              Mildura
                                                                                                VARIETIES:
Grapes grown for dried products are grown mainly
in Victoria (79%), New South Wales (17%), South
Australia (3%) and Western Australia (1%). Sunraysia,
around Mildura and along the Murray River and Darling
River is the major production area.

      PRODUCTION WINDOW:                          PRODUCTION VOLUME:

      Jan-Apr                                                                      Sultana
      NUMBER OF GROWERS:                        15,248
                                                tonnes  of dried product
                                                                                       41%
                                                                                   Sunmuscat
                                                           in 2019/20

            250
 growers and two major processors
                                              FARMGATE VALUE OF PRODUCT:

                                                                                           36%
   PER CAPITA CONSUMPTION:                                                           Currant & raisin
                                                                                               23%
                                                                                      The main varieties grown are
                                                                                     sultana (41%), sunmuscat (36%),

        1.17 kg                            $29.1 million  in 2019/20
                                                                                      and currant and raisin (23%).

                                                                                        Source: Sunrise Mapping, 2018
             in 2019/20

HORT INNOVATION                                               4            DRIED GRAPE STRATEGIC INVESTMENT PLAN – 2022-2026
THE DRIED GRAPE STRATEGIC
INVESTMENT PLAN
This SIP is the roadmap that will guide Hort Innovation’s oversight
and management of the dried grape industry’s investment
programs. It lays the foundation for decision-making in investments
and represents the balanced interest of the whole industry.
The important function of the SIP is to ensure that the investment
decisions align with the dried grape industry’s priorities.

Hort Innovation, in collaboration with Dried Fruits Australia           Agricultural levies and charges are imposed on primary
(DFA) engaged with stakeholders in preparing the refresh                producers by Government at the request of industry to
of the dried grape SIP, listening and engaging with levy                collectively fund R&D, marketing, biosecurity and residue
payers and key stakeholders and expertise available through             testing programs.
advisory mechanisms and delivery partners. The refresh
process involved consultation with and input from a wide                Levy is payable on dried grapes that are produced in
range of levy payers, objective analysis of performance and             Australia (dried fruits levy – dried vine fruits) and either sold
learning from the previous SIP, as well as environmental                by the producer (domestically or for export) or used by the
scanning to identify emergent trends and issues that could              producer in the production of other goods. The levy rate on
impact on industry profitability and sustainability.                    dried grapes is set at $11 per tonne, whilst the marketing levy
                                                                        is set at $7 per tonne.
Hort Innovation has valued the support, advice, time, and
commitment of all stakeholders that contributed to producing            Hort Innovation manages the dried grape levy funds
this SIP, especially dried grape growers.                               proportion directed to R&D ($11 per tonne), and separately
                                                                        Plant Health Australia (PHA) manages plant health programs
The whole-of-company approach taken by Hort Innovation to               ($1 per tonne).
produce this SIP has harnessed existing external and internal
knowledge, learning, partnerships and relationships. The                Hort Innovation has developed this SIP for the dried grape
output is a tailored plan with which the dried grape industry           industry to strategically invest the collected dried grape levy
can be confident of its strategic intent, including visibility on       funds into the priority areas identified and agreed by the dried
how investment impacts will be identified. Specific investments         grape industry.
to address the SIP strategies and align with industry strategic
                                                                        This SIP represents the Australian dried grape industry’s
priorities will be outlined in detail via the dried grape Annual
                                                                        collective view of its R&D and marketing needs over the
Investment Plan (AIP). The AIP will be published each year over
                                                                        next five years (2022-2026). Learning, achievements and
the lifespan of the SIP and detail the investments that will be
                                                                        analysis of the previous SIP, consultation with Australian
prioritised based on potential industry impact, as well as the
                                                                        dried grape levy payers, and synthesis of various strategic
availability of levy funds. Hort Innovation will advise industry
                                                                        documents have been incorporated into the development
stakeholders when the AIP has been published via established
                                                                        of this SIP. Appendix 3 acknowledges the people who
communication channels each year. The AIP will be developed
                                                                        were consulted in the preparation and validation of this SIP.
with input from the dried grape Strategic Investment Advisory
                                                                        Statistics and data within this publication are sourced from
Panel (SIAP), IRBs and other key stakeholders.
                                                                        the Australian Horticulture Statistic Handbook 2019/20 and
Producers in the dried grape industry pay levies to the                 other documents unless stated otherwise and are listed in
Department of Agriculture, Water and the Environment,                   Appendix 4. A list of acronyms used within the document
which is responsible for the collection, administration and             is available in Appendix 5.
disbursement of levies and charges on behalf of Australian
agricultural industries.

HORT INNOVATION                                                     5                     DRIED GRAPE STRATEGIC INVESTMENT PLAN – 2022-2026
THE DRIED GRAPE STRATEGIC INVESTMENT PLAN

Financial estimates
The annual revenue from levy income and Australian Government contributions for eligible R&D set the overall budget parameters
for the SIP. Importantly, a portion of these funds is already committed, as the industry has current multi-year projects for R&D and
marketing activities. In addition, the levy income from year to year will vary due to changes in seasonal and market conditions.

The indicative financial estimates used for the purposes of developing this SIP are presented in Table 1 below. These figures are
regularly reviewed to reflect the latest information and statistics for the industry and any changes in investment priority. For further
details refer to the dried grape AIP.

TABLE 1. Indicative financial estimates for the dried grape SIP over the life of the SIP

                                                                 2022                2023                 2024                2025            2026
                                                                    $                   $                    $                   $               $

                                                                          R&D

 Balance end FY2021                                        (140,334)

 Estimated levy funds (growers)                              135,000              133,000             133,000             133,000          133,000

 Australian Government contribution                            80,824              83,647              129,412             127,765         110,118

                           Current investments                137,400             142,200             130,000               67,200          62,200

                               New investments                        –                   –             90,000            150,000          125,000

 Total project investments                                    137,400             142,200             220,000              217,200         187,200

                                              CCR              24,247              25,094               38,824              38,329          33,035

 Projected end balance                                        (28,000)             76,000               90,600            109,900         166,600

                                                                     MARKETING

 Balance end FY2021                                          242,957

 Estimated levy funds (growers)                                74,000              74,000               74,000              74,000          74,000

                           Current investments               130,000                      –                    –                   –              –

                               New investments                        –            85,000               85,000              85,000          85,000

 Total project investments                                   130,000               85,000               85,000              85,000          85,000

                                              CCR              28,730               18,785              18,785              18,785          18,785

 Projected end balance                                        159,100             130,150             101,200               72,300          43,400

Disclaimer: All figures are indicative only and may change depending on actual income and expenditure.

Balance end FY2021 – The closing balance of the fund as at 30 June 2021
Estimated levy funds – Net levy income/revenue that is generated and collected by levy revenue services (LRS)
Australian Government contribution – Amount of contribution from the Australian Government on R&D levy-funded expenditure
Current investments – Current estimated value of contracted projects
New investments – The estimated dollar value that is available for potential new investments for industry subject to industry advice
CCR – Corporate cost recovery: the cost to implement and manage R&D and marketing investment programs for each industry
Projected end balance – Forecast of the anticipated final position of the fund

HORT INNOVATION                                                             6                        DRIED GRAPE STRATEGIC INVESTMENT PLAN – 2022-2026
1
                                                                                                            SECTION

DRIED GRAPE
INDUSTRY OUTCOMES
The overarching strategic intent of this SIP is to maintain
profitability and grow the total value of the Australian dried grape
industry by concentrating on improved and consistent product
quality for consumers and increasing the production area.

Industry outcomes
Outcome statements as identified and prioritised by the dried grape industry have been prepared under four key outcome areas:
industry supply, productivity and sustainability; extension and capability; business insights; and demand creation.

 OUTCOME 1: Industry supply, productivity and sustainability
 Improve industry productivity (inputs/outputs) to maintain competitiveness, viability and sustainability of supply.

 Supply and productivity will be supported through improvements to production efficiencies which will drive profitability
 outcomes, while ensuring long-term sustainability outcomes.

 The strategic intent of this outcome is to accelerate the application of production practices that optimise returns and reduce
 risk to growers. Achieving the outcome will involve:
 y Ensuring access to superior cultivars for efficient production that meet consumer quality expectations
 y Transition of new varietal development for the industry to commercial providers
 y Efficient production needs focusing on using mechanisation and automation to improve productivity, as well as trellis
   design and interactions with vine physiology
 y Proactively monitoring potential crop protection regulatory threats and having access to a broader suite of effective,
   socially acceptable and environmentally sound crop protection solutions.

The important function of the SIP
is to ensure that the investment
decisions align with the dried grape
industry’s priorities.

HORT INNOVATION                                                  7                    DRIED GRAPE STRATEGIC INVESTMENT PLAN – 2022-2026
SECTION ONE | DRIED GRAPE INDUSTRY OUTCOMES

 OUTCOME 2: Extension and capability
 Building capability and innovative culture.

 Building capability and an innovative culture will support industry cohesion and increase the relevant investment outputs
 across the supply and demand initiatives to better manage risk and create positive change.

 The strategic intent of this outcome is to manage knowledge, relationships, systems and processes required to communicate
 effectively with internal and external stakeholders. Achieving the outcome will involve:
 y A change in knowledge, attitude, skills, aspiration (KASA) and practice change for grower/industry profitability and
   sustainability through adoption of best management practices (BMPs) and innovating on-farm
 y Growers, value chain, media and governments being well informed on industry initiatives and achievements as a vital part
   of regional communities and networks
 y Improved networks and cross-industry collaboration to increase on-farm use of R&D outputs and to build a stronger,
   more resilient industry
 y Supporting industry participants to identify emerging RD&E needs, engaging in supporting projects and accessing findings
   from RD&E outputs
 y Assisting industry in the communication of industry BMPs and outputs from RD&E projects that build the knowledge
   and skills of growers and their advisers.

 OUTCOME 3: Business insights
 Measure industry supply (production) and demand (consumer behaviour) data and insights to inform decision-making.

 Business insights will support the industry to remain aware of market and industry trends to drive informed decision-making.

 The strategic intent of this outcome is to deliver data and insights which is foundational to achieving success in the other three
 outcome areas of demand creation; supply, productivity and sustainability; and extension and capability.

 Achieving the outcome will involve reliable baseline data and analysis to provide insights and understand current and emerging
 trends. Key investments will support the provision of consumer knowledge and tracking, trade data and independent reviews
 to enable better decision-making process at both individual business and industry levels.

 These investments underpin and are complementary to delivery of the other outcome areas.

 OUTCOME 4: Demand creation
 Contribute to improving consumer knowledge, attitudes, and purchase intent to drive volume growth.

 The premium quality of Australian dried grapes will drive the development of existing and future high value export
 markets. Improved consumer knowledge and positive attitudes to Australia’s ‘clean and green’ image encourages
 purchase intent and drives sales volume growth.

 The strategic intent of this outcome is to maintain and strengthen consumer demand, as the foundation for sustainable
 expansion of production and consumption in international markets. It means the industry is investing to:
 y Identify and prioritise export market niches where there is demand and growth potential for competitive supply of quality
   Australian dried grapes
 y Develop trade with existing and new export markets
 y Develop strong relationships across the supply chain with a shared goal to grow the Australian dried grape industry’s
   share of the category in export markets.

HORT INNOVATION                                                  8                     DRIED GRAPE STRATEGIC INVESTMENT PLAN – 2022-2026

2
                                                                                                             SECTION

DRIED GRAPE
INDUSTRY
STRATEGIES
Strategies to address industry investment priorities
The tables below describe the strategies and identified impacts for each of the four key outcome areas. The highest priority
investments lay the foundation for the SIP and its implementation will require a balanced approach to ensure the industry has
a high likelihood of success over the short (0-3 years), medium (3-5 years) and long term (5-10 years).

The ability to deliver on these strategies (and subsequent investments) will be determined by the ability of the statutory levy to
provide adequate or sufficient resources. Further resources and efficiencies may become available through alternative funding
sources such as Hort Frontiers strategic partnership initiative, external grants and/or cross-industry initiatives

 OUTCOME 1: Supply, productivity and sustainability
 The Australian dried grape industry has increased production efficiency, sustainability and profitability through innovative
 R&D, sustainable BMPs, and superior varieties and rootstocks.

 STRATEGIES                                                          POTENTIAL BENEFIT OR IMPACT

 1. Complete the performance evaluation and                          y Superior varieties and rootstocks are available to
    commercialisation activities for elite scion and rootstock         producers to increase productivity and/or profitability
    varieties from the breeding program                                and lower exposure to weather-related risk

 2. Transition new varietal development for the industry             y Increased productivity and profitability
    to commercial providers

 3. Identify world-leading technologies and available                y Increased understanding of viable and sustainable
    knowledge to guide decisions on automation and                     automation options for Australian production systems
    mechanisation options for Australian production systems
    such as trellis management, pruning and harvest

 4. Prioritise the major crop protection gaps through                y Available registered or permitted pesticides are evaluated
    a Strategic Agrichemical Review Process (SARP)*                    for overall suitability against major disease, insect pests
                                                                       and weed threats. The SARP aims to identify potential
                                                                       future solutions where tools are unavailable or unsuitable

 5. Provide regulatory support and co-ordination for crop            y Regulatory Risk Assessments have informed proactive
    protection regulatory activities with the potential to             strategic priority setting to avoid pest management gaps
    impact plant protection product access, both in Australia          in the event access or use is negatively impacted
    and internationally*

 6. Generate residue, efficacy and crop safety data to support       y Crop protection solutions meet industry priority needs
    applications to the Australian Pesticides and Veterinary           as identified in the industry SARP or biosecurity plan
    Medicines Authority (APVMA) that seeks to gain, maintain
    or broaden access to priority uses for label registrations
    and/or minor use permits for crop protection needs*

HORT INNOVATION                                                  9                      DRIED GRAPE STRATEGIC INVESTMENT PLAN – 2022-2026
SECTION TWO | DRIED GRAPE INDUSTRY STRATEGIES

 OUTCOME 2: Extension and capability
 Improved capability and an innovative culture in the Australian dried grape industry maximises investments in productivity
 and demand.

 STRATEGIES                                                      POTENTIAL BENEFIT OR IMPACT

 1. Deliver communication and extension capability to support    y A change/progression in awareness, knowledge and
    positive change in the areas of productivity and demand        skills for grower/industry profitability which supports the
                                                                   adoption of best practice and innovations

 2. In collaboration with similar industries, support the        y Improved understanding that contributes to increased
    development of a knowledge-sharing industry supply             on‑farm adoption of R&D outcomes, which will build
    chain community through targeted communication                 a stronger, more resilient industry
    channels on research findings, BMPs, emerging risks
    and opportunities

 3. Support industry participants to identify emerging RD&E      y Grower needs are identified and addressed through
    needs, engage in supporting projects and access findings       supporting RD&E projects, with access to targeted
    from RD&E outputs                                              information in support of practice change

 4. Assist industry in the communication of industry BMPs        y Changes in KASA amongst growers and their advisers
    and outputs from RD&E projects that build the knowledge        are increasing through access to tailored information
    and skills of growers and their advisers                       aligned to BMPs

 OUTCOME 3: Business insights
 The Australian dried grape industry is more profitable through informed decision-making using consumer knowledge
 and tracking and insights from trade data.

 STRATEGIES                                                      POTENTIAL BENEFIT OR IMPACT

 Increase industry alignment with quality and brand-             y Provision of business insights to deliver against demand,
 positioning opportunities driven by consumer insights*            supply and extension outcomes
                                                                 y Increased knowledge of potential markets
                                                                 y Alignment of supply and quality with demand in
                                                                   existing and emerging overseas markets

 Use trade data to guide ongoing export development              y Increased knowledge of potential markets
 opportunities*                                                  y Positioning of strategic markets

HORT INNOVATION                                                10                   DRIED GRAPE STRATEGIC INVESTMENT PLAN – 2022-2026
SECTION TWO | DRIED GRAPE INDUSTRY STRATEGIES
OUTCOME 4: Demand creation
The premium quality of the Australian dried grape industry’s products drives the development of existing and future
domestic and international markets.
STRATEGIES POTENTIAL BENEFIT OR IMPACT
1. Develop workable market access protocols to assist y Increased exports and demand
with maintenance and expansion of export markets y Increased understanding of export opportunities
amongst growers
2. Increase industry access to mechanisms for business-to- y Increased exports and grower capability
business engagement
3. Increase demand for Australian dried grapes through y Increased awareness of health/provenance benefits
improving knowledge, attitudes and purchase intent of Australian dried grapes
y Increased awareness of sustainable production practices
used for the production of Australian dried grapes
y Increased consumer demand for Australian dried grapes
* Foundational investments provide data and information that underpin the delivery of other SIP outcome areas and will be aligned to this strategy.
Foundational investment areas include:
y Consumer behavioural data
y Consumer usage and attitudes, and brand health tracking data
y Impact assessments
y Trade data
y Crop protectant data.
HORT INNOVATION 11 DRIED GRAPE STRATEGIC INVESTMENT PLAN – 2022-20263
SECTION
DRIED GRAPE
SIP MONITORING
AND EVALUATION
The dried grape SIP Monitoring and Evaluation (M&E) Framework development has been informed by Hort Innovation’s
Organisational Evaluation Framework.
Progress against the SIP will be reported in Hort Innovation publications and through industry communication channels. The SIP
outcomes and strategies are used to inform KPIs that in turn drive the investments and individual projects to deliver on the SIP.
Projects responsible for delivering the strategy aligned with each KPI will collect the data.
An M&E and reporting framework is shown below. The framework shows what will be measured to demonstrate progress against
the SIP and how metrics will be tracked. Reporting on KPIs will be processed through various formal channels to inform industry
and government investors of progress, performance, and impact. Data sources to support M&E will be identified and collected
as part of the requirements for each levy investment.
Hort Innovation will facilitate the regular review of the SIP to ensure it remains relevant to industry.
This SIP is the roadmap that will guide
Hort Innovation’s oversight and management of
the dried grape industry’s investment programs.
HORT INNOVATION 12 DRIED GRAPE STRATEGIC INVESTMENT PLAN – 2022-2026SECTION THREE | DRIED GRAPE MONITORING AND EVALUATION
Dried grape SIP Monitoring and Evaluation Framework
The dried grape SIP M&E Framework is shown below. It includes KPIs and data collection methods both at a macro/industry (trend)
level and at more specific SIP strategic level/s.
OUTCOME STRATEGIES KPIs
Industry supply, productivity and sustainability
Outcome 1: 1. Complete the performance evaluation y Availability of elite scion and rootstock
The Australian dried and commercialisation activities for elite performance data for growers
grape industry has scion and rootstock varieties from the
y Commercialised elite scion and rootstock
increased production breeding program
varieties are available for grower adoption
efficiency, sustainability
and profitability 2. Transition new varietal development for y Complete commercialisation of new scion
through innovative the industry to commercial providers and rootstock varieties
R&D, sustainable BMPs
3. Identify world-leading technologies and y New knowledge on crop production
and superior varieties
available knowledge to guide decisions on methods, emerging technologies, and
and rootstocks.
automation and mechanisation options for varieties that enable new automation-
Australian production systems such as trellis enabled trellised production systems that
management, pruning and harvest reduce dependence on labour input
4. Prioritise the major crop protection gaps y Coordinated industry priority setting with
through a SARP* a clear outlook of gaps and risks in existing
pest control options
y Industry priority needs published and shared
with stakeholders, including registrants
5. Provide regulatory support and co‑ordination y Regulatory Risk Assessments maintained
for crop protection regulatory activities
with the potential to impact plant protection
product access, both in Australia and
internationally*
6. Generate residue, efficacy and crop safety y Data to support applications to the APVMA
data to support applications to the APVMA and the establishment of Maximum
that seeks to gain, maintain or broaden Residue Limits (MRLs)
access to priority uses for label registrations
and/or minor use permits for crop
protection needs*
HORT INNOVATION 13 DRIED GRAPE STRATEGIC INVESTMENT PLAN – 2022-2026SECTION THREE | DRIED GRAPE MONITORING AND EVALUATION
OUTCOME STRATEGIES KPIs
Extension and capability
Outcome 2: 1. Deliver communication and extension y Establishment of a baseline and then
Improved capability capability to support positive change in the increased share of industry (hectares) with
and an innovative areas of productivity and demand positive change in KASA and practice
culture in the Australian concerning targeted high priority areas
dried grape industry
y Establishment of a baseline and then
maximises investments
increased share of industry (hectares) that
in productivity and
are implementing targeted high priority areas
demand.
2. In collaboration with similar industries, y Total stakeholder readership of dried grape
support the development of a knowledge- industry news (Current News and Vine
sharing industry supply chain community News): number and/or percentage of open
through targeted communication channels rate of electronic newsletters and number
on research findings, BMPs, emerging risks of hard copies circulated
and opportunities
y Demonstration of the balance of written
content of Currant News and Vine News
providing articles representative of the dried
grape supply chain elements including:
R&D and on-farm demonstration outcomes;
BMP recommendations for growers;
marketing and processing intelligence;
sharing of grower knowledge and practice
change outcomes through benchmarking
and case studies
3. Support industry participants to identify y Identification of industry-specific needs that
emerging RD&E needs, engage in contribute to RD&E project design
supporting projects and access findings
y Research findings and other BMPs from
from RD&E outputs
RD&E outputs are communicated
4. Assist industry in the communication of y Changes in KASA are captured in a case
industry BMPs and outputs from RD&E study (project-specific basis) amongst
projects that build the knowledge and skills growers and their advisers
of growers and their advisers
Business insights
Outcome 3: 1. Increase industry alignment with quality and y Development of a consumer insights strategy
The Australian dried brand-positioning opportunities driven by y Evidence that consumer insights inform
grape industry is consumer insights* strategic market engagement
more profitable
through informed y Availability of new consumer knowledge
decision-making using for growers
consumer knowledge 2. Use trade data to guide ongoing export y Trade data maintained and tailored data
and tracking and insights development opportunities* outputs supplied to meet stakeholders’
from trade data. needs
HORT INNOVATION 14 DRIED GRAPE STRATEGIC INVESTMENT PLAN – 2022-2026SECTION THREE | DRIED GRAPE MONITORING AND EVALUATION
OUTCOME STRATEGIES KPIs
Demand Creation
Outcome 4: 1. Develop workable market access protocols y Market access opportunities are prioritised
The premium quality to assist with maintenance and expansion of on national benefit and evidence-based
of the Australian export markets export strategy
dried grape industry’s
y Support of technical access to selected
products drives the
export markets (e.g., relevant datasets
development of existing
developed)
and future domestic and
international markets. 2. Increase industry access to mechanisms y Support and facilitation of exporters to build
for business-to-business engagement networks online and/or in market
3. Increase demand for Australian dried grapes y Positive influence on consumer preference
through improving knowledge, attitudes and y Use of nutritional and provenance
purchase intent information to support consumer demand
y Use of production system information to
support consumer demand
* Foundational investments provide data and information that underpin the delivery of other SIP outcome areas and will be aligned to this strategy.
Foundational investment areas include:
y Consumer behavioural data
y Consumer usage and attitudes, and brand health tracking data
y Impact assessments
y Trade data
y Crop protectant data.
Reporting framework
Hort Innovation will use dynamic reporting aligned to the Organisational Evaluation Framework to report regularly on progress
and performance. Reporting will be processed through formal channels to inform industry and government investors.
A review of investment performance against the respective industry outcome and/or strategy-level KPIs for the dried grape SIP
will be completed annually as the primary reporting mechanism. The SIP performance report will provide:
y Evidence of progress towards achieving the industry-specific outcomes and strategies through an assessment of the KPIs
identified in the SIP
y Evidence of progress towards cross-industry investment strategies and outcomes. It will involve Hort Innovation’s whole-of-
horticulture reporting obligations and corporate plan and involve annual reports and Hort Innovation’s Annual Operating Plan.
SIP performance reports will also inform the Australian Government of progress towards achieving government priorities.
In particular, reporting will support Hort Innovation to meet the Performance Principles and requirements contained in the
Deed of Agreement 2020-2030.
HORT INNOVATION 15 DRIED GRAPE STRATEGIC INVESTMENT PLAN – 2022-20264
SECTION
COLLABORATION
AND CROSS-INDUSTRY
INVESTMENT
Based on advice from industry throughout the engagement
process, Hort Innovation understands that Australian horticulture
industries have common issues, and in turn have identified
prospective areas for collaboration and cross-industry or
regional investment.
These opportunities have been included as strategies Strategic science and research focus
across multiple industry SIPs where relevant and required.
By delivering targeted multi-industry collaboration in RD&E, Collaboration across the agriculture research community
marketing and international trade, Hort Innovation aims to is essential, including with Industry Representative Bodies
support more effective and efficient outcomes for growers (IRBs) and organisations such as the CSIRO, universities,
and the wider horticulture sector. This includes driving private enterprise and state government agencies. Hort
investment through the Hort Frontiers strategic partnership Innovation is a member of the National Horticulture Research
initiative. Importantly, while this approach acknowledges there Network (NHRN) together with other senior horticultural
is value in solving issues across industries and regions, it does R&D representatives from state and Australian Government
not reduce the importance of industry-specific initiatives. agricultural agencies. The NHRN is responsible for the
development and implementation of the broader Horticulture
Cross-industry/regional opportunities identified for the dried RD&E Strategy under the National Primary Industries
grape industry include: RD&E Framework.
y Opportunities to support export markets through
During the engagement process, key delivery partners
communication of nutritional benefits
were contacted including lead agencies within the NHRN
y Export supply chain pathways (new way of doing business). Framework as well as specific delivery partners for each
industry. The lead agency involved with the dried grape
Cross-industry areas of collaboration for demand driving
industry investment program, CSIRO, was engaged during
outcomes provide the opportunity to advance the prosperity
the development of this SIP to ensure consideration and
of the sector through gaining efficiencies in the delivery of
strategically-aligned priorities for the dried grape industry.
the program and contributing to stronger overall outcomes.
In addition, strategic priorities and opportunities identified by
By collaborating as one sector to win the hearts and
DFA have been considered in the development of the dried
minds of the consumers, in addition to individual demand
grape SIP where applicable.
driving programs, there is the potential to enhance the total
category value proposition, contributing to driving returns for
Australian growers.
HORT INNOVATION 16 DRIED GRAPE STRATEGIC INVESTMENT PLAN – 2022-2026SECTION FOUR | COLLABORATION AND CROSS-INDUSTRY INVESTMENT
TABLE 2. Government and key agency priorities
Dried Fruits Australia CSIRO priorities Rural RD&E for Profit Australian Government
priorities priorities Science and Research
priorities
Promotion of new grape Automation Advanced technology Food
varieties and rootstocks
Better systems Biosecurity Soil and water
Training Rapid breeding techniques Advanced manufacturing
Soil, water and managing
Sustainable management Rootstocks and varieties natural resources Environmental change
practices
Education and training Adoption of R&D Health
Mechanisation and trellis
drying
Peer-to-peer learning
This SIP has been developed alongside the government and key agency priorities listed in Table 2, with consideration of issues
faced by the dried grape industry. These strategic areas further emphasise the opportunity and importance of cross-industry and
regional collaboration. All the priority areas are of importance to Australian horticulture, and these will play a role in driving the
efficiency and effectiveness of investment across the sector.
Annual investment planning
Specific investments to address the SIP strategies and align with industry strategic priorities will be outlined in detail each year via
the dried grape AIP. Investment decisions are guided by the SIP and prioritised based on potential industry impact, as well as the
availability of levy funds each year. The AIP will be developed with input from the dried grape SIAP, which is made up of growers
and other industry representatives as well as IRBs and other key stakeholders. Wherever possible, investments will be aligned to
form multi-industry projects to increase the efficiency of funding availability. Details of the SIAP can be found on the Hort Innovation
website here, and the AIP will be published on the same page each year.
Investment opportunities through Hort Frontiers
Innovation is key to the future success of Australian horticulture. The next evolution of the long-range, higher risk and transformational
R&D that has the potential to make a significant impact will be possible through Hort Innovation’s Hort Frontiers program strategic
partnership initiative.
Hort Frontiers is a strategic partnership initiative that facilitates collaborative, cross-industry investments focused on the longer
term and more complex themes identified as critical for Australian horticulture by 2030. The partnership framework is currently
being established and will include a number of key investment themes for potential investment to guide the initiative and drive
transformational R&D across horticulture. Key investment themes will include:
y Environmental sustainability (water, soil and climate)
y Pollination
y Green cities
y Biosecurity
y Health, nutrition and food safety
y Advanced production systems
y International markets
y Leadership
y Novel food and alternate uses (waste reduction).
HORT INNOVATION 17 DRIED GRAPE STRATEGIC INVESTMENT PLAN – 2022-2026SECTION FOUR | COLLABORATION AND CROSS-INDUSTRY INVESTMENT
The development of these areas for investment will benefit all of horticulture, with support from partners with aligned priorities
to co-invest in deliverables identified that require alternative funds available outside the levy. Hort Frontiers is being developed
to align with the Australian-grown Horticulture Sustainability Framework and to invest in specific impact areas to drive innovation
and sustainability initiatives.
The dried grape industry views a number of these investment areas as opportunities for success into the future, including:
y Advanced production systems
y Health, nutrition and food safety
y International markets
y Leadership.
Partnering with Hort Frontiers on these areas would provide the dried grape industry with opportunities for access to world-class
research, specialised project management teams and large-scale R&D.
Australian-grown Horticulture Sustainability Framework
Hort Innovation has developed the Australian-grown Horticulture Sustainability Framework report, aiming to strengthen the
horticulture industry’s sustainability to meet the changing expectations and needs of growers, consumers, the community,
investors and governments. The report applies across the whole of Australian horticulture, including fruits, vegetables, nuts and
nursery stock. Through widespread consultation with industry and external groups, proposed sustainability goals and indicators
were identified and are detailed within the framework. The framework is aligned to the UN Sustainable Development Goals.
Four key pillars were identified in the framework (Figure 1).
FIGURE 1. Four key pillars of the Australian-grown Horticulture Sustainability Framework
Nourish & People &
Nurture Enterprise
Food to nourish people Productive, profitable growers
Plants to nurture communities Safe & ethical work
Safe, traceable, quality Leadership & governance
Innovation
Thriving communities
Trade & economic value
Planet & Less
Resources waste
Water Food waste
Landscapes Packaging
Climate Farm waste
Energy
Biosecurity
HORT INNOVATION 18 DRIED GRAPE STRATEGIC INVESTMENT PLAN – 2022-2026SECTION FOUR | COLLABORATION AND CROSS-INDUSTRY INVESTMENT
The framework should be cross-referenced when undertaking prioritisation of investments. At the time of publication, Hort
Innovation is working with industry groups regarding the overall responsibility for the framework, setting and reporting progress
against the framework targets and performance measures.
View the Australian-grown Horticulture Sustainability Framework on the Hort Innovation website here.
Table 3 provides an example of a dried grape SIP strategy that illustrates how the industry is already aligning to the framework.
TABLE 3. A dried grape SIP strategy example showing how the industry is already aligning to the Australian-grown
Horticulture Sustainability Framework
STRATEGY IMPACT SUSTAINABILITY GOAL
Deliver communication and extension y A change/progression in awareness, People & Enterprise
capability to support positive change in knowledge and skills for grower/
the areas of productivity and demand industry profitability which supports
the adoption of BMPs
The overarching strategic intent of this SIP is to
maintain profitability and grow the total value of the
Australian dried grape industry by concentrating on
improved and consistent product quality for consumers
and increasing the production area.
HORT INNOVATION 19 DRIED GRAPE STRATEGIC INVESTMENT PLAN – 2022-20265
SECTION
HORT INNOVATION
Strategic Investment Plan logic
The SIP logic (Figure 2) identifies how investment activities and outputs (delivered through each SIP outcome area) will support
changes in industry KASA, which drive adoption and behaviour change. Beyond the SIP, investment will contribute to driving longer-
term impacts for the sector like increased preparedness, demand, productivity, global competitiveness and profitability. Realising
these impacts will support Hort Innovation’s vision of increased prosperity and sustainability of Australia’s horticulture industries.
FIGURE 2. Strategic Investment Plan logic
Vision Increased prosperity and sustainability of Australia’s horticulture industries
INDIRECT
INFLUENCE:
Hort Innovation
Longer-term Increased profitability Improved global competitiveness
strategy and broader
industry level outcomes/impacts
Improved productivity Improved preparedness Increased demand
Monitoring and evaluation (including ex-post impact assessment)
Strategic Investment Plan line of accountability
End-of-strategy Adoption and changed behaviour (by target audience – growers, consultants,
outcomes supply chain stakeholders, retailers, consumers)
Intermediate Change in knowledge, attitudes, skills and aspirations
outcomes Continuous
improvement
Industry supply, productivity
Demand creation
and sustainability
Contribute to demand generation to
Improve industry productivity to maintain
drive growth across domestic and
DIRECT local and international competitiveness
international markets
INFLUENCE: and viability of supply
Project/Strategic
Investment
Plan level Extension and capability
Activities Extension, communication, capability building
and outputs and leadership
Business insights
Measurement of industry supply (production),
demand (consumer behaviour), data and insights
to inform decision-making
Hort Innovation Strategic Investment Plans and requirements
Enablers
under Australian Government reporting obligations
Aligning to Hort Innovation investment of levies and Australian Government contributions.
As a Research and Development Corporation (RDC),
investment priorities Hort Innovation is able to leverage industry levy investments
Hort Innovation is committed to sustainable growth in in RD&E with Government funds up to a value of 0.5% of the
horticulture, with the overarching aim of increasing the industry’s gross value of production. All investments made
sector’s value to $20 billion by 2030. We will do this through by Hort Innovation are thoroughly considered to ensure they
implementing the SIP and investments against the three core contribute to the guiding performance principles:
pillars, committed to: y Productivity
1. Drive knowledge and innovation into horticulture industries y Profitability
2. Deliver the highest value R&D, marketing and international y Preparedness for future opportunities and challenges
trade investments across industries now and into the future
y Competitiveness
3. Enable activities that drive all strategic imperatives.
y Demand: demonstrates how productivity, preparedness
Hort Innovation is governed by a Deed of Agreement with and demand lead to profitability and competitiveness
the Australian Government, which allows for the transfer and and sustainability.
HORT INNOVATION 20 DRIED GRAPE STRATEGIC INVESTMENT PLAN – 2022-20266
SECTION
APPENDICES
APPENDIX 1: Industry context
Industry supply chain
The dried grape industry is a small but well-established horticulture industry in Australia with approximately 250 growers and
producers. In addition, the dried grape supply chain is also supported by agronomists, processors and marketing companies that
grade, clean, pack, and market the product. There are two major processors and marketers of dried grapes in Australia, who are
based in the Sunraysia region:
y Sunbeam Foods
y Australian Premium Dried Fruits (APDF).
Vertical integration in the industry is increasing. APDF is partially vertically integrated. Sunbeam Foods sources all grapes
from external suppliers. Where it is necessary to meet supply contracts, Sunbeam Foods imports product. The concentration
of marketing of almost the entire Australian dried grape crop through two companies, each with its own branding, promotion
and market development investments, distinguishes dried grapes from many other horticultural industries.
The industry invests a significant amount of funds in capacity-building projects such as the Hort Innovation projects Dried grape
production innovation and adoption program 2018-2021 (DG17001) and Dried grape industry communications (DG18001),
which ensures that the industry is well connected and collaborative.
FIGURE 3. Dried grape supply chain, 2019/20
Dried
5,267 tonnes
Export
$30.5 million
40%
13,250 tonnes 30,197 tonnes
Production 60% Supply
$29.1 million $123 million
Dried
100%
22,214 tonnes
Import
$67.7 million
Source: Australian Horticulture Statistics Handbook (2019/20)
The domestic market for dried grapes is slightly larger than the export market, with 60% of production consumed domestically.
Imports dominate domestic supply, however, making up 74%.
HORT INNOVATION 21 DRIED GRAPE STRATEGIC INVESTMENT PLAN – 2022-2026SECTION SIX | APPENDICES
Domestic consumers and drivers of demand
The domestic market is the most important channel for the Australian dried grape industry which accounted for 60% of the total
production volume in 2019/20. The domestic market has been in decline, with supply per capita falling from 1.62 kilograms in
2013/14 to 1.17 kilograms in 2019/20 on account of falling production volumes and imports remaining flat. Supply of most dried
grapes in Australia is met by imports (primarily from Turkey) and this accounted for 74% of the volume of supply in Australia.
While the domestic market has been declining, the unit wholesale value of Australian dried grapes has been increasing.
The average dried grape unit value of wholesale supply was $4.08 per kilogram in 2019/20 compared to $1.95 per kilogram
in 2012/13. This indicates an increasing value of dried grapes in the market.
Export markets
FIGURE 4. Dried grape exports, 2012/13 to 2019/20
6,000 $35
5,000 $30
$25
4,000
$20
$ million
Tonnes
3,000
$15
2,000
$10
1,000 $5
0 $0
2012/13 2013/14 2014/15 2015/16 2016/17 2017/18 2018/19 2019/20
Export volume (t) Export value ($m)
Source: Australian Horticulture Statistics Handbook (2019/20)
An increasing proportion of Australian dried grapes are being supplied to high value export markets. 1,163 tonnes of product
was exported in 2012/13, representing 8% of domestic production, while in 2019/20, export volume has more than quadrupled to
reach 5,267 tonnes, representing 40% of production. In value terms the Free on Board (FOB) export value has also increased from
$4.21 per kilogram in 2012/13 to $5.80 per kilogram in 2019/20, which is higher than competitors Turkey ($3.13 per kilogram) and
the USA ($4.20 per kilogram).
The price premium can be readily justified by the high quality of the Australian product, including physical attributes (flavour, size,
colour, freedom from foreign material) and less tangible features such as being ‘clean and green’ and supported by rigorous food
safety standards. Australia’s ‘clean and green’ image is a valuable underpinning in these respects.
Australian dried grapes are exported primarily into European (Germany, Italy, Belgium – 45% of export volume in 2019/20)
and Asian (China, Japan, Vietnam – 32% of export volume in 2019/20) markets.
HORT INNOVATION 22 DRIED GRAPE STRATEGIC INVESTMENT PLAN – 2022-2026SECTION SIX | APPENDICES
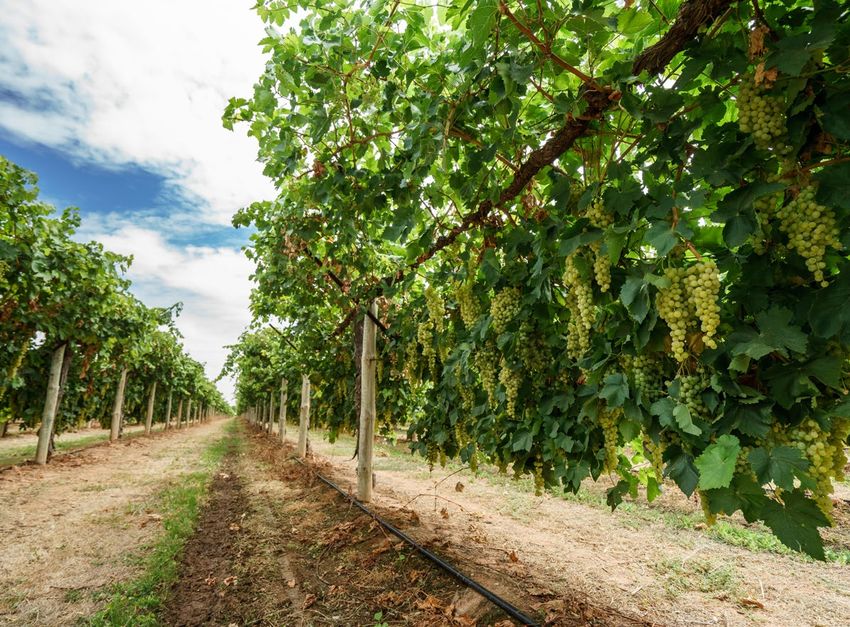
Industry production
FIGURE 5. Dried grape production, 2012/13 to 2019/20
20,000 $35
18,000
$30
16,000
14,000 $25
$ million
Tonnes
12,000 $20
10,000
8,000 $15
6,000 $10
4,000
$5
2,000
0 $0
2012/13 2013/14 2014/15 2015/16 2016/17 2017/18 2018/19 2019/20
Production volume (t) Production value ($m)
Source: Australian Horticulture Statistics Handbook (2019/20)
Australian dried grapes are grown mainly in Victoria (79%), New South Wales (17%), South Australia (3%) and Western Australia (1%).
Sunraysia, around Mildura and along the Murray River and Darling River is the major production area. Production is mainly between
January and April, peaking in February and March.
The main varieties grown are sultanas (41%), sunmuscats (36%) and currants and raisins (23%). Other varieties include diamond
muscat, flame seedless and sunglo. These latter varieties are newer, and their contribution to overall production is increasing
as new plantings start to produce fruit.
HORT INNOVATION 23 DRIED GRAPE STRATEGIC INVESTMENT PLAN – 2022-2026SECTION SIX | APPENDICES
APPENDIX 2: Dried grape industry situation analysis
At the time of refreshing the SIP in 2021, the global coronavirus (COVID-19) pandemic continues to affect horticulture industries to
varying degrees. Although the outcome and ultimate impact of the pandemic are unknown, areas of investment across horticulture
that may be influenced over the period of this SIP include export and trade relationships, international demand, logistics and
supply chain and labour supply – all having potential impacts on producers’ profitability.
Environmental, economic and social sustainability are vitally important to Australian horticultural growers and industries.
Customers, consumers, and investors also seek information about the sustainability and ethics of how their food is produced.
Sustainability is particularly crucial as topics such as climate variability, health and ethics continue to shape the social,
environmental, and political landscape for agricultural industries. The impact of these issues may have influence on a whole range
of investment areas for horticulture from production practices and land management, demand and reputation of products, quality
expectations and cultural/community engagement.
Strengths, weaknesses, opportunities and threats
Table 4 has been used to analyse the dried grape industry’s strengths, weaknesses, opportunities, and threats (SWOT). The
SWOT tool assists the industry to build on what works, observe what is lacking, minimise risks, and take the greatest possible
advantage of chances for success.
TABLE 4. Dried grape SWOT analysis
The dried grape industry
Strengths y ‘Clean and green’ production systems
y Strong and positive relationships between producers and processors
y World-leading production and processing skills
y Geographic concentration of the industry, simplifying RD&E needs and increasing interaction between
producers
Weaknesses y Relatively low returns compared to competing other grape end-use industries and tree nut crops
y Small industry size limits industry infrastructure (e.g., processing) and ability to reliably supply markets
reduces the industry’s collective influence
y Limited RD&E and marketing budgets, and little ability to leverage overseas R&D outcomes because
Australia already leads globally
y Industry’s geographically concentrated productive capacity creates medium exposure to climatic risks
Opportunities y Increasing scale and vertical integration in the industry
y Closing the yield gap between high and low producers
y New varieties or greater use of existing varieties (e.g., currant) to provide improved disease resistance
y Applying precision agriculture to reduce variability within blocks
y Increasing mechanisation, especially of pruning, and other technologies to reduce labour requirements
y Development of people (including industry leaders, growers, apprentices)
y Sharing R&D, marketing and operating activities and resources with other industries
y Expansion of exports to Asian markets, leveraging Australia’s ‘clean and green’ image
y Positioning of dried grapes in supermarket ‘fresh,’ health and baking aisles
y Collaboration with table grape industry, especially in marketing – sharing of shelf space
HORT INNOVATION 24 DRIED GRAPE STRATEGIC INVESTMENT PLAN – 2022-2026SECTION SIX | APPENDICES
The dried grape industry
Threats y Biosecurity threats particularly Xylella fastidiosa and brown marmorated stink bug
y Climate change/variability
y New, increasingly resistant endemic pest and diseases
y More stringent regulations agrichemical residues (especially in the EU) and lack of alternative agrichemical
becoming available
y Increasing bureaucracy and ‘red tape’
y Dwindling expertise in the industry, leading to inferior product quality
y Disappointing customers by failure to supply – particular a problem with light-coloured fruit
y Increased competition from imports
y Reduced consumption due to health concerns over sugar
y Reduced supply due to enterprise shifts (e.g., almonds)
HORT INNOVATION 25 DRIED GRAPE STRATEGIC INVESTMENT PLAN – 2022-2026You can also read