Downregulation of glial genes involved in synaptic function mitigates Huntington's disease pathogenesis
←
→
Page content transcription
If your browser does not render page correctly, please read the page content below
RESEARCH ARTICLE

                                   Downregulation of glial genes involved in
                                   synaptic function mitigates Huntington’s
                                   disease pathogenesis
                                   Tarik Seref Onur1,2,3†, Andrew Laitman2,4,5†, He Zhao2, Ryan Keyho2,
                                   Hyemin Kim2, Jennifer Wang2, Megan Mair1,2,3, Huilan Wang6, Lifang Li1,2,
                                   Alma Perez2, Maria de Haro1,2, Ying-Wooi Wan2, Genevera Allen2,7, Boxun Lu6,
                                   Ismael Al-Ramahi1,2, Zhandong Liu2,4,5, Juan Botas1,2,3,4*
                                   1
                                     Department of Molecular and Human Genetics, Baylor College of Medicine,
                                   Houston, United States; 2Jan and Dan Duncan Neurological Research Institute at
                                   Texas Children’s Hospital, Houston, United States; 3Genetics & Genomics Graduate
                                   Program, Baylor College of Medicine, Houston, United States; 4Quantitative &
                                   Computational Biosciences, Baylor College of Medicine, Houston, United States;
                                   5
                                     Department of Pediatrics, Baylor College of Medicine, Houston, United States;
                                   6
                                     State Key Laboratory of Medical Neurobiology and MOE Frontiers Center for
                                   Brain Science, Fudan University, Shanghai, China; 7Departments of Electrical &
                                   Computer Engineering, Statistics and Computer Science, Rice University, Houston,
                                   United States

                                   Abstract Most research on neurodegenerative diseases has focused on neurons, yet glia help
                                   form and maintain the synapses whose loss is so prominent in these conditions. To investigate the
                                   contributions of glia to Huntington’s disease (HD), we profiled the gene expression alterations of
*For correspondence:
                                   Drosophila expressing human mutant Huntingtin (mHTT) in either glia or neurons and compared
jbotas@bcm.edu                     these changes to what is observed in HD human and HD mice striata. A large portion of conserved
†
                                   genes are concordantly dysregulated across the three species; we tested these genes in a high-
 These authors contributed
                                   throughput behavioral assay and found that downregulation of genes involved in synapse assembly
equally to this work
                                   mitigated pathogenesis and behavioral deficits. To our surprise, reducing dNRXN3 function in glia
Competing interests: The           was sufficient to improve the phenotype of flies expressing mHTT in neurons, suggesting that
authors declare that no            mHTT’s toxic effects in glia ramify throughout the brain. This supports a model in which dampening
competing interests exist.         synaptic function is protective because it attenuates the excitotoxicity that characterizes HD.
Funding: See page 23
Received: 03 November 2020
Accepted: 19 April 2021
Published: 19 April 2021           Introduction
                                   Neurodegenerative conditions involve a complex cascade of events that takes many years to unfold.
Reviewing editor: Michael B
Eisen, University of California,
                                   Even in the case of inherited disorders due to mutation in a single gene, such as Huntington’s dis-
Berkeley, United States            ease (HD), the downstream ramifications at the molecular level are astonishingly broad. Caused by a
                                   CAG repeat expansion in Huntingtin (HTT) (The Huntington’s Disease Collaborative Research
   Copyright Onur et al. This
                                   Group, 1993), HD pathology is prominent in the striatum and cortex, yet transcriptomic studies con-
article is distributed under the
                                   sistently reveal thousands of changes in gene expression across the brain and different neuronal cell
terms of the Creative Commons
Attribution License, which         types, involving pathways ranging from autophagy to vesicular trafficking (Saudou and Humbert,
permits unrestricted use and       2016). To disentangle changes that are pathogenic from those that represent the brain’s effort to
redistribution provided that the   compensate for the disease, we recently integrated transcriptomics with in silico analysis and high-
original author and source are     throughput in vivo screening using a Drosophila model of HD (Al-Ramahi et al., 2018). This study
credited.                          demonstrated that HD pathogenesis is driven by upregulation of genes involved in the actin

Onur, Laitman, et al. eLife 2021;10:e64564. DOI: https://doi.org/10.7554/eLife.64564                                             1 of 30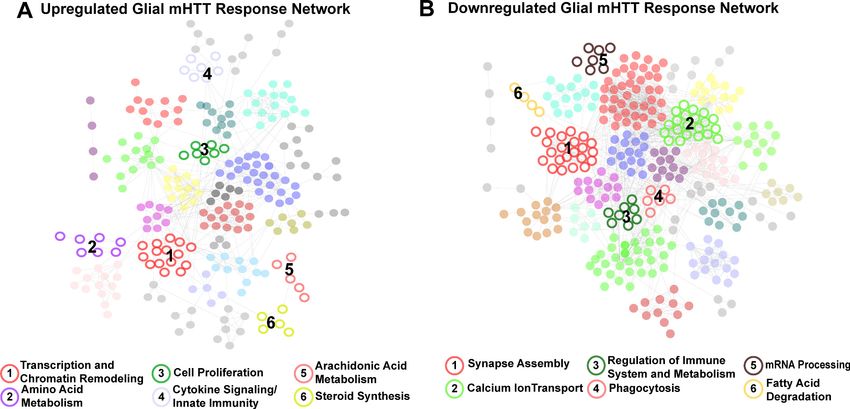
Research article                                                            Computational and Systems Biology Genetics and Genomics

                                   eLife digest When a neuron dies, through injury or disease, the body loses all communication
                                   that passes through it. The brain compensates by rerouting the flow of information through other
                                   neurons in the network. Eventually, if the loss of neurons becomes too great, compensation
                                   becomes impossible. This process happens in Alzheimer’s, Parkinson’s, and Huntington’s disease. In
                                   the case of Huntington’s disease, the cause is mutation to a single gene known as huntingtin. The
                                   mutation is present in every cell in the body but causes particular damage to parts of the brain
                                   involved in mood, thinking and movement.
                                       Neurons and other cells respond to mutations in the huntingtin gene by turning the activities of
                                   other genes up or down, but it is not clear whether all of these changes contribute to the damage
                                   seen in Huntington’s disease. In fact, it is possible that some of the changes are a result of the brain
                                   trying to protect itself. So far, most research on this subject has focused on neurons because the
                                   huntingtin gene plays a role in maintaining healthy neuronal connections. But, given that all cells
                                   carry the mutated gene, it is likely that other cells are also involved. The glia are a diverse group of
                                   cells that support the brain, providing care and sustenance to neurons. These cells have a known
                                   role in maintaining the connections between neurons and may also have play a role in either causing
                                   or correcting the damage seen in Huntington’s disease.
                                       The aim of Onur et al. was to find out which genes are affected by having a mutant huntingtin
                                   gene in neurons or glia, and whether severity of Huntington’s disease improved or worsened when
                                   the activity of these genes changed. First, Onur et al. identified genes affected by mutant huntingtin
                                   by comparing healthy human brains to the brains of people with Huntington’s disease. Repeating
                                   the same comparison in mice and fruit flies identified genes affected in the same way across all three
                                   species, revealing that, in Huntington’s disease, the brain dials down glial cell genes involved in
                                   maintaining neuronal connections.
                                       To find out how these changes in gene activity affect disease severity and progression, Onur
                                   et al. manipulated the activity of each of the genes they had identified in fruit flies that carried
                                   mutant versions of huntingtin either in neurons, in glial cells or in both cell types. They then filmed
                                   the flies to see the effects of the manipulation on movement behaviors, which are affected by
                                   Huntington’s disease. This revealed that purposely lowering the activity of the glial genes involved in
                                   maintaining connections between neurons improved the symptoms of the disease, but only in flies
                                   who had mutant huntingtin in their glial cells. This indicates that the drop in activity of these genes
                                   observed in Huntington’s disease is the brain trying to protect itself.
                                       This work suggests that it is important to include glial cells in studies of neurological disorders. It
                                   also highlights the fact that changes in gene expression as a result of a disease are not always bad.
                                   Many alterations are compensatory, and try to either make up for or protect cells affected by the
                                   disease. Therefore, it may be important to consider whether drugs designed to treat a condition by
                                   changing levels of gene activity might undo some of the body’s natural protection. Working out
                                   which changes drive disease and which changes are protective will be essential for designing
                                   effective treatments.

                                   cytoskeleton and inflammation, but that neurons compensate by downregulating the expression of
                                   genes involved in synaptic biology and calcium signaling.
                                       The finding that synaptic changes were protective caught our attention because HTT itself is nec-
                                   essary for normal synaptogenesis and maintenance within the cortico-striatal circuit
                                   (McKinstry et al., 2014), largely through its role in retrograde axonal trafficking of neurotrophic fac-
                                   tors (Saudou and Humbert, 2016). But synapses involve more than just neurons: glial cells also con-
                                   tribute to synapse formation, function, and elimination (Filipello et al., 2018; McKinstry et al.,
                                   2014; Octeau et al., 2018; Stogsdill et al., 2017). There is, in fact, emerging evidence that various
                                   glial subtypes affect outcomes in HD. The accumulation of mutant Huntingtin(mHTT) in astrocytes
                                   and oligodendrocytes hinders their development and function and contributes to disease pathophys-
                                   iology (Benraiss et al., 2016; Ferrari Bardile et al., 2019; Osipovitch et al., 2019; Wood et al.,
                                   2018). Conversely, healthy glia can improve the disease phenotype in HD mice (Benraiss et al.,
                                   2016). Recent studies using single-cell sequencing in astrocytes isolated from post-mortem tissue

Onur, Laitman, et al. eLife 2021;10:e64564. DOI: https://doi.org/10.7554/eLife.64564                                                   2 of 30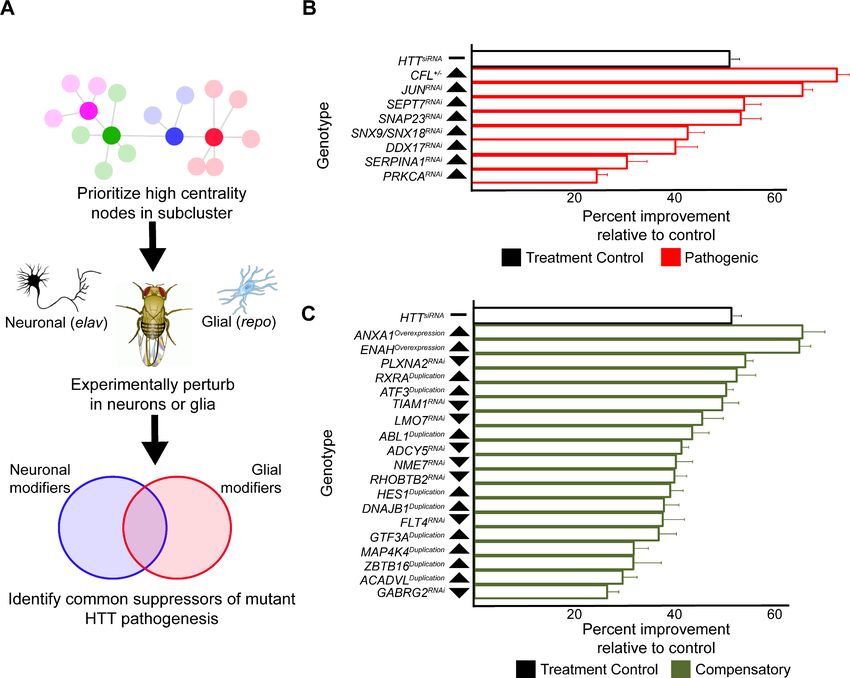
Research article                                                            Computational and Systems Biology Genetics and Genomics

                                   from HD patients and mouse models of HD (Al-Dalahmah et al., 2020; Diaz-Castro et al., 2019)
                                   developed molecular profiles that distinguish HD-affected astrocytes from astrocytes found in
                                   healthy brain tissue, but the physiological consequences of the gene expression changes were
                                   unclear. Whether mHTT affects glial participation in synapse formation or maintenance remains
                                   unknown, but then, we are only just now beginning to understand the range of glial types and their
                                   functions (Bayraktar et al., 2020; Darmanis et al., 2015).
                                       The combination of synaptic degeneration in HD and the fact that both HTT and glia contribute
                                   to synaptic formation and maintenance led us to further investigate the influence of mHTT in glia.
                                   Because Drosophila have been used to elucidate glial biology (Freeman and Doherty, 2006;
                                   Olsen and Feany, 2019; Pearce et al., 2015; Ziegenfuss et al., 2012) and are a tractable model
                                   system for studying HD and other neurodegenerative diseases (Al-Ramahi et al., 2018;
                                   Bondar et al., 2018; Donnelly et al., 2020; Fernandez-Funez et al., 2000; Filimonenko et al.,
                                   2010; Goodman et al., 2019; Ochaba et al., 2014; Olsen and Feany, 2019; O’Rourke et al.,
                                   2013; Rousseaux et al., 2018; Yuva-Aydemir et al., 2018), we decided to generate flies that
                                   express mHTT solely in glia so that we could compare their transcriptomic signature with that of flies
                                   expressing mHTT in neurons. We took an unbiased approach, first establishing the repertoire of evo-
                                   lutionarily conserved genes that show concordant expression changes across HD human and mouse
                                   striata and HD fly brains. We then integrated this comparative transcriptomic data with high-
                                   throughput in vivo behavioral screening to acquire insight into glial contributions to HD pathogene-
                                   sis and identify disease-modifying targets that mitigate the HD phenotype.

                                   Results
                                   The HD transcriptome is conserved among evolutionarily distant model
                                   systems
                                   To study the contributions of neurons and glia to HD pathogenesis, we first needed to define a tran-
                                   scriptomic signature that would enable us to move across species (human, mouse, and fly)
                                   (Figure 1A). We began with human tissue. Since the striatum is the brain region most prominently
                                   affected in HD, we compared the gene expression profiles of human post-mortem striatal samples
                                   from healthy individuals and patients with HD, from different stages of the disease (i.e., Vonsattel
                                   Grade 0–4) (Hodges et al., 2006; Vonsattel et al., 1985). We identified 1852 downregulated and
                                   1941 upregulated differentially expressed genes (DEGs) in patients with HD compared to healthy
                                   individuals (Figure 1B).
                                      We then reanalyzed published RNA-seq data from mouse striata using an allelic series of knock-in
                                   mouse models with varying CAG repeat lengths at 6 months of age (Langfelder et al., 2016).
                                   Because it is unclear which CAG tract length in mice most faithfully recapitulates HD pathogenesis,
                                   the triplet repeat length was treated as a continuous trait, and we narrowed our analysis to DEGs
                                   that correlate with increasing CAG repeat length. Comparing the striata of wildtype mice to the
                                   knock-in HD mouse models, there were 3575 downregulated and 3634 upregulated DEGs
                                   (Figure 1B). (The greater genome coverage provided by RNA-seq [Miller et al., 2014] yielded larger
                                   datasets for mouse and, below, for Drosophila than for humans.)
                                      We performed RNA-seq leveraging Drosophila HD models (Kaltenbach et al., 2007;
                                   Romero et al., 2008) (see Materials and methods) to compare the effect of expressing mHTT in
                                   either neurons or glia. The binary GAL4-UAS system was used to drive the expression of human
                                   mHTT either in neurons (elav >GAL4) or glia (repo >GAL4). Both full-length (HTTFLQ200) and N-termi-
                                   nal (HTTNT231Q128) models were used in this set of experiments since both the full protein and N-ter-
                                   minal HD fragments accumulate in the human brain as a result of proteolysis and mis-splicing
                                   (Kim et al., 2001; Neueder et al., 2017; Sathasivam et al., 2013; Wellington et al., 2002). Princi-
                                   pal component analysis (PCA) showed that the greatest differences between samples are attribut-
                                   able to the cell-specific drivers, and not to the use of N-terminal versus full-length protein
                                   (Figure 1—figure supplement 1). Expressing mHTT in neurons resulted in 3058 downregulated and
                                   2979 upregulated DEGs, while expressing mHTT in glia resulted in 3127 downregulated and 3159
                                   upregulated DEGs. There were also DEGs common to both neurons and glia expressing mHTT:
                                   1293 downregulated and 1181 upregulated (Figure 1B).

Onur, Laitman, et al. eLife 2021;10:e64564. DOI: https://doi.org/10.7554/eLife.64564                                                   3 of 30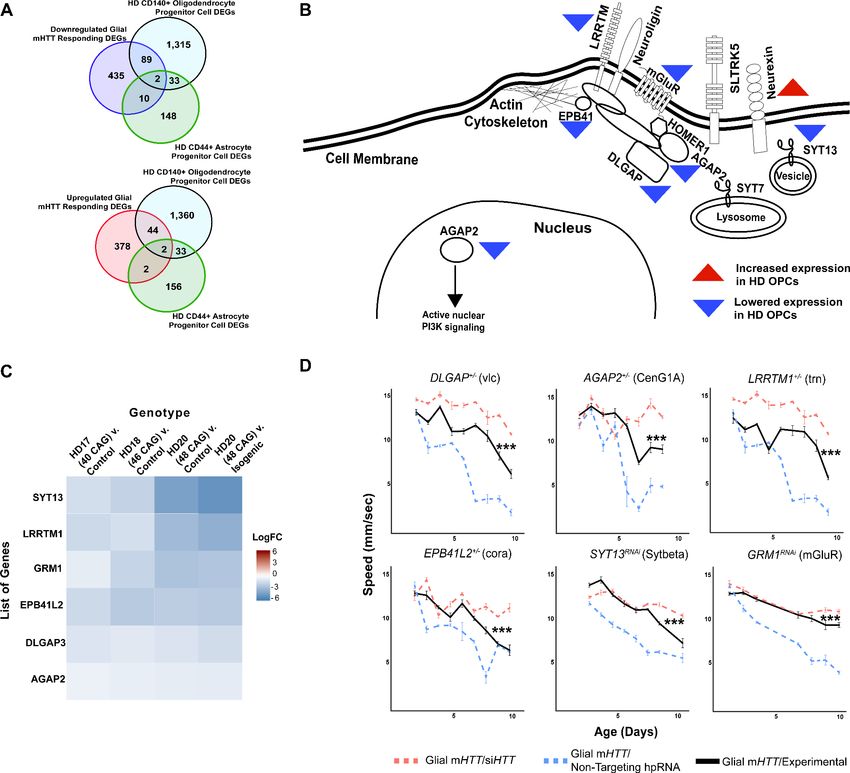
Research article                                                            Computational and Systems Biology Genetics and Genomics

Figure 1. Differentially expressed genes (DEGs) in Huntington’s disease (HD) human striatal tissue are concordantly altered in mouse and Drosophila
HD models. (A) Our approach to identifying orthologous genes in tissues from humans, mice, and Drosophila with concordant expression changes (i.e.,
upregulated or downregulated in all three systems) following mutant Huntingtin (mHTT) expression. (B) The number of DEGs in each species-specific
dataset that are downregulated (blue) or upregulated (red) (see Materials and methods). Drosophila DEGs were from flies expressing either the
N-terminal (HTTNT231Q128) or full-length mHTT (HTTFLQ200) in neurons (elav-GAL4) or glia (repo-GAL4). The DEGs in flies are grouped according to the
cell type expressing mHTT rather than the mHTT model. The cross-hatched regions of the Drosophila bars represent DEGs shared between the
neuronal and glial sets: 1293 downregulated genes and 1181 upregulated genes. (C) Points in the scatterplot represent human DEGs identified by the
strategy outlined in (A) that are concordantly dysregulated across all three species. Red nodes represent upregulated DEGs (n = 815), whereas blue
nodes represent downregulated genes (n = 791). The overlap of these concordant DEGs represents approximately 40% of genes with altered
expression in the human HD transcriptome that are upregulated (p=6.3710 158) or downregulated (p=1.6610 165). The p-value was calculated using
a random background probability distribution over 2  105 random samplings. (D) The stacked bar graph highlights that a large majority of concordant
DEGs in human HD striata and knock-in HD mouse models are also concordantly altered in Drosophila models of HD.
The online version of this article includes the following source data and figure supplement(s) for figure 1:
Source data 1. List of up- and down-regulated differentially expressed genes (DEGs) in humans, mice, and Drosophila affected by
mutant Huntingtin (mHTT).
Source data 2. Lists of up- and down-regulated differentially expressed genes (DEGs) in humans, mice, and Drosophila affected by
mutant Huntingtin (mHTT) grouped by homology for each Drosophila Huntington’s disease (HD) model.
Figure supplement 1. Expressing mutant Huntingtin (mHTT) in Drosophila glia or neurons leads to distinct gene expression profiles.

                                       With these transcriptomic signatures in hand, we were able to compare gene expression profiles
                                    across the three species. We focused on genes with significantly altered expression (using a false dis-
                                    covery rate [FDR] < 0.05; see Materials and methods) in the same direction (i.e., upregulated or
                                    downregulated) in response to mHTT expression across these three species, including both Dro-
                                    sophila HD models. We call genes that meet this criterion concordantly altered DEGs
                                    (Supplementary file 1).
                                       We compared DEGs using a graph-based approach (see Materials and methods) that allows for
                                    evolutionary divergence and convergence, instead of imposing one-to-one relationships. 815 upre-
                                    gulated DEGs observed in HD patient-derived striatal tissue had an orthologous gene in the HD
                                    mouse model and at least one Drosophila model of HD that was concordantly upregulated. Similarly,
                                    791 DEGs identified in HD patients had an orthologous gene in mouse and Drosophila models that
                                    was concordantly downregulated (Figure 1C). About 40% of the alterations in gene expression in
                                    patient striatal samples are concordant with orthologous genes in both Drosophila and mice models
                                    of HD. To determine whether this result could be an artifact of overlapping a large number of DEGs
                                    in each model, we randomly selected and overlapped 815 and 791 orthologous genes across the
                                    three species 20,000 times. Based on the resulting distribution, we concluded that the overlap of
                                    concordant, orthologous DEGs across the various HD models was not random (p=6.3710 158 and
                                    p=1.6610 165, probability distribution test).

Onur, Laitman, et al. eLife 2021;10:e64564. DOI: https://doi.org/10.7554/eLife.64564                                                         4 of 30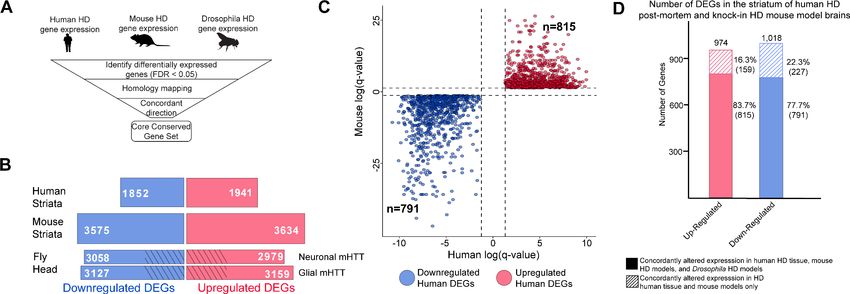
Research article Computational and Systems Biology Genetics and Genomics
To compare the consequence of expressing mHTT in glia versus neurons, we recalculated the
overlaps between the three species, distinguishing DEGs from the neuron-only and glia-only HTT-
expressing Drosophila. There were 425 concordantly upregulated and 545 concordantly downregu-
lated DEGs in glia. We also found 522 upregulated DEGs and 453 downregulated specific to neu-
rons. Out of these groups of DEGs, 310 were upregulated and 320 were downregulated in both
neurons and glia. To acknowledge the proportion of transcriptional alterations we excluded by spec-
ifying concordant expression with the HD Drosophila models, we also calculated the overlap
between concordant DEGs observed only in striata from HD patients and mice. We found that
83.7% of upregulated DEGs and 77.7% of downregulated DEGs that were altered concordantly in
human and mouse HD striata were also concordantly altered in the brains of the neuronal and/or
glial HD Drosophila models (Figure 1D). Of the genes that showed concordantly altered expression
only in human and mouse striata, 64 (40%) of the upregulated and 68 (30%) of the downregulated
DEGs did not have an ortholog in Drosophila.
Network analysis identifies biological processes disrupted by mHTT
toxicity in glia
To investigate the cellular pathophysiology represented by DEGs in neurons and glia, we con-
structed protein-protein interaction (PPI) networks using the STRING-db database (Szklarczyk et al.,
2015). The upregulated and downregulated networks of DEGs responding to mHTT expression in
neurons or glia had a significant PPI enrichment compared to networks constructed from an equiva-
lent number of random genes selected from a whole-proteome background (Supplementary file 2).
To control for potential artifacts that could arise from using the whole proteome background, we
performed a more stringent analysis using only proteins that are found in the striatum (Al-
Ramahi et al., 2018). Using average node degree and betweenness as proxies for connectivity, we
found that the glial and neuronal networks show higher network connectivity than expected by ran-
dom chance among proteins present in the striatum (Supplementary file 2).
This high connectivity suggested that the networks are enriched in specific biological processes
and/or pathways. We therefore clustered the glial mHTT response and neuronal mHTT response net-
works using the InfoMap random walks algorithm (iGraph Package for R and Python) (Rosvall and
Bergstrom, 2007). Clusters that had fewer than four nodes were filtered out of subsequent analysis.
The glial networks formed 23 and 24 clusters for upregulated and downregulated DEGs, respec-
tively. Both the upregulated and downregulated neuronal networks formed 29 clusters. We applied
this clustering method to the networks of randomly selected striatal proteins in order to determine
the expected number of clusters for networks of a similar size. Both the glial and neuronal networks
formed significantly more clusters than would be expected from random selection
(Supplementary file 2).
To gain insight into biological processes represented by each cluster, we queried the five most
significantly enriched terms (FDR < 0.05) using the GO Biological Process and Kyoto Encyclopedia of
Genes and Genomes (KEGG) terms within each cluster (Supplementary file 3). A synthesis of these
terms was used to identify clusters in both the glial and neuronal networks (Supplementary file 3,
Figure 2—figure supplement 1B, C). We compared the membership within clusters across the glial
and neuronal networks using a pairwise hypergeometric test and identified 14 clusters of upregu-
lated DEGs common to both glial and neuronal networks. Similarly, there were 15 clusters of down-
regulated DEGs common to the both networks (Figure 2—figure supplement 1A).
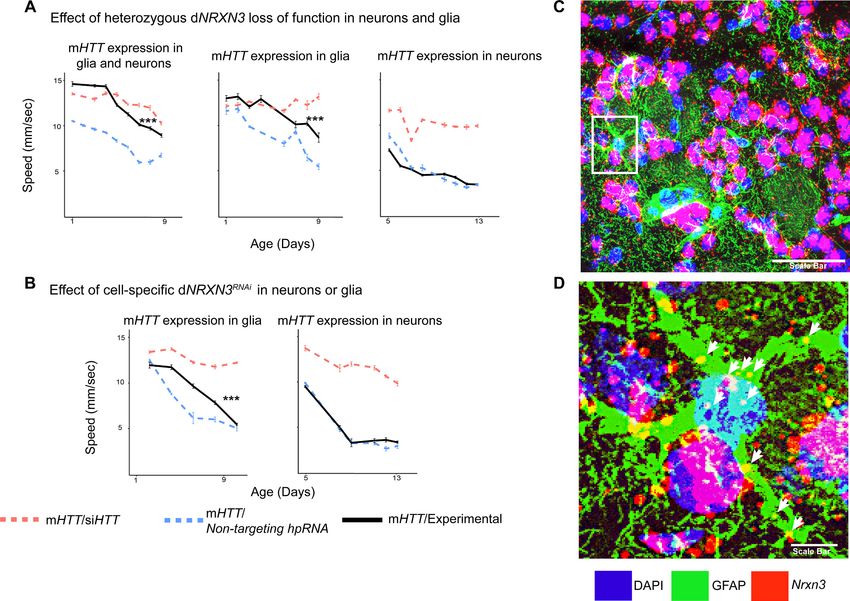
Given the aims of our study, the clusters of DEGs specific to glia (represented by nodes in Fig-
ure 2) were of particular interest to us. Six clusters were specifically upregulated in response to
mHTT expression, enriched in genes involved in transcription and chromatin remodeling, amino acid
metabolism, cell proliferation, cytokine signaling/innate immunity, arachidonic acid metabolism, and
steroid synthesis (Figure 2A). Six clusters were downregulated in response to glial mHTT expression,
containing genes involved in synapse assembly, calcium ion transport, immune system regulation,
phagocytosis, mRNA processing, and fatty acid degradation (Figure 2B).
We applied the same network analysis to genes that had concordantly altered expression in HD
patient striata and HD mouse model striata but not in HD Drosophila models (Figure 2—figure sup-
plement 2A). We observed that clusters comprising DEGs specific to the HD patients and the mouse
models were functionally related to DEGs in both the glial and neuronal networks (Figure 2—figure
supplement 2B).
Onur, Laitman, et al. eLife 2021;10:e64564. DOI: https://doi.org/10.7554/eLife.64564 5 of 30Research article Computational and Systems Biology Genetics and Genomics Figure 2. Clusters of concordant differentially expressed genes (DEGs) between human and mouse Huntington’s disease (HD) striata and Drosophila expressing mutant Huntingtin (mHTT) in glia. Clustered protein-protein interaction (PPI) networks of DEGs (STRING-db) that have higher (A) or lower (B) concordant expression in HD human tissue, an allelic series of knock-in HD mouse models, and Drosophila expressing mHTT (HTTNT231Q128 or HTTFLQ200) in glia. Clusters of DEGs (nodes) that were dysregulated in response to mHTT expression in glia are numbered and represented by open circles. Annotations listed below each network correspond to each numbered cluster and represent a synthesis of the top five most significantly enriched GO Panther Biological processes and Kyoto Encyclopedia of Genes and Genomes (KEGG) terms with a false discovery rate (FDR) < 0.05 (Supplementary file 2). Nodes represented by solid circles were dysregulated in response to mHTT expression in glia but are also significantly similar in gene membership to clusters of DEGs in response to mHTT expression in neurons (Figure 2—figure supplement 1, hypergeometric test, p
Research article                                                                Computational and Systems Biology Genetics and Genomics

Figure 3. Reducing the expression of Synapse Assembly cluster genes in glia mitigates mutant Huntingtin (mHTT)-induced behavioral impairments. (A)
Overlaps between concordant differentially expressed genes (DEGs) from the cross-species analysis defined as responding to mHTT expression in glia
and DEGs identified in Huntington’s disease (HD) human embryonic stem cells (hESCs) that have been differentiated into either CD140
+ oligodendrocyte progenitor cells (OPCs) or CD44+ astrocyte progenitor cells (APCs) (Osipovitch et al., 2019). (B) Model placing Synapse Assembly
cluster proteins into cellular context. The Synapse Assembly cluster was significantly enriched for DEGs in HD OPCs (Fisher’s exact test, p
Research article                                                            Computational and Systems Biology Genetics and Genomics

Figure 3 continued
Supplementary file 4. Control climbing data for these alleles can be found in Figure 3—figure supplement 1B. Drosophila genotypes: positive
control (w1118;UAS- non-targeting hpRNA/+; repo-GAL4,UAS-HTTNT231Q128/+), treatment control (w1118; repo-GAL4,UAS- HTTNT231Q128/UAS-siHTT), and
experimental (w1118; repo-GAL4,UAS- HTTNT231Q128/modifier).
The online version of this article includes the following source data and figure supplement(s) for figure 3:
Source data 1. Raw behavioral data for Drosophila expressing mutant Huntingtin (mHTT) in glia following reduced expression of synaptic genes.
Figure supplement 1. Suppressors of glial mutant Huntingtin (mHTT)-induced behavioral impairments among differentially expressed genes (DEGs) in
the Synapse Assembly cluster.
Figure supplement 1—source data 1. Raw behavioral data for Drosophila expressing mutant Huntingtin (mHTT) in glia following reduced expression
of synaptic genes, expanded number of genes, and alleles.

                                   exact test, p
Research article Computational and Systems Biology Genetics and Genomics
In sum, comparative transcriptomic analysis indicated that genes within the Synapse Assembly
cluster are associated with the glial response to HD, and the high-throughput behavioral assay fur-
ther defined this response as compensatory.
Decreasing neurexin expression in glia mitigates mHTT-induced
pathogenesis in both neurons and glia
NRXN3 was identified as a DEG in both our cross-species comparative transcriptomic analysis and in
the gene expression profile of the HD glial progenitor population. NRXN3 expression was lower in
the bulk HD transcriptome across species compared to their respective controls, but it was more
highly expressed in the HD OPCs than in controls. This discordance between the bulk and single-
cell-type gene expression profiles might be a result of time-dependent changes in gene expression
as neurons age, but it prevented us from classifying the NRXN3 expression changes as being com-
pensatory or pathogenic. We were particularly interested in neurexins, including NRXN3, because
they mediate contact between pre- and post-synaptic neurons (Ushkaryov et al., 1992; Zeng et al.,
2007).
We therefore asked whether downregulation of Drosophila NRXN3 (dNRXN3, also known as nrx-
1) is damaging or protective when both neurons and glia express mHTT. In the Drosophila behav-
ioral assay, heterozygous loss of dNRXN3 function in animals expressing mHTT in both neurons and
glia mitigated mHTT toxicity and improved behavior (Figure 4A, left panel). Reproducing this exper-
iment with flies expressing mHTT only in glia yielded the same benefit (Figure 4A, middle panel).
The obvious next question, given its canonical role in neuron-neuron contact, was whether dNRXN3
heterozygosity would protect against mHTT pathogenesis in neurons. Interestingly, the answer was
no (Figure 4A, right panel). Consistent with this, glia-specific knockdown of dNRXN3 (using the
repo-GAL4 driver) mitigated mHTT toxicity in glia (Figure 4B, left panel), but neuron-specific knock-
down (using the elav-GAL4 driver) of dNRXN3 did not mitigate mHTT toxicity in neurons (Figure 4B,
right panel). In sum, reducing dNRXN3 in both neurons and glia protects against glial pathogene-
sis—and the combination of neuronal and glial pathogenesis—but not neuronal pathogenesis. This
implies that mHTT disrupts some aspect of glial-neuronal interaction that is driven by the glia since
lowering expression of dNRXN3 in glia is necessary and sufficient to mitigate behavioral impairments
caused by mHTT.
To investigate whether Nrxn3 is expressed in astrocytes in the striatum of HD mice, we per-
formed in situ hybridization (ISH) in coronal sections of striatal tissue taken from a mouse model of
HD (HdhzQ175/+) to probe Nrxn3 mRNA. Nrxn3 was expressed in striatal astrocytes (Figure 4C, D,
Figure 4—figure supplement 1). In conclusion, modulating the expression genes other than mHTT
in glia could be an effective strategy for ameliorating HD-induced central nervous system (CNS)
dysfunction.
Reducing SERPINA1 function mitigates behavioral impairments in
neurons and glia, and lowers mHTT protein levels
We were curious to identify modifiers that concordantly affect mHTT-induced pathogenesis in both
neurons and glia as these might be particularly attractive therapeutic targets for HD. We were partic-
ularly interested to discover whether any such shared modifiers exert their effect by reducing mHTT
levels, which is considered a promising approach to therapy (Al-Ramahi et al., 2018; Barker et al.,
2020; Caron et al., 2020; Li et al., 2019; Tabrizi et al., 2019; Wang et al., 2014; Wood et al.,
2018; Yamamoto et al., 2000; Yao et al., 2015). We therefore again integrated network analysis
with high-throughput experimentation.
Genes were sampled from both the neuronal and glial mHTT response networks by prioritizing
those candidates with high centrality (calculated as a cumulative rank-score of node betweenness
and node degree) within each cluster. When available, we used alleles that perturb the expression or
activity of the Drosophila orthologs in the same direction as the gene expression change in the HD
patient population (Figure 5A). We screened 411 alleles, representing 248 Drosophila genes homol-
ogous to 211 human genes, for perturbations that improve the age-dependent behavior of Drosoph-
ila expressing mHTT in neurons or glia (Supplementary file 5). Alleles that ameliorated neuronal or
glial function were verified in a subsequent trial in animals expressing mHTT across the CNS (in both
neurons and glia). In all, we identified 25 genes with altered expression in HD that suppressed
Onur, Laitman, et al. eLife 2021;10:e64564. DOI: https://doi.org/10.7554/eLife.64564 9 of 30Research article Computational and Systems Biology Genetics and Genomics Figure 4. Glia-specific dNRXN3 knockdown mitigates impairments caused by mutant Huntingtin (mHTT) expression. (A) Behavioral assays (climbing speed as a function of age) showing that dNRXN3 heterozygous loss of function (LOF) ameliorates behavioral impairments caused by expression of mHTT in both neurons and glia and in glia alone, but not in neurons alone. (B) Glia-specific dNRXN3 knockdown mitigates behavioral impairments caused by mHTT expressed solely in glia; however, neuron-specific knockdown of dNRXN3 does not affect impairments induced by mHTT expressed solely in neurons. ***p
Research article                                                            Computational and Systems Biology Genetics and Genomics

Figure 5. Compensatory and pathogenic gene expression changes shared by neurons and glia in response to mutant Huntingtin (mHTT) expression.
(A) Our approach for identifying modifiers of mHTT-induced behavioral impairments common to both neurons and glia. Genes that were central to
their respective clusters were prioritized and manipulated in Drosophila expressing mHTT (HTTNT231Q128) in either neurons (elav-GAL4) or glia (repo-
GAL4). (B) Red bars represent the percent improvement in behavior over a 9-day trial compared to positive control (non-targeting hpRNA) in
Drosophila expressing mHTT in neurons and glia, after we antagonized pathogenic gene expression changes. (C) Green bars represent the percent
improvement in behavior over a 9-day trial compared to control (see B), after we mimicked compensatory gene expression alterations. In (B) and (C),
the top black bars represent the effect of directly targeting the mHTT transgene using a small interfering RNA (siRNA). Arrowheads indicate the
direction of the conserved, concordant altered expression for each gene as a result of mHTT expression in humans, mice, and Drosophila. Behavioral
assay graphs corresponding to the data presented in (B) and (C) can be found in Figure 5—figure supplement 1A. Corresponding statistical analysis
for (B) and (C) can be found in Supplementary file 6. Corresponding controls for behavioral data can be found in Figure 5—figure supplement 1B, C.
Drosophila genotypes: positive control (elavc155-GAL4/w1118;UAS- non-targeting hpRNA/+; repo-GAL4,UAS-HTTNT231Q128/+), treatment control
(elavc155-GAL4/w1118; repo-GAL4, UAS- HTTNT231Q128/UAS-siHTT), and experimental (elavc155-GAL4/w1118; repo-GAL4, UAS- HTTNT231Q128/modifier).
The online version of this article includes the following source data and figure supplement(s) for figure 5:
Source data 1. Numerical data for bar charts summarizing the improvement in behavior in Drosophila expressing mutant Huntingtin (mHTT) in neurons
and glia by manipulating common pathogenic and compensatory alterations.
Figure supplement 1. Genetic modifiers suppress behavioral impairments caused by mutant Huntingtin (mHTT) expression in neurons and glia.
Figure supplement 1—source data 1. Raw behavioral data for Drosophila expressing mutant Huntingtin (mHTT) in neurons and glia by manipulating
common pathogenic and compensatory alterations.

Onur, Laitman, et al. eLife 2021;10:e64564. DOI: https://doi.org/10.7554/eLife.64564                                                        11 of 30
Research article                                                            Computational and Systems Biology Genetics and Genomics

                                   mHTT-induced behavioral deficits in neurons, glia, or both (Figure 5B, C, Figure 5—figure supple-
                                   ment 1, Supplementary file 6).
                                       Many of the modifiers common to neuronal and glial mHTT-induced dysfunction are involved in
                                   the regulation of the actin cytoskeleton (RHOC, TIAM1, ENAH, and CFL2), vesicular trafficking
                                   (SNAP23, SNX9, and SNX18), and inflammation (JUN, GTF3A, and ATF3). Multiple reports have
                                   implicated components of these pathways in the pathogenesis of not only HD, but in other neurode-
                                   generative disorders as well (Al-Ramahi et al., 2018; Bardai et al., 2018; Bondar et al., 2018). We
                                   previously established an axis of genes with altered expression that regulate actin cytoskeleton and
                                   inflammation pathways driving forward HD pathogenesis (Al-Ramahi et al., 2018). Our current
                                   results would indicate that these pathways are not only critical to disease progression in neurons,
                                   but also in glia.
                                       We previously observed that reducing the activity of RAC GTPase, a regulator of the actin cyto-
                                   skeleton, and inflammation mediating nuclear factor kappa-light-chain-enhancer of activated B cells
                                   (NF Kappa-B) ameliorated pathogenesis by lowering mHTT protein levels through the activation of
                                   autophagy (Al-Ramahi et al., 2018). Thus, in a secondary screen we tested whether these disease
                                   modifiers common to both neurons and glia exerted their beneficial effects by lowering levels of the
                                   mutant HTT protein.
                                       We collected protein lysates from Drosophila expressing mHTT across the CNS that also bore
                                   alleles that suppressed mHTT-induced behavioral deficits in both neurons and glia. We assessed the
                                   quantity of mHTT protein in these lysates by western blot, comparing experimental (candidate modi-
                                   fiers) and control animals (carrying a non-targeting hpRNA). This secondary screen identified
                                   Spn42De as a modifier whose knockdown lowered mHTT levels. Spn42De is one of the four Dro-
                                   sophila homologues of human SERPINA1 (which encodes alpha-1-antitrypsin, a member of a large
                                   group of protease inhibitors). Spn42De, human SERPINA1, and mouse Serpina1 are all upregulated
                                   in HD, and they are part of the Wound Healing and Inflammation cluster in both the neuronal and
                                   glial mHTT response networks (Figure 2—figure supplement 1C). Knockdown of Spn42De (hence-
                                   forth dSERPINA1) in Drosophila expressing mHTT in both neurons and glia mitigated behavioral
                                   impairments (Figure 6A). In independent immunoblots, dSERPINA1 knockdown consistently
                                   reduced mHTT protein levels in lysates extracted from the heads of Drosophila expressing mHTT in
                                   both neurons and glia (Figure 6B, C). As a control, we performed immunoblot analysis of lysates
                                   from a green fluorescent protein (GFP) reporter line to ensure that this allele of dSERPINA1 did not
                                   reduce the function of the GAL4-UAS system (Figure 6—figure supplement 1).
                                       To validate this observation across model systems, we performed homogenous time-resolved
                                   fluorescence (HTRF) on HdhQ111/Q7 mouse striatal cell lysates that were treated with either a pool of
                                   non-targeting scramble small interfering RNAs (siRNAs), a pool of siRNAs against Htt, or a pool of
                                   siRNAs against Serpina1a (the murine ortholog of SERPINA1). Serpina1a knockdown significantly
                                   reduced mHTT signal (Figure 6D). Knockdown of SERPINA1 thus protected against mHTT toxicity in
                                   neurons and glia by reducing levels of mutant HTT. Verifying this effect in multiple model organisms
                                   increases confidence in this observation and suggests that SERPINA1 could potentially prove useful
                                   as a target for treating HD. Interestingly, SERPINA1 expression is low in the healthy brain but it is
                                   upregulated in several disease conditions, consistent with a potential role in neuroinflammation
                                   (Abu-Rumeileh et al., 2020; Cabezas-Llobet et al., 2018; Gollin et al., 1992; Peng et al., 2015).
                                   We found increased Serpina1a protein staining in the striatum of HdhzQ175/+ compared to wildtype
                                   mice at 8.5 months (Figure 6—figure supplement 2), confirming its upregulation from the transcrip-
                                   tomic data. Previously we had shown that other genes in the subnetwork implicated in neuroinflam-
                                   mation can be manipulated to lower mHTT protein levels (Al-Ramahi et al., 2018). SERPINA1 may
                                   thus warrant investigation as a target for other neurological disorders as well.

                                   Discussion
                                   We found a high degree of overlap of DEGs across tissues from human HD brains, brains of HD
                                   mice, and flies that express mHTT in glia. This may seem unexpected given obvious differences
                                   between vertebrate and Drosophila glia, such as a lack of documented microglia or distinct morphol-
                                   ogy of endothelial/glial cells forming the blood-brain barrier in Drosophila (Freeman and Doherty,
                                   2006). Our observations are however consistent with previous evidence that Drosophila glia perform
                                   many of the same functions as mammalian astrocytes, oligodendrocytes, endothelial cells, and

Onur, Laitman, et al. eLife 2021;10:e64564. DOI: https://doi.org/10.7554/eLife.64564                                                  12 of 30
Research article Computational and Systems Biology Genetics and Genomics Figure 6. Antagonizing the pathogenic overexpression of SERPINA1 in neurons and glia mitigates mutant Huntingtin (mHTT)-induced behavioral impairments and lowers mHTT protein levels in Drosophila and Huntington’s disease (HD) mouse striatal cells. (A) Behavioral assays following knockdown of dSERPINA1 in Drosophila expressing mHTT in neurons and glia. *** indicates p
Research article                                                            Computational and Systems Biology Genetics and Genomics

                                   influences HD pathogenesis (Benraiss et al., 2016; Bradford et al., 2009; Garcia et al., 2019;
                                   Huang et al., 2015; Osipovitch et al., 2019). More recently, it was discovered that transcription fac-
                                   tors involved in glial differentiation and myelin synthesis are downregulated in glial progenitor cells
                                   (Osipovitch et al., 2019). Yet despite this progress, the overall contributions of glial genes to synap-
                                   tic impairments and other key neurodegenerative pathologies remain poorly understood. The
                                   genetic malleability of Drosophila enabled us to thoroughly examine the neuron-glia interface from
                                   both the glial and the neuronal directions.
                                       Synaptic dysfunction is a common theme among many neurodegenerative disorders
                                   (McInnes et al., 2018; Phan et al., 2017; Prots et al., 2018). While it is clear that the dysfunction of
                                   the glia-synapse interface is central to the pathophysiology of neurodegeneration (Filipello et al.,
                                   2018; Garcia et al., 2019; Lian et al., 2015; Litvinchuk et al., 2018), the underlying mechanisms
                                   remain underexplored relative to the interactions between pre- and post-synaptic neurons. Our
                                   results support the observation that the expression of mHTT in glia is sufficient to drive synaptic dys-
                                   function (Wood et al., 2018). In HD, pre-synaptic neurons release elevated levels of glutamate into
                                   the synapse, driving medium spiny neurons (MSNs) into excitotoxicity (Estrada Sánchez et al.,
                                   2008; Hong et al., 2016). Hyperactivity of receptors at the post-synaptic densities sensitizes MSNs
                                   to excitotoxicity, further contributing to neurodegeneration (Estrada Sánchez et al., 2008). Astro-
                                   cytic mHTT expression may contribute to neuronal excitotoxicity by elevating levels of glutamate,
                                   potassium, and calcium at the synapse (Garcia et al., 2019; Jiang et al., 2016; Tong et al., 2014).
                                       Modifiers of mHTT-induced pathogenesis identified in our study, such as metabotropic glutamate
                                   receptors and the scaffold protein HOMER1, regulate calcium and glutamate signaling in astrocytes
                                   (Buscemi et al., 2017; Spampinato et al., 2018). Reducing the expression of these genes could pre-
                                   vent excess calcium and glutamate from accumulating at the synapse. Indeed, we previously found
                                   that HD neurons downregulate the expression of genes involved in calcium signaling in an effort to
                                   compensate for HD pathogenesis (Al-Ramahi et al., 2018). Glial calcium signaling can also influence
                                   neuronal activity, however, at the neuronal soma (Weiss et al., 2019). In Drosophila, cortical glia
                                   modulate neuronal activity through potassium buffering, a process that is regulated by calcium-
                                   mediated endocytosis of potassium channels (Weiss et al., 2019). Glia can also physically disrupt
                                   synapses in disease states: Förster resonance energy transmission in vivo revealed that, in HD, the
                                   distances between astrocytes and pre-synaptic neurons are increased at the cortico-striatal circuit
                                   (Octeau et al., 2018). Thus, knocking down the genes in the Synapse Assembly cluster could reduce
                                   physical interaction between glia and synapses, promoting normal synaptic function.
                                       If in HD synapses grow more fragile and fewer in number as the disease progresses, why would
                                   downregulating the expression of glial genes required for synapse formation and function be protec-
                                   tive? We postulate it is for the same reason that downregulating calcium-signaling genes is compen-
                                   satory (Al-Ramahi et al., 2018): the brain is attempting to protect against the excitotoxicity
                                   described above. Mutant HTT disrupts neuronal development (Ring et al., 2015) and skews embry-
                                   onic neurogenesis toward producing more neurons (Barnat et al., 2020); by the time HD mutation
                                   carriers reach the age of 6 years, they have greatly enlarged striata and functional hyperconnectivity
                                   to the cerebellum (Tereshchenko et al., 2020). The more hyperconnected, the more abrupt the loss
                                   of these connections, and the more rapid the striatal atrophy that follows Tereshchenko et al.,
                                   2020. The hyperfunction of a given brain region puts considerable strain on the circuit, and it seems
                                   that over the course of a lifetime, the brain keeps trying to compensate for the abnormalities that
                                   arise at different stages of HD. The recent observation that deletion of astrocytic neurexin-1a attenu-
                                   ates synaptic transmission but not synapse number supports this hypothesis (Trotter et al., 2020).
                                       We do not think that the protection provided by modifiers in this cluster is limited to modulating
                                   neurotransmission. In astrocytes, calcium signaling also controls the activity of reactive astrocytes
                                   (Buscemi et al., 2017). Astrogliosis, or the proliferation of immune active astrocytes, is typically
                                   observed at later stages of HD (Al-Dalahmah et al., 2020; Buscemi et al., 2017). These immune-
                                   activated glia not only eliminate synapses (Liddelow et al., 2017; Sofroniew, 2009) but can also
                                   transmit mHTT aggregates through the synapse (Donnelly et al., 2020). In Drosophila, knockdown
                                   of draper prevents astrocytic phagocytosis and stops the spread of mHTT protein aggregates from
                                   pre-synaptic neurons to the post-synaptic compartment (Donnelly et al., 2020; Pearce et al.,
                                   2015). mHTT protein can also enter the synaptic space by endosomal/lysosomal secretion mediated
                                   by Syt7 (Trajkovic et al., 2017). In this study, we observed that knockdown of synaptotagmins in
                                   Drosophila ameliorates glial mHTT-induced dysfunction. Thus, knocking down genes in the Synapse

Onur, Laitman, et al. eLife 2021;10:e64564. DOI: https://doi.org/10.7554/eLife.64564                                                  14 of 30
Research article Computational and Systems Biology Genetics and Genomics
Assembly cluster could also benefit the circuit by reducing the transmission of aggregated mHTT
protein from pre- to post-synaptic neurons.
Intriguingly, loss-of-function variants in NRXN1-3, NLGN1, NLGN3, DLGAP3, and LRRTM1 have
been associated with various disorders of synaptic dysfunction, including autism spectrum disorder
(ASD), schizophrenia, and obsessive compulsive disorder (OCD) (Nakanishi et al., 2017;
Jamain et al., 2003; Südhof, 2008; Vaags et al., 2012; Wang et al., 2018; Windrem et al., 2017).
We speculate that the consequences of loss of function of these genes depend on both dosage and
context: modest reductions of gene expression can be protective in the context of HD pathogenesis,
whereas a more severe loss of function results in ASD and OCD. It is interesting that many HD
patients develop schizophrenia-like psychosis, suggesting that the compensatory mechanism at
place in HD may eventually lead to schizophrenia-like symptoms (Connors et al., 2020;
Tsuang et al., 2018). Future studies should investigate whether these loss-of-function variants asso-
ciated with neurodevelopmental and psychiatric disorders alter the age of disease onset in patients
with HD. It could be of particular interest to assess if these neurodevelopmental and psychiatric-
associated variants ameliorate neurodevelopmental changes observed early in HD or blunt synaptic
hyperactivity later in disease.
Materials and methods
Key resources table
Reagent type
(species) or Additional
resource Designation Source or reference Identifiers information
Antibody Anti-HTT EMD Millipore mAb5490, WB (1:500)
(mouse monoclonal) RRID:AB_2233522
Antibody Anti-GFP ThermoFisher A-11122, WB (1:1000)
(rabbit polyclonal) RRID:AB_221569
Antibody Anti-HTT Novartis 2B7 HTRF (0.023 mg/mL)
(mouse monoclonal)
Antibody Anti-laminC Hybridoma Bank LC28.26, WB (1:1000)
(mouse monoclonal) RRID:AB_528339
Antibody Anti-GFAP DAKO Z0334, IF (1:500)
(rabbit polyclonal) RRID:AB_10013382
Antibody Alpha-tubulin Abcam EP1332Y, WB (1:1000)
(rabbit polyclonal) RRID:AB_922700
Antibody Anti-HTT SigmaAldrich mAb2166, HTRF (1.4 mg/mL)
(mouse monoclonal) RRID:AB_11213141
Antibody Anti-rabbit IgG Alexa 488 Invitrogen A-11008, IF (1:500)
(goat polyclonal) RRID:AB_143165
Antibody Anti-Serpina1a Invitrogen PA5-16661, IF (1:250)
(rabbit polyclonal) RRID:AB_10985745
Antibody RDye 680RD anti-Rabbit LI-COR Biosciences 925-68071, WB (1:5000)
IgG RRID:AB_2721181
(goat polyclonal)
Antibody IRDye 800CW anti-Mouse IgG LI-COR Biosciences 925-32210, WB (1:5000)
(goat polyclonal) RRID:AB_2687825
Chemical Lipofectamine 2000 Life Technologies 11668
compound, drug
Chemical EDTA-free protease inhibitor Calbiochem 539134
compound, drug
Commercial miRNeasy Mini Kit Qiagen 217004
assay, kit
Commercial Illumina TruSeq Illumina 20020595
assay, kit Stranded mRNA
Commercial Tyramide-Cy3 Plus kit Perkin Elmer NEL744001KT
assay, kit
Continued on next page
Onur, Laitman, et al. eLife 2021;10:e64564. DOI: https://doi.org/10.7554/eLife.64564 15 of 30Research article Computational and Systems Biology Genetics and Genomics
Continued
Reagent type
(species) or Additional
resource Designation Source or reference Identifiers information
Commercial PicoGreen Quant-iT PicoGreen P7589
assay, kit dsDNA Assay Kit
Cell line (Mus STHdhQ111/Q7 Cells Coriell Cell CH00096
musculus) Repositories
Strain, strain White mutant, Bloomington 3605 w1118
background background genotype Drosophila
(Drosophila) Stock Center
Genetic reagent Non-targeting hpRNA Vienna 13974
(Drosophila) Drosophila
Resource Center
Strain, strain repo-Gal4 Bloomington 7415 w1118; P{w+m*=GAL4}
background Drosophila repo/TM3, Sb1
(Drosophila) Stock Center
Strain, strain elav-Gal4 Bloomington 458 P{GawB}elavC155
background Drosophila
(Drosophila) Stock Center
Genetic reagent N-terminal HD model Botas Laboratory Branco et al., 2008 UAS-HTTNT231Q128/TM6B,
(Drosophila) tubulin-GAL80 (N-terminal)
Genetic reagent Full-length HD model Botas Laboratory This paper UAS-HTTFL200Q/CyO (full-length)
(Drosophila)
Genetic reagent siRNA against Botas Laboratory UAS-siHTT
(Drosophila) human mutant HTT Kaltenbach et al., 2007
Genetic reagent Classic CenG1A loss- Bloomington 44301 CenG1ALOF or y1w*;
(Drosophila) of-function allele Drosophila Mi{MIC}CenG1AMI06024 (Figure 3D)
Stock Center
Genetic reagent Classic vlc loss- Bloomington 10366 vlcLOF or y1w67c23;P{w+mc =
(Drosophila) of-function allele Drosophila lacW}vlck01109/CyO
Stock Center (Figure 3D)
Genetic reagent Classic trn loss- Bloomington 4550 trnLOF or
(Drosophila) of-function allele Drosophila y1w67c23;P{w+mc =
Stock Center lacW}trnS064117/TM3,
Sb1 Ser1 (Figure 3D)
Genetic reagent Classic cora loss- Bloomington 9099 coraLOF or P{ryt7.2=neoFRT}
(Drosophila) of-function allele Drosophila 43D cora14/CyO (Figure 3D)
Stock Center
Genetic reagent RNAi against Sytbeta Vienna 106559 UAS-SytbetahpRNA (Figure 3D)
(Drosophila) Drosophila
Resource Center
Genetic reagent RNAi against mGluR National Institute 11144 R-3 UAS-mGluRRNAi (Figure 3D)
(Drosophila) of Genetics, Japan
Genetic reagent Neuronal mCD8:: Bloomington 5146 P{w+mW.hs=GawB}elavC155,
(Drosophila) GFP reporter line Drosophila P{w+mC = UAS-mCD8::GFP.L}
Stock Center Ptp4E[LL4], P{ry[+t7.2]=hsFLP}1, w*
Genetic reagent Classical loss of Bloomington Provided in
(Drosophila) function and Drosophila Supplementary files 4 and 5
overexpression alleles in Stock Center
Drosophila
Genetic reagent RNAi alleles in Vienna Provided in
(Drosophila) Drosophila Drosophila Supplementary files 4 and 5
Resource Center
Genetic reagent Cytological GenetiVision Provided in
(Drosophila) duplication Supplementary files 4 and 5
alleles in
Drosophila
Genetic reagent HdhzQ175 Mice Jackson Laboratories 027410 B6J.129S1-Htttm
(M. musculus) 1Mfc/190ChdiJ
Continued on next page
Onur, Laitman, et al. eLife 2021;10:e64564. DOI: https://doi.org/10.7554/eLife.64564 16 of 30Research article Computational and Systems Biology Genetics and Genomics
Continued
Reagent type
(species) or Additional
resource Designation Source or reference Identifiers information
Recombinant pMF3 Vector Drosophila 1237
DNA reagent Genome
Resource
Center
Software, Adept Desktop Omron N/A
algorithm
Software, Video Savant IO Industries N/A
algorithm
Software, MatLab with Image MathWorks https://www.mathworks.
algorithm Processing Toolkit and com/products/matlab.html
Statistics Toolkit
Software, RSLogix Rockewell Automation N/A
algorithm
Software, Ultraware Rockewell Automation N/A
algorithm
Software, Assay Control SRI International N/A
algorithm
Software, FastPhenoTrack SRI International N/A
algorithm Vision Processing
Software, TrackingServer SRI International N/A
algorithm Data Management
Software, ScoringServer SRI International N/A
algorithm Behavioral Scoring
Software, Trackviewer SRI International N/A
algorithm Visual Tracking
and Viewing
Software, Illustrator CC Adobe https://www.adobe.com
algorithm
Software, R R Project for https://www.r-project.org/
algorithm Statistical Computing
Software, Fiji The Fiji Team https://fiji.sc/
algorithm
Software, Image Studio Lite LI-COR Biosciences https://www.licor.com
algorithm /bio/image-studio-lite/
Software, Bowtie Langmead and http://bowtie-bio.source
algorithm Salzberg, 2012 forge.net/index.shtml
Software, RSEM Li and Dewey, 2011 https://github.com/
algorithm deweylab/RSEM
Software, DESeq2 Love et al., 2014 https://bioconductor.org
algorithm /packages/release
/bioc/html/DESeq2.html
Software, DIOPT Hu et al., 2011 https://www.flyrnai.org/cgi-
algorithm bin/DRSC_orthologs.pl
Software, MGI The Mouse http://www.informatics
algorithm Genome Database .jax.org/genes.shtml
Software, STRING Szklarczyk et al., 2015 https://string-db.org/
algorithm
Software, InfoMap Rosvall https://cran.r-project.org/web/
algorithm and Bergstrom, 2008 packages/igraph/index.html
Software, Cytoscape The Cytoscape https://cytoscape.org
algorithm Consortium
Continued on next page
Onur, Laitman, et al. eLife 2021;10:e64564. DOI: https://doi.org/10.7554/eLife.64564 17 of 30Research article Computational and Systems Biology Genetics and Genomics
Continued
Reagent type
(species) or Additional
resource Designation Source or reference Identifiers information
Transfected AllStars Negative Qiagen 1027280
construct (M. Control siRNA (Scramble)
musculus)
Transfected Htt SMARTPool siRNAs Horizon Discovery L-040632-01-0005 50 - GAAAUUAAGGUUCUGUUGA-30
construct (M. Limited 50 - CCACUCACGCCAACUAUAA-30
musculus) 50 - GAUGAAGGCUUUCGAGUCG-30
50 - UAACAUGGCUCAUUGUGAA-30
Transfected Serpina1a SMART Horizon L-043380-01-0005 50 - GAAUAUAACUUGAAGACAC-30
construct (M. Pool siRNAs Discovery Limited 50 -GGGCUGACCUCUCCGGAAU-30
musculus) 50 - UGGUAGAUCCCACACAUAA-30
50 - GAAAGAUAGCUGAGGCGGU-30
Sequence-based Primers for cloning This paper See experimental Forward
reagent human HTT model detail 50 -gaattcGCACCGACC
AAAGAAAGAAC-30
Reverse
50 -tctagaGGCAGAAGG
TTCACCAGGTA-30
Sequence-based Primers for generating Allen Brain Atlas https://portal. Forward: 50 -
reagent in situ probes brain-map.org/ GCGAATTAACCCTCACTAAA
for mouse GGGTCCTTCCCCTTTCCTCCTAA-30
Nrxn3 including Reverse:
RNA 50 -GCGTAATACGACTCACTATAGG
polymerase GCAGGCATGCTCTGTACTCCA-30
promoter
sequences for
T3 (forward)
and T7
(reverse)
Lead contact and material availability
Further information and requests for resources and reagents should be directed to and will be ful-
filled by the lead contact, Juan Botas (jbotas@bcm.edu).
Drosophila models
We began with Drosophila models expressing either N-terminal human HTT (HTTNT231Q128) or full-
length HTT (HTTFLQ200) (Kaltenbach et al., 2007; Romero et al., 2008). The mHTT was expressed
using either a pan-neuronal (elav) or a pan-glial driver (repo). Mutant strains for screening were
obtained from Bloomington Drosophila Stock Center, GenetiVision, and the Vienna Drosophila
Resource Center. All strains were maintained at 18˚C in standard molasses, yeast extract, and agar
media until their experimental use. For RNA-sequencing, the full-length models were raised at 29˚C
and the N-terminal models were raised at 28˚C. All behavioral experiments were performed on
females raised at 28˚C.
In Figure 3D, we used the following mutants to assess the effect of reduced expression of synap-
tic genes in mHTT animals on behavior: UAS-non-targetinghpRNA (Vienna Drosophila Resource Cen-
ter, ID:13974), CenG1ALOF or y1w*;Mi{MIC}CenG1AMI06024 (Bloomington Drosophila Stock Center,
ID: 44301), vlcLOF or y1w67c23;P{w+mc = lacW}vlck01109/CyO (Bloomington Drosophila Stock Center,
ID: 10366), trnLOF or y1w67c23;P{w+mc = lacW}trnS064117/TM3, Sb1 Ser1 (Bloomington Drosophila
Stock Center, ID: 4550), coraLOF or P{ryt7.2=neoFRT}43D cora14/CyO (Bloomington Drosophila Stock
Center, ID: 9099), UAS-SytbetahpRN A (Vienna Drosophila Resource Center, ID:106559), and UAS-
mGluRRNAi (National Institute of Genetics, Japan, ID: 11144-R3).
To generate Drosophila that expressed siRNA that knocked down human HTT (UAS-siHTT), we
cloned a 378 bp inverted EcoRI, XbaI fragment of N-terminal Htt into the pMF3 vector (Drosophila
Genome Resource Center). This fragment maps to base pairs 406–783 of the human mRNA Hunting-
tin, which we cloned using the following primers:
Forward 50 -gaattcGCACCGACCAAAGAAAGAAC-30
Onur, Laitman, et al. eLife 2021;10:e64564. DOI: https://doi.org/10.7554/eLife.64564 18 of 30Research article Computational and Systems Biology Genetics and Genomics
Reverse 50 -tctagaGGCAGAAGGTTCACCAGGTA-30
We first digested the PCR product with EcoRI and ligated it with itself to obtain inverted repeats.
We then digested the inverted repeat with XbaI and pasted the fragment into the pMF3 vector (also
cut with XbaI); the resulting plasmid was injected into Drosophila embryos using standard methods
(Dietzl et al., 2007). We validated that this line lowers mHTT levels.
STHdhQ111/Q7 mouse striatal cells
Immortalized mouse striatal cells heterozygous for mHTT (STHdhQ111/Q7) were obtained from Coriell
Cell Repositories (Camden, NJ) and cultured in DMEM (Life Technologies, cat. no. 11965) supple-
mented with 10% fetal bovine serum (Life Technologies, cat. no. 10082–147). The cells were tested
every two months by a TransDetect PCR Mycoplasma Detection Kit (Transgen Biotech, cat. no.
FM311-01) to ensure that they are mycoplasma free. The identity has not been authenticated by STR
profiling, but has been validated by western blot, morphology, and phenotypic experiments.
DEG identification in Drosophila HD models
We performed RNA-seq on head tissue collected from Drosophila expressing N-terminal (UAS-
HTTNT231Q128) or full-length (UAS-HTTFLQ200) human mHTT in neurons (elav-GAL4) or glia (repo-
GAL4). For each combination of HD model and driver, RNA-seq was performed at three timepoints
to capture the early, middle, and late phases of disease pathogenesis, corresponding to behavioral
deficits caused by mHTT-induced neuronal or glial dysfunction. At each timepoint, samples for HD
and age-matched controls were collected in triplicate. Drosophila expressing the N-terminal con-
struct and corresponding controls were obtained at 7, 9, and 11 days post-eclosion for the neuronal
driver, and at 5, 7, and 8 days post-eclosion for the glial driver. Drosophila expressing the full-length
construct, samples were obtained at 18, 20, and 22 days post-eclosion for both the neuronal and
glial driver. For RNA-seq, the neuronal N-terminal, glial N-terminal, and glial full-length model Dro-
sophila were raised at 28˚C. The neuronal full-length model Drosophila were raised at 29˚C. For each
genotype at each timepoint, we collected an equivalent number of control animals (elav-GAL4 or
repo-GAL4) that were raised in the same conditions.
Three replicates of 50 virgin females were collected for each genotype and timepoint. Animals
were aged in the appropriate temperature and were transferred to fresh food daily until tissue was
harvested. At the selected ages, animals were transferred to 1.5 mL tubes, flash frozen in liquid
nitrogen, vigorously shaken, and then sieved to collect 50 heads/genotype/replica (~5 mg tissue/rep-
lica). Total RNA was extracted using the miRNeasy Mini Kit (Qiagen cat. no. 210074).
RNA-seq profiling and preprocessing was performed by Q2 Solutions (Morrisville, NC). Samples
were converted into cDNA libraries using the Illumina TruSeq Stranded mRNA sample preparation
kit (Illumina cat. no. 20020595) and were sequenced using HISeq-Sequencing-2 50 bp-PE. Initial
analysis was performed using Q2 Solution in-house mRNAv7 pipeline with a median of 49 million
actual reads. After adapter sequences were removed, the reads were aligned to the Drosophila mel-
anogaster transcriptome using Bowtie version 0.12.9 (Langmead and Salzberg, 2012). Expression
was quantified using RSEM version 1.1.19, resulting in a median of 11,214 genes and 18,604 iso-
forms detected (Li and Dewey, 2011).
Homology mapping of HD DEGs by network-based intersection
Three homology maps were constructed to define conserved genes that were concordantly dysregu-
lated in response to mHTT toxicity: a Drosophila-human map, a Drosophila-mouse map, and a
mouse-human map. The Drosophila-human map and Drosophila-mouse map were both obtained
from DIOPT version 6.0.2 (Hu et al., 2011). To capture homology that results from evolutionary con-
vergence and divergence, we included lower DIOPT scores between Drosophila and mammals
instead of fitting one-to-one mappings between these species. The mouse-human homology map-
ping was obtained from the Mouse Genome Informatics (MGI) database hosted by Jackson Labora-
tories (Blake et al., 2017).
We integrated these three homology maps by representing each map as an undirected bipartite
graph, where nodes are genes of one species and edges represent homology between two genes
across species. All components were then merged to form an undirected graph where each node
represents a gene name and corresponding species. We applied this integrated homology map
Onur, Laitman, et al. eLife 2021;10:e64564. DOI: https://doi.org/10.7554/eLife.64564 19 of 30You can also read