A Brownian ratchet model for DNA loop extrusion by the cohesin complex - eLife
←
→
Page content transcription
If your browser does not render page correctly, please read the page content below
RESEARCH ARTICLE

                                    A Brownian ratchet model for DNA loop
                                    extrusion by the cohesin complex
                                    Torahiko L Higashi1, Georgii Pobegalov2,3, Minzhe Tang1, Maxim I Molodtsov2,3*,
                                    Frank Uhlmann1*
                                    1
                                     Chromosome Segregation Laboratory, The Francis Crick Institute, London, United
                                    Kingdom; 2Mechanobiology and Biophysics Laboratory, The Francis Crick Institute,
                                    London, United Kingdom; 3Department of Physics and Astronomy, University
                                    College London, London, United Kingdom

                                    Abstract The cohesin complex topologically encircles DNA to promote sister chromatid
                                    cohesion. Alternatively, cohesin extrudes DNA loops, thought to reflect chromatin domain
                                    formation. Here, we propose a structure-based model explaining both activities. ATP and DNA
                                    binding promote cohesin conformational changes that guide DNA through a kleisin N-gate into a
                                    DNA gripping state. Two HEAT-repeat DNA binding modules, associated with cohesin’s heads and
                                    hinge, are now juxtaposed. Gripping state disassembly, following ATP hydrolysis, triggers
                                    unidirectional hinge module movement, which completes topological DNA entry by directing DNA
                                    through the ATPase head gate. If head gate passage fails, hinge module motion creates a Brownian
                                    ratchet that, instead, drives loop extrusion. Molecular-mechanical simulations of gripping state
                                    formation and resolution cycles recapitulate experimentally observed DNA loop extrusion
                                    characteristics. Our model extends to asymmetric and symmetric loop extrusion, as well as z-loop
                                    formation. Loop extrusion by biased Brownian motion has important implications for chromosomal
                                    cohesin function.

*For correspondence:
m.molodtsov@ucl.ac.uk (MIM);
                                    Introduction
frank.uhlmann@crick.ac.uk (FU)      Cohesin is a member of the Structural Maintenance of Chromosomes (SMC) family of ring-shaped
                                    chromosomal protein complexes that are central to higher order chromosome organization (Hir-
Competing interests: The
                                    ano, 2016; Uhlmann, 2016; Yatskevich et al., 2019). Cohesin holds together replicated sister chro-
authors declare that no
                                    matids from the time of their synthesis in S phase, until mitosis, to ensure their faithful segregation
competing interests exist.
                                    during cell divisions (Guacci et al., 1997; Michaelis et al., 1997). In addition, budding yeast cohesin
Funding: See page 31                participates in mitotic chromosome condensation, while higher eukaryotic cohesin impacts gene reg-
Received: 14 February 2021          ulation by defining boundary elements during interphase chromatin domain formation
Accepted: 10 June 2021              (Parelho et al., 2008; Wendt et al., 2008). Cohesin is also recruited to sites of double-stranded
Published: 26 July 2021             DNA breaks to promote DNA repair by homologous recombination and to stalled DNA replication
                                    forks to aid restart of DNA synthesis (Ström et al., 2004; Unal et al., 2004; Tittel-Elmer et al.,
Reviewing editor: Megan C
King, Yale School of Medicine,
                                    2012). Understanding how cohesin carries out all these biological functions requires the elucidation
United States                       of the molecular mechanisms by which cohesin interacts with DNA, as well as how cohesin estab-
                                    lishes interactions between more than one DNA.
   Copyright Higashi et al. This
                                        Cohesin’s DNA binding activity is contained within its unique ring architecture (Gligoris et al.,
article is distributed under the
                                    2014; Huis in ’t Veld et al., 2014). Two SMC subunits, Smc1Psm1 and Smc3Psm3, form long flexible
terms of the Creative Commons
Attribution License, which          coiled coils that are connected at one end by a dimerization interface known as the hinge (generic
permits unrestricted use and        gene names are accompanied by fission yeast subunit names in superscript; fission yeast cohesin
redistribution provided that the    was used for the experiments and structural analyses in this study, see Figure 1A). At the other end
original author and source are      lie ABC transporter-type ATPase head domains whose dimerization is regulated by ATP binding.
credited.                           The two SMC heads are further connected by a kleisin subunit, Scc1Rad21. The kleisin N-terminus

Higashi et al. eLife 2021;10:e67530. DOI: https://doi.org/10.7554/eLife.67530                                                       1 of 35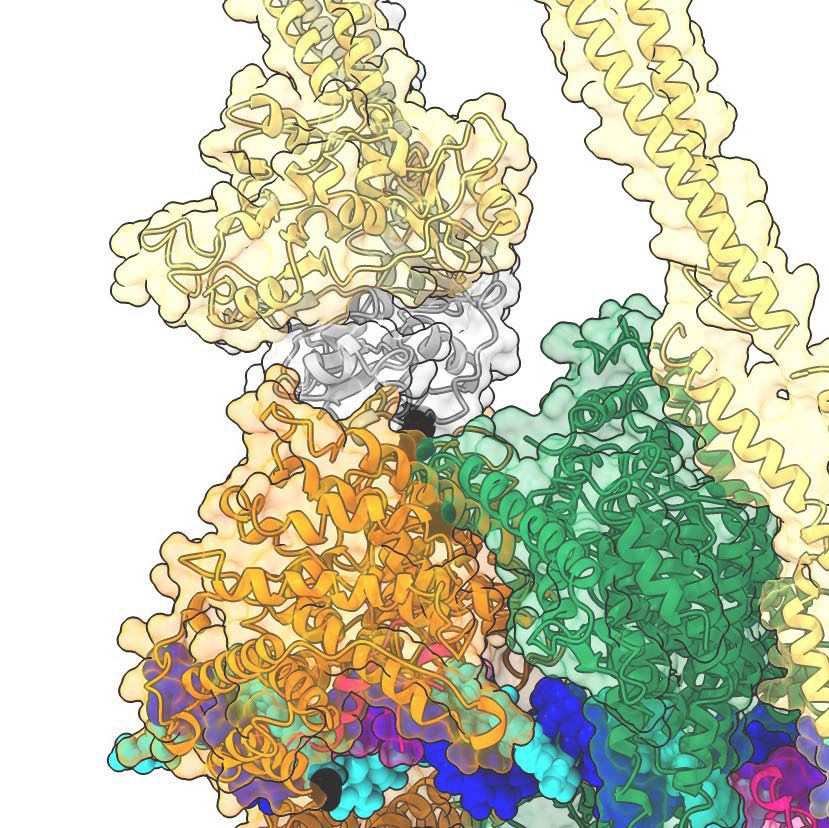
Research article                                               Chromosomes and Gene Expression Computational and Systems Biology

                                    eLife digest When a cell divides, it has to ensure that each of its daughter cells inherits one
                                    copy of its genetic information. It does this by duplicating its chromosomes (the DNA molecules that
                                    encode the genome) and distributing one copy of each to its daughter cells. Once a cell duplicates a
                                    chromosome, the two identical chromosomes must be held together until the cell is ready to divide
                                    in two. A ring-shaped protein complex called cohesin does this by encircling the two chromosomes.
                                    Cohesin embraces both chromosome copies, as they emerge from the DNA replicating machinery.
                                    The complex is formed of several proteins that bind to a small molecule called ATP, whose arrival
                                    and subsequent breakdown release energy.
                                        Cohesin also interacts with DNA in a different way: it can create loops of chromatin (the complex
                                    formed by DNA and its packaging proteins) that help regulate the activity of genes. Experiments
                                    performed on single molecules isolated in the laboratory show that cohesin can form a small loop of
                                    DNA that is then enlarged through a process called DNA loop extrusion. However, it is not known
                                    whether loop extrusion occurs in the cell.
                                        Although both of cohesin’s roles have to do with how DNA is organised in the cell, it remains
                                    unclear how a single protein complex can engage in two such different activities. To answer this
                                    question, Higashi et al. used a structure of cohesin from yeast cells gripping onto DNA to build a
                                    model that simulates how the complex interacts with chromosomes and chromatin. This model
                                    suggested that when ATP is broken down, the cohesin structure shifts and DNA enters the ring,
                                    allowing DNA to be entrapped and chromosomes to be bound together. However, a small change
                                    in how DNA is gripped initially could prevent it from entering the ring, creating a ratchet mechanism
                                    that forms and enlarges a DNA loop.
                                        This molecular model helps explain how cohesin can either encircle DNA or create loops.
                                    However, Higashi et al.’s findings also raise the question of whether loop extrusion is possible inside
                                    cells, where DNA is densely packed and bound to proteins which could be obstacles to loop
                                    extrusion. Further research to engineer cohesin that can only perform one of these roles would help
                                    to clarify their individual contributions in the cell.

                                    reversibly engages with Smc3Psm3 coiled coil next to the ATPase head, forming the kleisin N-gate
                                    through which DNA enters the cohesin ring (Figure 1A; Higashi et al., 2020). The kleisin C-terminus
                                    in turn binds to the Smc1 head domain. These kleisin terminal domains are connected via a long
                                    unstructured region, to which two HEAT repeat subunits bind that promote topological cohesin
                                    loading onto DNA. Scc3Psc3 interacts with the middle of the kleisin unstructured region. Scc2Mis4,
                                    together with its binding partner Scc4Ssl3, transiently associates with the kleisin between the kleisin
                                    N-gate and Scc3Psc3. Once cohesin loading onto DNA is complete, Scc2Mis4 is replaced by a related
                                    HEAT repeat subunit, Pds5 (Murayama and Uhlmann, 2015; Petela et al., 2018). Because of its
                                    transient role, Scc2Mis4-Scc4Ssl3 is often thought of as a cofactor, termed ‘cohesin loader’
                                    (Ciosk et al., 2000; Murayama and Uhlmann, 2014). Following topological loading, cohesin is free
                                    to linearly diffuse along DNA in vitro (Davidson et al., 2016; Kanke et al., 2016; Stigler et al.,
                                    2016), while RNA polymerases push cohesin along chromosomes toward sites of transcriptional ter-
                                    mination in vivo (Lengronne et al., 2004; Ocampo-Hafalla et al., 2016; Busslinger et al., 2017).
                                    Cohesin promotes sister chromatid cohesion following DNA replication by topologically entrapping
                                    two sister DNAs (Haering et al., 2008; Murayama et al., 2018).
                                       In addition to topologically entrapping DNA, in vitro experiments have revealed the ability of
                                    human cohesin to translocate along DNA in a directed motion, as well as its ability to extrude DNA
                                    loops (Davidson et al., 2019; Kim et al., 2019). These activities are reminiscent of those previously
                                    observed with a related SMC complex, condensin, a central mediator of mitotic chromosome con-
                                    densation (Terakawa et al., 2017; Ganji et al., 2018). Like topological loading onto DNA, loop
                                    extrusion by cohesin depends on its ATPase, as well as on the human Scc3Psc3 homolog SA1 and the
                                    cohesin loader (NIPBL-MAU2). In contrast to topological loading, cohesin is able to extrude DNA
                                    loops if all three cohesin ring interfaces are covalently closed (Davidson et al., 2019). This suggests
                                    that loop extrusion does not involve topological DNA entry into the cohesin ring.

Higashi et al. eLife 2021;10:e67530. DOI: https://doi.org/10.7554/eLife.67530                                                       2 of 35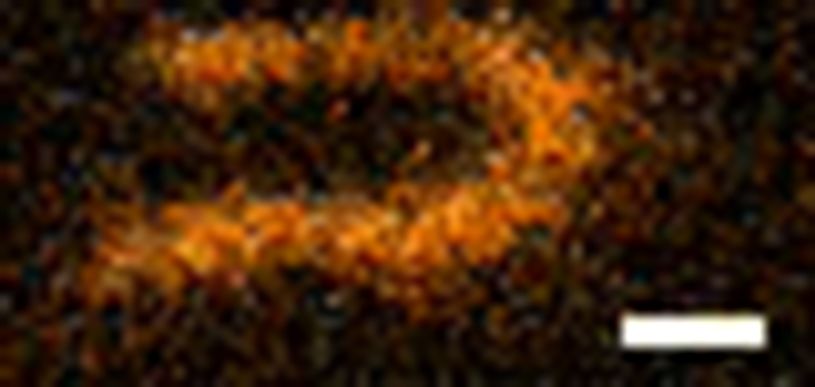
Research article Chromosomes and Gene Expression Computational and Systems Biology
A Smc hinge Cohesin
Ssl3
Scc4 Smc1Psm1 elbow
Smc3Psm3 DNA DNA
Cohesin
loader C (i)
Scc2Mis4 C (ii)
N Kleisin N-gate
Kleisin B
Scc1Rad21
ATPase
C head-gate
Scc3Psc3 ‘gripping’ state
B Scc2-head module post-hydrolysis ‘slipping’
gripping state state
Smc1Psm1
head
Scc1Rad21 N
Scc2Mis4
Smc3Psm3 loop Scc2Mis4
head extrusion
Scc1Rad21 C DNA topological entry
C Scc3-hinge module
gripping state post-hydrolysis ‘slipping’
state
Smc hinge
(i) Scc3Psc3
interface
Scc2Mis4 handle
Psc3
Scc3
Scc1Rad21
hook
60゜ 60゜
(ii)
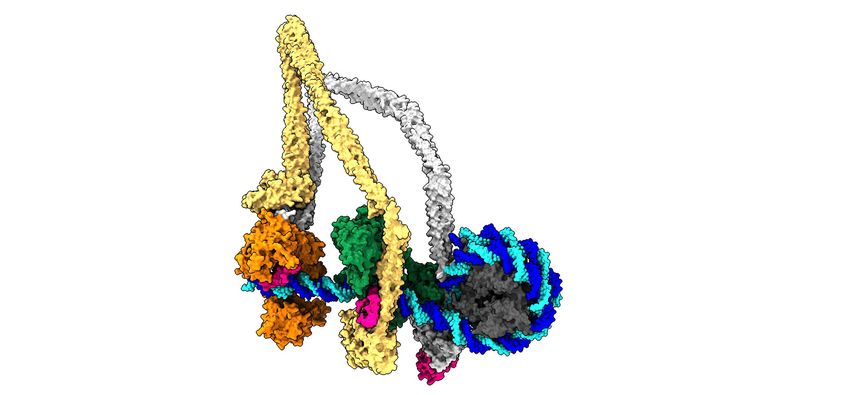
Figure 1. Two cohesin DNA binding modules in the gripping state and in their projected post-hydrolysis states. (A) Structural overview of the cohesin
complex components and assembly of the DNA gripping state. Viewpoints of the structures shown in (B and C) are indicated. (B) The Scc2-head
module in the gripping state and its predicted conformation following ATP hydrolysis. ATPase head disengagement and return of Scc2Mis4 from the
gripping state conformation to its extended crystal structure form results in loss of DNA interactions, turning the module into its ‘slipping state’. (C) The
Figure 1 continued on next page
Higashi et al. eLife 2021;10:e67530. DOI: https://doi.org/10.7554/eLife.67530 3 of 35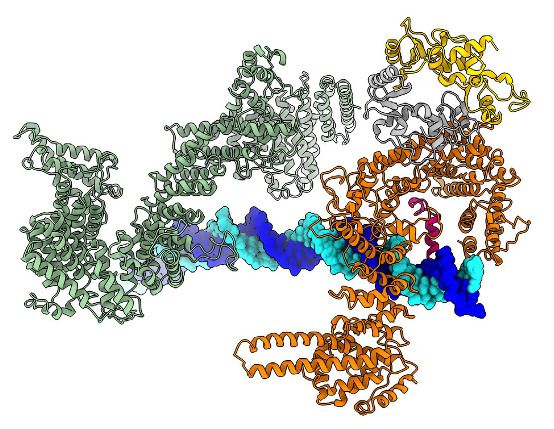
Research article                                               Chromosomes and Gene Expression Computational and Systems Biology

Figure 1 continued
Scc3-hinge module. The DNA binding surface of this module remains unaltered by ATP hydrolysis. However, the Scc2Mis4 conformational change leads
to uncoupling of the Scc3-hinge from the Scc2-head module.
The online version of this article includes the following figure supplement(s) for figure 1:
Figure supplement 1. Configuration of Scc3Psc3 and Scc2Mis4 in the DNA gripping state.

                                        Several models have been proposed as to how SMC complexes extrude DNA loops. These
                                    include a tethered-inchworm model in which a scissoring motion of the ATPase heads translates into
                                    movement along DNA (Nichols and Corces, 2018). The DNA-segment-capture model instead sug-
                                    gests that a pumping motion between open and closed configurations of the SMC coiled coils con-
                                    strains DNA loops (Marko et al., 2019). Finally, a scrunching model proposes that the SMC hinge
                                    reaches out to capture and reel in DNA loops (Ryu et al., 2020a). A characteristic of experimentally
                                    observed loop extrusion is that very small counterforces (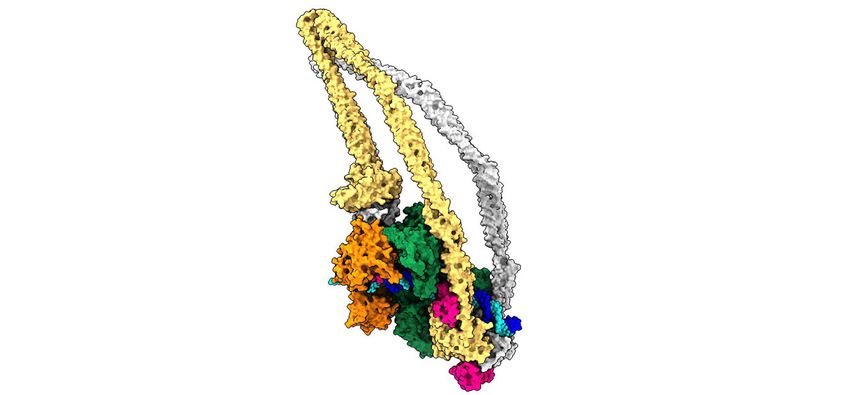
Research article                                               Chromosomes and Gene Expression Computational and Systems Biology

                                    the combined Scc3Psc3 and kleisin surface. We refer to this second DNA binding site as the ‘Scc3-
                                    hinge module’ (see Figure 1—figure supplement 1A for details of the structural model).

                                    Predicted conformational changes following ATP hydrolysis
                                    We now consider the consequences of ATP hydrolysis on the two DNA binding modules outlined
                                    above. Upon ATP hydrolysis, the ATPase heads disengage, leading to loss of at least some of the
                                    DNA contacts within the Scc2-head module. If we assume that Scc2Mis4 returns to its extended crys-
                                    tal structure form, further DNA contacts are lost as the gripping state opens up (Figure 1B, right).
                                    We can see how, in this state, DNA is free to leave the Scc2-head module during topological DNA
                                    entry (a structural model for the full DNA trajectory during topological entry is provided in Figure 3).
                                        During loop extrusion, we propose that DNA fails to exit the Scc2-head module through the
                                    ATPase head gate following ATP hydrolysis. This could be because an alternative kleisin path
                                    obstructs the head gate, or due to persisting electrostatic interactions between Scc2Mis4 and the
                                    DNA (discussed below in Figure 3). DNA movements are instead limited to transverse DNA sliding,
                                    that is in and out of the image plane in Figure 1B, akin to experimentally observed cohesin loader
                                    sliding along DNA (Stigler et al., 2016). Because of the moveable nature of the DNA interaction,
                                    we refer to this shape of the Scc2-head module as its ‘slipping state’.
                                        A bent Scc2Mis4 conformation that embraces DNA, compared to its extended crystal structure
                                    form, is shared between the fission yeast, human and budding yeast gripping states (Figure 1—fig-
                                    ure supplement 1B; Collier et al., 2020; Higashi et al., 2020; Shi et al., 2020). This commonality
                                    opens up the possibility that the gripping to slipping state conformational transition is a conserved
                                    feature of the Scc2-head module.
                                        In contrast to the Scc2-head module, the Scc3-hinge module and its DNA binding site do not
                                    undergo an obvious conformational change when comparing its gripping state and free crystal struc-
                                    ture forms. Human Scc3SA1 in the gripping state shows an almost perfect overlap with the crystal
                                    structure conformation of free Scc3SA2 (RMSD = 2.4 Å, Figure 1—figure supplement
                                    1C; Hara et al., 2014; Shi et al., 2020). In the gripping state, Scc3Psc3 interacts with the cohesin
                                    loader both along the N-terminal Scc2Mis4 handle, as well as the central Scc2Mis4 hook. Scc2Mis4 rear-
                                    rangement into its extended form disrupts at least some of these contacts, thereby terminating
                                    Scc3Psc3 - Scc2Mis4 juxtaposition (Figure 1C, right). A conformational change within the Scc2Mis4 han-
                                    dle is furthermore likely to weaken its interaction with the SMC hinge. We therefore hypothesize
                                    that, as a consequence of Scc2Mis4 structural rearrangements following ATP hydrolysis, the interac-
                                    tion between the Scc2-head and Scc3-hinge modules resolves. While the Scc2-head module turns
                                    from the DNA gripping to the slipping state, the DNA binding characteristics of the Scc3-hinge
                                    module remain unaltered.

                                    Measured positional changes between the Scc3-hinge and Scc2-head
                                    modules
                                    Above, we predicted positional changes of the Scc3-hinge module relative to the Scc2-head module,
                                    when comparing the gripping and ATP post-hydrolysis states. To experimentally observe the posi-
                                    tions of module components, we designed FRET reporters inserted at the hinge within Smc1Psm1, at
                                    the C-terminus of Scc3Psc3 and at the N-terminus of Scc2Mis4(N191) (Figure 2A). Scc2Mis4(N191) is an
                                    N-terminally truncated Scc2Mis4 variant missing the first 191 amino acids. The truncation abrogates
                                    Scc4Ssl3 interaction, a factor important for in vivo cohesin loading onto chromatin. In vitro, using
                                    naked DNA as a substrate, Scc2Mis4(N191) retains full biochemical capacity to promote gripping state
                                    formation, topological cohesin loading, as well as loop extrusion (Chao et al., 2015; Higashi et al.,
                                    2020; Shi et al., 2020). Based on our structural model, these locations are within distances that
                                    should allow FRET signal detection in the gripping state. CLIP or SNAP tags, inserted at these posi-
                                    tions, served as fluorophore receptors. We labeled these tags during protein purification with Dy547
                                    and Alexa 647 dyes as donor and acceptor fluorophores, respectively (Figure 2B and Figure 2—fig-
                                    ure supplement 1A). The tagged and labeled proteins retained the ability to topologically load
                                    onto DNA in vitro, albeit at slightly reduced efficiencies (Figure 2—figure supplement 1B). We then
                                    mixed labeled cohesin, cohesin loader, a 3 kb circular double stranded plasmid DNA and ATP in the
                                    indicated combinations. To create the gripping state, we included all components but substituted
                                    ATP for the non-hydrolyzable nucleotide ground state mimetic ADP  BeF-3. Following Dy547

Higashi et al. eLife 2021;10:e67530. DOI: https://doi.org/10.7554/eLife.67530                                                        5 of 35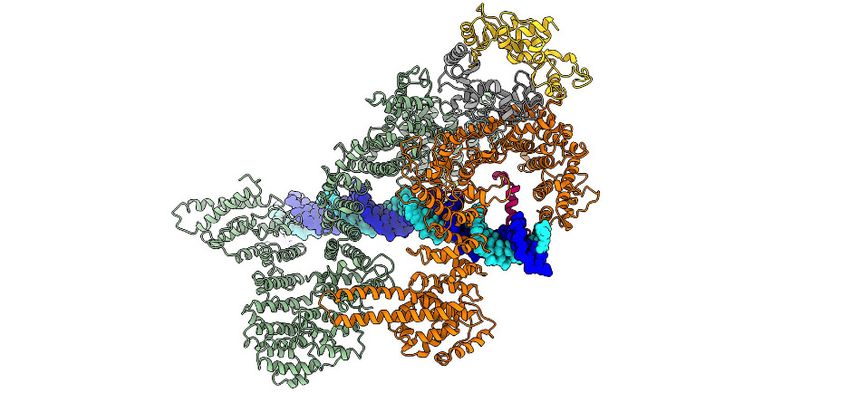
Research article                                  Chromosomes and Gene Expression Computational and Systems Biology

   A                                                                              B         Psm1
                                                                                       Smc1 hinge      Psm1                                      Mis4(N191)
                                                                                            Psc3
                                                                                        Scc3 -C   Smc1                  Scc3   -C Scc2-N
                                                                                                                               Psc3

                                                                                                   hinge
                                                                                             647
                                                                                         CBB 547  CBB 647                CBB 647   CBB 547
                                                                                  Mr (kDa)

                                  Smc1 Psm1 hinge                                     250
                                                          31.5Å                       150
                                                                                      100
                                                          Scc2 Mis4(N191)              75
                                         50.9Å
                                                       38.7Å                          50
                                                                                      37
                                                  Scc3Psc3-C

   C                                                              Psm1                        Psm1                     Psc3
                                                           Smc1           hinge        Smc1          hinge      Scc3      -C
                                                                  Psc3
                                                           Scc3          -C            Scc2 Mis4(N191) -N       Scc2 Mis4(N191) -N
   FRET efficiency IA/(ID + IA)

                                  0.30

                                  0.25

                                  0.20

                                  0.15
                                             Lo P

                                                    P

                                                                                                                                            e
                                         Lo /lo A

                                             P/ A
                                                    A
                                             rip ll

                                              Bu g

                                             rip ll
                                                    A

                                              Bu g

                                                    P

                                             rip ll
                                                   ng
                                                    A
                                                     r

                                          AT D r

                                             er er

                                                     r

                                                     r
                                                 ffe

                                                   e

                                                 ffe

                                                 ffe
                                            G A

                                            G A

                                            G A

                                                                                                                                           lin
                                                   n

                                                   n
                                                AT

                                                AT
                                            P N

                                                AT
                                           AT /DN

                                                  N

                                                  N

                                                  N
                                                ad

                                           ad ad

                                                pi

                                                pi

                                                pi
                                                D

                                                D

                                                D
                                      Bu

                                                                                                                                       se
                                                                                                                                      Ba

Figure 2. FRET-based conformational analyses of the Scc3-hinge and Scc2-head modules. (A) FRET reporter positions on the fission yeast cohesin
structural model in the DNA gripping state. The silver, orange, and green circles mark the positions of the Smc1Psm1 hinge residue R593, the Scc3Psc3
C-terminal residue E959 and Scc2Mis4 residue P209, respectively. The Euclidean distances between the Ca atoms of these residues are indicated. (B) The
purified and labeled cohesin complexes and Scc2Mis4(N191) cohesin loader were analyzed by SDS-PAGE followed by Coomassie blue staining (CBB) or in
gel fluorescence detection of the Cy547 (547) and Alexa 647 (647) dyes. (C) Relative FRET efficiencies IA/(ID + IA) between the respective elements were
recorded under the indicated conditions, where ID is the donor and IA the acceptor emission intensity resulting from donor excitation. The apparent
FRET value observed using a mixture of single-labeled cohesins is indicated as a baseline. Results from three independent repeats of the experiments,
their means and standard deviations are shown.
The online version of this article includes the following figure supplement(s) for figure 2:
Figure supplement 1. Control experiments for the FRET-based conformational analyses.
Figure supplement 2. Investigation of complex formation between cohesin and the Scc2Mis4(N191) cohesin loader.

Higashi et al. eLife 2021;10:e67530. DOI: https://doi.org/10.7554/eLife.67530                                                                          6 of 35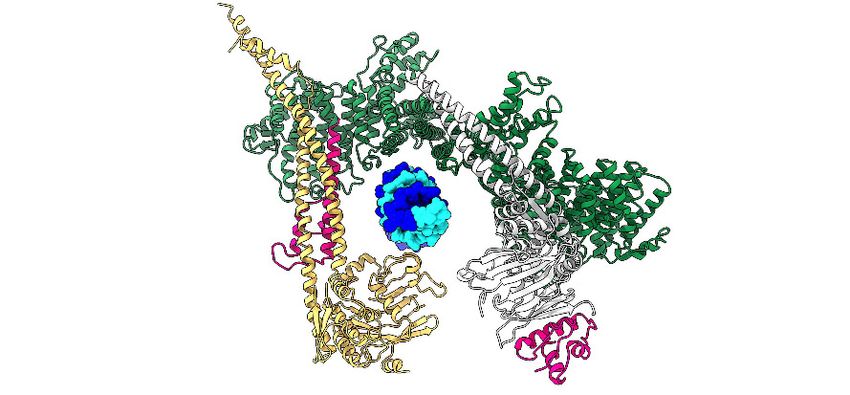
Research article                                               Chromosomes and Gene Expression Computational and Systems Biology

                                    excitation, we measured the relative FRET efficiency, defined as the Alexa 647 emission divided by
                                    the sum of Dy547 and Alexa 647 emissions.
                                        We first recorded FRET between the fluorophore pair at the Smc1Psm1 hinge and the Scc3Psc3
                                    C-terminus. The FRET efficiency measured with the cohesin complex alone was 0.22 and displayed
                                    only negligible changes following the addition of one or more of the different cofactors. Even under
                                    conditions of gripping state formation, the FRET efficiency remained unchanged (Figure 2C). As a
                                    control, we prepared a mixture of singly Smc1Psm1 hinge and singly Scc3Psc3 C-terminus labeled
                                    cohesin complexes. This mixture provides a baseline for the apparent background FRET value due
                                    to spectral overlap. At 0.17 the measurement remained substantially below the FRET values
                                    observed when both fluorophores were incorporated within the same cohesin complex. This obser-
                                    vation supports the idea that the SMC hinge and Scc3Psc3 lie in proximity of each other to form an
                                    Scc3-hinge module, consistent with biochemically observed Scc3Psc3-hinge binding (Murayama and
                                    Uhlmann, 2015). Module formation was observed under all tested conditions, irrespective of the
                                    stage during cohesin’s ATP binding and hydrolysis cycle.
                                        Next, we investigated the positioning of the Scc3-hinge module relative to the Scc2-head mod-
                                    ule. We first measured FRET between a donor fluorophore at the Scc2Mis4(N191) N-terminus and an
                                    acceptor fluorophore at the Smc1Psm1 hinge. We observed FRET at relatively low values under most
                                    conditions. Strikingly, the FRET efficiency markedly increased under conditions of gripping state for-
                                    mation (Figure 2C). This observation confirms that the Scc3-hinge and Scc2-head modules come
                                    into proximity in the ATP-bound gripping state, as seen in the cryo-EM structures. We also measured
                                    FRET between the Scc2Mis4(N191) N-terminus and an acceptor fluorophore at the Scc3Psc3 C-terminus.
                                    Again, FRET showed a relative increase under conditions of gripping state formation. The absolute
                                    FRET efficiency at this fluorophore pair remained lower when compared with the acceptor fluoro-
                                    phore at the Smc1Psm1 hinge. This is expected from a longer predicted Euclidean distance between
                                    Scc2Mis4(N191) and the Scc3Psc3 C-terminus in the gripping state, compared to Scc2Mis4(N191) and the
                                    Smc1Psm1 hinge (Figure 2A). Together, these observations suggest that the Scc3-hinge and Scc2-
                                    head modules come close to each other in the gripping state but separate from each other in other
                                    conditions.
                                        When using Scc2Mis4(N191) as the FRET donor, its transitory interaction with cohesin becomes a
                                    confounding factor. Higher FRET efficiency in the gripping state could have been due to increased
                                    cohesin-Scc2Mis4(N191) complex formation, rather than a conformational change. To examine this pos-
                                    sibility, we monitored the cohesin-Scc2Mis4(N191) interaction by co-immunoprecipitation. This revealed
                                    equal interaction efficiencies under all of our incubation conditions (Figure 2—figure supplement
                                    2). Therefore, the observed FRET differences cannot be explained by different cohesin-Scc2Mis4(N191)
                                    complex stabilities. Rather, the FRET changes indeed point to conformational transitions within the
                                    cohesin complex.

                                    The role of the Scc3-hinge module during topological DNA entry
                                    What are the consequences of the Scc3-hinge module, and its movement relative to the Scc2-head
                                    module, for the DNA trajectory during topological DNA entry? Our earlier results suggested that
                                    DNA arrives from the top of the ATPase heads and usually passes the kleisin N-gate before reaching
                                    the gripping state (Figure 3A, panel a) (Higashi et al., 2020). The kleisin N-gate initially opens as
                                    the consequence of ATP-dependent SMC head engagement (Muir et al., 2020). A positively
                                    charged kleisin N-tail then guides DNA through this gate en route to the gripping state. In the grip-
                                    ping state, the DNA together with the Scc2Mis4 cohesin loader shut the gate, while the Scc3-hinge
                                    module docks onto the Scc2-head module. The straight DNA path through both DNA binding mod-
                                    ules in turn requires that the DNA bends where it arrives between the Smc1Psm1 and Smc3Psm3 coiled
                                    coils. The DNA path shown in Figure 3A, panel a, highlights the position of the bend, based on our
                                    DNA-protein crosslink mass spectrometry data (Higashi et al., 2020). The notion of DNA bending in
                                    the gripping state finds further support from magnetic tweezer experiments, in which condensin
                                    introduced a discrete DNA shortening step under gripping state conditions (Ryu et al., 2020b).
                                        A stable DNA gripping state forms only in the presence of non-hydrolyzable ATP. Usually, grip-
                                    ping state formation triggers ATP hydrolysis, resulting in ATPase head gate opening and Scc3-hinge
                                    and Scc2-head module uncoupling. This uncoupling allows a swinging motion of the Scc3-hinge
                                    module and proximal coiled coil, with a pivot point at the elbow (Figure 3A, panel b). No force
                                    needs to be transmitted along the SMC coiled coil for this swinging motion to initiate. Rather,

Higashi et al. eLife 2021;10:e67530. DOI: https://doi.org/10.7554/eLife.67530                                                       7 of 35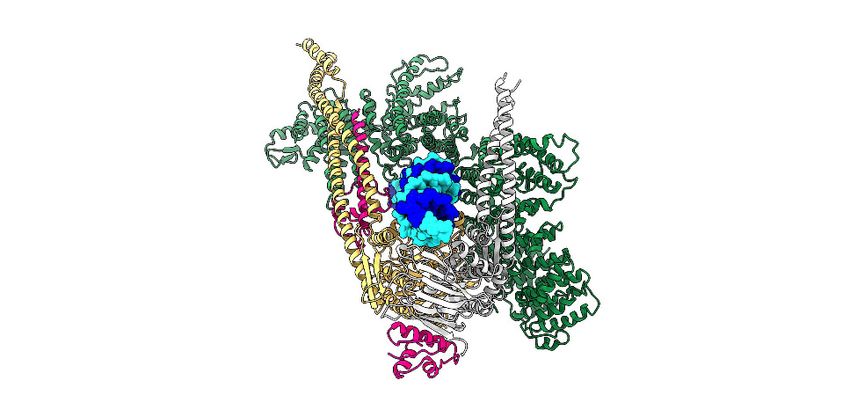
Research article                                                  Chromosomes and Gene Expression Computational and Systems Biology

         A     topological loading trajectory
                                                                                                         DNA straight
                        N-tail

                                                  DNA bend
                                                             a) DNA gripping      b) Head gate passage                  c) Topological loading

         B       loop extrusion trajectory?
                                                                                                          DNA loop
                                                  DNA bend

                                                             a) DNA gripping        b) DNA slipping                     c) Brownian ratchet

                                              23 nm

                                                  f) DNA gripping                    e) Return                             d) DNA release

Figure 3. Molecular models for topological DNA entry into the cohesin ring and for loop extrusion. (A) Topological DNA entry into the cohesin ring. (a)
DNA enters through the open kleisin-N gate. DNA binding by both the Scc2-head and Scc3-hinge modules introduces a DNA bend. (b) ATP hydrolysis
opens the SMC head gate. The swinging motion of the Scc3-hinge module (indicated by a yellow arrow) steers the DNA through the head gate to
complete topological entry. (c) DNA is topologically entrapped in the Scc3-Smc3-kleisin-N chamber. (B) Loop extrusion. (a) DNA arrives in the gripping
state without passing the kleisin N-gate. (b) ATP hydrolysis leads to SMC head gate opening, but the kleisin path prevents DNA passage. The swinging
motion of the Scc3-hinge module instead turns the DNA bend into a loop, while DNA slips along the Scc2-head module. (c) Loop growth depends on
the stochastic Brownian motion of the Scc3-hinge module. (d) The low DNA affinity of the Scc3-hinge module results in DNA release. (e) The Scc3-hinge
module returns to form a new DNA gripping state upon nucleotide binding. (f) The next loop extrusion cycle begins. The in- and outbound DNAs are
constrained by cohesin at a distance of ~23 nm, in line with recent measurements of the condensin neck size when engaged in loop extrusion
(Ryu et al., 2020a).
The online version of this article includes the following figure supplement(s) for figure 3:
Figure supplement 1. Additional views of cohesin during topological loading onto DNA and during loop extrusion.

                                       following release, Brownian motion can take the Scc3-hinge module only in one direction, away from
                                       the Scc2-head module. When we consider the consequence of the Scc3-hinge swinging motion on
                                       the DNA path, we make two observations. Firstly, the bent DNA straightens, an effect that might

Higashi et al. eLife 2021;10:e67530. DOI: https://doi.org/10.7554/eLife.67530                                                                    8 of 35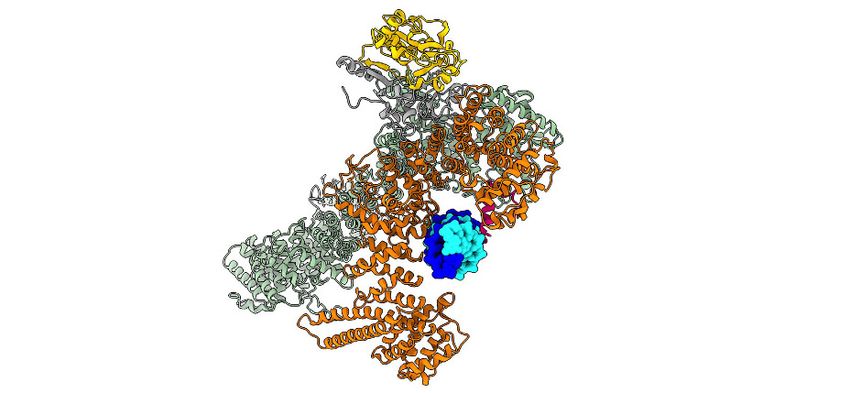
Research article                                               Chromosomes and Gene Expression Computational and Systems Biology

                                    favor the swinging motion. Secondly, the movement effectively steers the DNA through the ATPase
                                    head gate to complete topological entry into the cohesin ring.
                                        Following head gate passage, we expect that DNA retains Scc3-hinge module association only
                                    for a limited time. DNA affinity to Scc3Psc3 and the kleisin middle region in isolation has been mea-
                                    sured at around 2 mM (Li et al., 2018), a relatively low affinity that implies a fast off-rate once
                                    Scc3Psc3 has left the gripping state. DNA consequently finds itself in a cohesin chamber delineated
                                    by Scc3Psc3, the Smc3Psm3 coiled coil, as well as the unstructured part of the kleisin between the klei-
                                    sin N-gate and the kleisin middle region (Figure 3A, panel c). We refer to this space as cohesin’s
                                    Scc3-Smc3-kleisin-N chamber. Two separase recognition sites in Scc1Rad21, whose cleavage liberates
                                    DNA from the cohesin ring to trigger anaphase (Tomonaga et al., 2000; Uhlmann et al., 2000), are
                                    situated within this part of the kleisin unstructured region (Figure 3—figure supplement 1A).
                                        Single molecule imaging of cohesin, topologically loaded onto DNA, showed that its diffusion is
                                    blocked by obstacles smaller than those expected to be accommodated by cohesin’s SMC compart-
                                    ment (Davidson et al., 2016; Kanke et al., 2016; Stigler et al., 2016). This observation is consistent
                                    with the possibility that DNA resides in a sub-chamber of the cohesin ring following topological
                                    loading. How durable the Scc3Psc3-SMC hinge association is, whether DNA permanently resides
                                    inside the Scc3-Smc3-kleisin-N chamber, or whether subunit rearrangements take place following
                                    successful topological loading, for example when the cohesin loader is replaced by Pds5, remains to
                                    be further ascertained.

                                    An alternative gripping state that initiates loop extrusion
                                    The structured components of the gripping state do not by themselves contain information about
                                    whether DNA has in fact passed the kleisin N-gate. While mechanisms are in place to ensure kleisin
                                    N-gate passage, for example the kleisin N-tail, DNA might under certain conditions reach the grip-
                                    ping state without having passed this gate (Figure 3B, panel a). What will be the consequence of
                                    ATP hydrolysis in such an alternative gripping state? The Scc2-head module turns into its DNA slip-
                                    ping state, but the kleisin path prevents DNA from passing between the ATPase heads. The Scc3-
                                    hinge module again uncouples from the Scc2-head module, but now its diffusion-driven swinging
                                    motion cannot steer DNA through the head gate. The only way for the Scc3-hinge module to launch
                                    its swinging motion is to further bend the DNA, turning it into a loop, while DNA slips through the
                                    Scc2-head module (Figure 3B, panel b). The directed diffusive motion of the Scc3-hinge module has
                                    created a Brownian ratchet, allowing DNA motion only in one direction (Figure 3B, panel c). The
                                    entropy gain from gripping state disassembly in turn helps to offset the energetic cost of DNA loop
                                    formation.
                                        Once a DNA loop is initiated, the extent of loop growth per reaction cycle is limited by how far
                                    the Scc3-hinge and Scc2-head modules separate from each other. The maximum separation is likely
                                    dictated by the kleisin unstructured regions that link Scc3Psc3 to the Scc2-head module. Their lengths
                                    of 135 amino acids (between the Scc2Mis4 and Scc3Psc3 binding sites) and 109 amino acids (between
                                    the Scc3Psc3 binding site and the kleisin C-terminal domain) gives a conservative estimate of ~40 nm
                                    (Figure 3—figure supplement 1B; Ainavarapu et al., 2007). This distance allows considerable, but
                                    perhaps not complete, extension of the ~47 nm long SMC proteins. As we will see below, the actual
                                    amount of loop growth is likely less and depends on the SMC elbow angle reached by stochastic dif-
                                    fusive motion at the time when DNA dissociates (Figure 3B, panel d).
                                        After DNA dissociation from the Scc3-hinge module, there is a time when there is only loose
                                    cohesin-DNA contact with the Scc2-head module. Thermal fluctuations now lead to random loop
                                    size changes, depending on the probability of diffusion and on external forces that might apply. As
                                    long as the Scc2Mis4 cohesin loader remains part of the Scc2-head module, the local proximity of all
                                    components means that a return of the Scc3-hinge module (Figure 3B, panel e) and the establish-
                                    ment of a new DNA gripping state following nucleotide binding (Figure 3B, panel f) are very likely
                                    events. The next loop extrusion cycle begins.

                                    Variants of the molecular DNA loop extrusion model
                                    The above model makes a specific molecular proposal for DNA loop extrusion by the cohesin com-
                                    plex. At its core lies a Brownian ratchet built from the Scc3-hinge and Scc2-head modules, juxta-
                                    posed during gripping state formation but allowing unidirectional DNA diffusion following ATP

Higashi et al. eLife 2021;10:e67530. DOI: https://doi.org/10.7554/eLife.67530                                                        9 of 35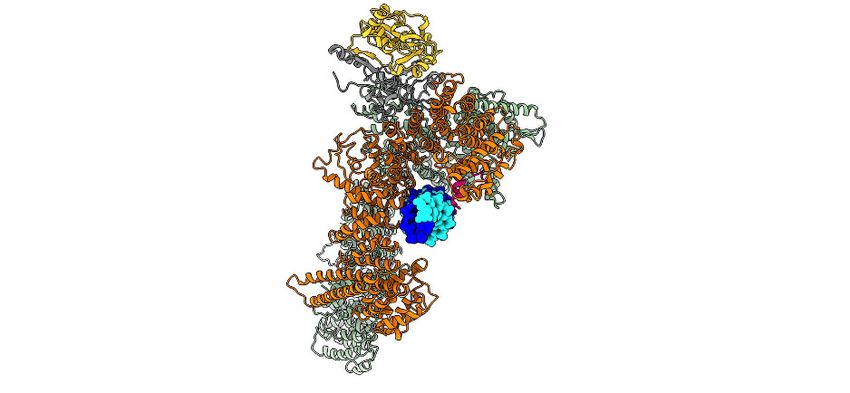
Research article                                               Chromosomes and Gene Expression Computational and Systems Biology

                                    hydrolysis. This robust core of a loop extrusion mechanism tolerates variations in its surrounding
                                    features.
                                       One point of uncertainty regards the Scc3Psc3 interaction with the SMC hinge. While our FRET
                                    observations suggest proximity of Scc3Psc3 and the SMC hinge under all tested solution conditions,
                                    others have observed Scc3Psc3 close to the ATPase heads and distant from the hinge
                                    (Anderson et al., 2002; Huis in ’t Veld et al., 2014). It is possible that the Scc3Psc3-hinge interaction
                                    has a limited lifetime following gripping state disassembly. As long as Scc3Psc3 retains hinge associa-
                                    tion during initial SMC coiled coil unfolding, the Brownian ratchet has served its purpose. Scc3Psc3
                                    might then dissociate from both the DNA and the hinge without impacting on loop extrusion effi-
                                    ciency (Figure 3—figure supplement 1C), as long as all subunits rejoin during gripping state
                                    reassembly.
                                       Another open question in our molecular proposal is whether DNA indeed fails to pass the kleisin
                                    N-gate before the initiation of loop extrusion. The finding that loop extrusion is not prevented by
                                    covalent fusions between cohesin ring subunits (Davidson et al., 2019) does not strictly answer the
                                    question whether or not DNA passes the kleisin N-gate, which lies at a distinct distance from the
                                    kleisin N-terminus. If DNA did pass the kleisin N-gate, as it would during topological entry into the
                                    cohesin ring, the kleisin path would not obstruct DNA exit from the Scc2-head module. Instead,
                                    under the low-salt conditions typical for loop extrusion experiments, DNA might retain electrostatic
                                    contact with the positive charges of the Scc2-head module in the slipping state (Figure 3—figure
                                    supplement 1D). Whether or not such interactions are sufficient to sequester DNA within the Scc2-
                                    head module during loop extrusion remains to be learned.

                                    Loop extrusion by the fission yeast cohesin complex
                                    The above molecular model for loop extrusion is based on experiments using the fission yeast cohe-
                                    sin complex and its loader. To date, loop extrusion by cohesin has only been observed using human
                                    proteins, while attempts to observe loop extrusion by budding yeast cohesin have remained unsuc-
                                    cessful (Ryu et al., 2021). We therefore asked whether fission yeast cohesin is able to extrude DNA
                                    loops. We employed a single-molecule assay similar to those previously used to observe DNA loop
                                    extrusion by budding yeast condensin and human cohesin (Ganji et al., 2018; Davidson et al.,
                                    2019). Individual molecules of l-phage DNA were tethered via both ends to a cover glass surface of
                                    a microfluidic flow cell, stained with Sytox Orange and stretched by continuous buffer flow while
                                    being imaged using total internal reflection (TIRF) microscopy. In the presence of 5 nM fission yeast
                                    cohesin, the cohesin loader and ATP, over 40% of the DNA molecules were seen to display active
                                    DNA loop extrusion (Figure 4A, Video 1). Loop extrusion proceeded in a symmetrical manner at a
                                    mean rate of ~1 kbp s 1 (maximal rate 2.4 kbp s 1, Figure 4B) resembling DNA loop extrusion by
                                    human cohesin (Davidson et al., 2019; Kim et al., 2019). This confirms that fission yeast cohesin
                                    can both, topologically load onto DNA and extrude DNA loops.

                                    A computational model for Brownian ratchet-driven DNA loop
                                    extrusion
                                    In our proposed model of loop extrusion, two DNA binding modules within the cohesin complex
                                    generate a Brownian ratchet. The ratchet is operated by repeated cycles of ATP-dependent DNA
                                    gripping state formation and its unidirectional dissolution following ATP hydrolysis. To evaluate
                                    whether such a mechanism is physically plausible, we constructed a structure-based molecular-
                                    mechanical model of the cohesin-DNA interaction and carried out computational simulations to
                                    explore its behavior. We modeled DNA as a discrete stretchable, shearable wormlike chain
                                    (dssWLC), which describes DNA with persistence length as the only parameter
                                    (Figure 5A; Koslover and Spakowitz, 2014). We assumed the persistence length to be Lp = 50 nm
                                    (Wang et al., 1997; Bustamante et al., 2000). The cohesin coiled coil segments as well as the link-
                                    age between the two SMC heads were modeled using the same approach. Each coiled coil was rep-
                                    resented as three beads that interact via a dssWLC (Figure 5B). This again leaves persistence length
                                    as the sole parameter that we chose such that it leads to a head-to-hinge distance distribution that
                                    matches experimentally measured head-to-hinge distances in a freely diffusing eukaryotic SMC com-
                                    plex (Ryu et al., 2020a).

Higashi et al. eLife 2021;10:e67530. DOI: https://doi.org/10.7554/eLife.67530                                                        10 of 35
Research article Chromosomes and Gene Expression Computational and Systems Biology
A
Buffer + Fission yeast cohesin + loader
5s 10 s 20 s 30 s 40 s 50 s
Intensity (linear units)
B 2.5
Loop extrusion rate (kbp/s)
40
2.0
Loop size (kbp)
30
1.5
20
1.0
10 0.5
0 0.0
0 10 20 30 40 50 Fission yeast cohesin
Time (s)
Figure 4. Loop extrusion by the fission yeast cohesin complex. (A) Time course of DNA loop extrusion. Scale bar 1 mm. A doubly tethered DNA
molecule (48.5 kbp) is stained with Sytox Orange and stretched using buffer flow at 15 ml/min. Upon addition of cohesin and cohesin loader in the
presence of ATP, a loop formed at the tip of the DNA and dynamically extended toward the DNA ends. The corresponding loop size change over time
is plotted. (B) Mean DNA loop extrusion rates from n = 21 DNA molecules analyzed.
Based on our structural and biochemical observations, we define two states of the cohesin com-
plex. In the gripping state, the Scc3-hinge and Scc2-head modules are engaged and the coiled coil
elbows are folded. Both modules make stable contact with DNA (Figure 5C, Gripping state). In the
second state, the slipping state, the Scc3-hinge and Scc2-head modules do not interact, allowing an
unfolded cohesin conformation. In this state, the Scc2-head module permits free transverse DNA
motion. DNA association with the Scc3-hinge module, defined by its equilibrium dissociation con-
stant, is manually controlled in our model
(Figure 5C, Slipping state).
First, we explored the dynamics of the transi-
tion between cohesin’s gripping and slipping
states. As a starting point we assume that a
small DNA loop is inserted into the cohesin ring
in the gripping state. The first panel in
Figure 5D shows a snapshot of this initial state
after equilibration by the Metropolis Monte-
Carlo algorithm (see Materials and methods).
Our 3D model has no explicit chemical kinetics,
Video 1. Movie showing formation and extension of a and to simulate transitions between chemical
loop on doubly tethered DNA in the presence of states we prescribed parameter changes corre-
cohesin, the cohesin loader and ATP. Scale bar 1 mm. A sponding to a new state, then sampled a suffi-
DNA molecule (48.5 kbp) is stained with Sytox Orange cient number of iterations to reach a new
and stretched at 15 mL/min buffer flow. equilibrium. To simulate transition to the slipping
https://elifesciences.org/articles/67530#video1 state, we impose parameter changes that
Higashi et al. eLife 2021;10:e67530. DOI: https://doi.org/10.7554/eLife.67530 11 of 35Research article Chromosomes and Gene Expression Computational and Systems Biology
A DNA B cohesin C
dssWLC model dssWLC model Gripping state Slipping state
u hinge
u i+1
ui DNA bound
u Smc3 u Smc1
ri Elbow Elbow
Scc3
u i-1 -hinge
r i-1 module Scc2
u Smc3 u Smc1 -head
module DNA
slide
s
D Gripping state 1 E
Loop increase (ΔL, nm)
Slipping state 1 40
30
20
ΔL 10
0
ΔL
0 1 2 3 7
MMC iterations x 10
Gripping state 2
F DNA dissociation
Cohesin unfolding Transition back to gripping state
from Scc3-hinge Module
time
< 0.1 ms 0.1 ms - 0.05 s
0.1 - 1 s
Figure 5. 3D Metropolis Monte-Carlo simulation of cohesin-DNA interactions. (A) Representation of DNA as a dssWLC model. DNA is split into 5 nm
! !
long segments. Each segment is described by its radius vector r i and a unit vector u i that defines segment orientation. (B) Cohesin is described by five
beads corresponding to Smc1 and Smc3 heads and elbows as well as the hinge. The bead positions are defined by the corresponding vector radii (not
shown) and their orientation by unit vectors. (C) The two equilibrium conformations of the model, corresponding to the gripping and slipping states. (D)
Snapshots from a simulation, started in a gripping state. The system was sampled 2.5106 times and then the equilibrium state was changed to the
slipping state. It was sampled for another 8106 iterations, which led to cohesin unfolding and loop extension. At iteration 1107, the equilibrium
conformation was returned to gripping state. (E) Loop length increase shown as function of Metropolis Monte-Carlo (MMC) iterations following the
gripping to the slipping state transition. Before iteration zero, the system was equilibrated for 2106 rounds in the gripping state. The black line
represents the average and the gray area the standard deviation across 10 independent simulation replicates. (F) Schematic to show time progression
of the DNA interaction with the Scc3-hinge module. Time intervals show indicative ranges of model parameters.
Higashi et al. eLife 2021;10:e67530. DOI: https://doi.org/10.7554/eLife.67530 12 of 35Research article Chromosomes and Gene Expression Computational and Systems Biology
disconnect the Scc3-hinge from the Scc2-head module and switch the Scc2-head module to its slip-
ping state, while the Scc3-hinge module remains bound to DNA. We then sampled conformations
with the new parameters until a new equilibrium was reached. As cohesin unfolds, DNA binding to
the Scc3-hinge module limits DNA movement at the Scc2-head module to only one direction,
toward an increased loop size (Figure 5D). The average increase in loop size during multiple repeats
of this transition is ~30 nm (Figure 5E). When we then prescribe DNA detachment from the Scc3-
hinge module and switch cohesin back to the gripping state, the system readily resets and primes
itself for the next cycle (Figure 5D). Our simulations reveal that repeated rounds of the states: ‘grip-
ping - > slipping - > DNA detachment from the Scc3-hinge module - > gripping’ results in continu-
ous extrusion of DNA with an average loop size increase of ~30 nm per cycle (Video 2).
DNA affinity of the Scc3-hinge module controls loop extrusion
In the above computational model, all state transitions were manually prescribed to obtain cycles of
DNA loop extrusion. In the following, we consider requirements for such cycles to arise based on
the chemical kinetics of the cohesin complex. We assume, based on the structural data, that both
the Scc2-head and Scc3-hinge modules bind DNA in the ATP-bound gripping state. Following ATP
hydrolysis, the Scc2-head module switches to its slipping state, while DNA remains bound to the
Scc3-hinge module. To achieve processive cycles of loop extrusion, DNA binding must persist for
long enough to ensure biased DNA diffusion toward loop growth while cohesin unfolds (Figure 5F).
An upper limit for the time it takes cohesin to unfold is given by the time of a diffusive process that
separates the Scc3-hinge and Scc2-head modules. Assuming molecular masses of both modules in
the 200 kDa range, it takes ~0.1 ms for them to diffuse ~50 nm apart (see Materials and methods).
This time is an upper estimate. If cohesin opening was driven not merely by diffusion, but assisted
by internal stiffnesses of the coiled coils, this could speed up opening. Based on this estimate, our
model predicts that the DNA off-rate at the Scc3-hinge module should be lower than 1/0.1
ms = 10,000 s 1 in order for DNA to maintain Scc3-hinge module association until cohesin fully
unfolds.
After cohesin has opened, two further scenarios are possible. Firstly, DNA could dissociate from
the Scc3-hinge module before cohesin transitions back into the next gripping state. In this case a
loop length gain is made and the ensuing grip-
ping state primes cohesin for the next round of
loop extrusion (Figure 5F). Alternatively, cohesin
could switch back to the gripping state before
DNA is released from the Scc3-hinge module. In
this situation, DNA ends up in the same position
as before and there is no net loop size gain,
resulting in an unproductive cycle. Based on
these considerations, loop extrusion in our
model is most effective when the DNA lifetime
at the Scc3-hinge module is longer than the time
required for diffusion-driven cohesin unfolding,
but shorter than it takes cohesin to transition
back into the next gripping state. Such a lifetime
would ensure that most reaction cycles result in
net loop growth.
The ATP-bound DNA gripping state is an
unstable state, so we can expect cohesin to
spend the majority of its time in the post-hydro- Video 2. Progression of the Metropolis Monte-Carlo
simulation as cohesin is switched between the
lysis slipping state. We can then approximate
parameters describing its gripping and slipping states
the lifetime of the slipping state based on cohe-
(Supplementary file 1). Before the start of the video,
sin’s ATP hydrolysis rate. This rate has been the system was equilibrated for ~ 107 iterations. Frames
1
measured with a lower limit of ~ 2 s were captured every 2105 iterations and the video
(Davidson et al., 2019; Ganji et al., 2018; spans ~ 5107 iterations. Pauses were introduced to
Murayama and Uhlmann, 2014). As two ATPs highlight imposed state transitions and DNA binding
are coordinately hydrolyzed by the two ATPase and unbinding events. Axis scale, nm.
heads, this equates to a cycle rate of ~ 1 s 1. https://elifesciences.org/articles/67530#video2
Higashi et al. eLife 2021;10:e67530. DOI: https://doi.org/10.7554/eLife.67530 13 of 35Research article Chromosomes and Gene Expression Computational and Systems Biology
Thus, our model predicts that efficient loop extrusion is achieved when the DNA off-rate from the
Scc3-hinge module is in the range of 1 – 10,000 s 1. While we do not know the actual off-rate, the
equilibrium dissociation constant Kd between DNA and Scc3 has been measured at ~ 2 mM (Li et al.,
2018). Assuming an association rate kon typical for biomolecular interactions of ~ 107 M 1 s 1
(Howard, 2001), we arrive at a corresponding off-rate koff ¼ Kd kon of ~ 20 s 1. This value sits well
within the range predicted to support processive loop extrusion. The number ensures processivity
even if cohesins that are actively engaged in loop extrusion undergo conformational cycles and
hydrolyze ATP up to twenty times faster than measured in bulk solution experiments.
Loop extrusion by biased DNA diffusion
Having established that transitions between cohesin’s gripping and slipping states can drive direc-
tional DNA movements, we explored how this mechanism compares to available experimental
observations of loop extrusion at realistic time scales. To do this, we constructed a simplified model
of loop development. We assume that both DNAs that enter cohesin at the Scc2-head module and
exit cohesin at the Smc3Psm3 elbow can randomly diffuse in and out of the ring with rates depending
on a DNA diffusion coefficient D. We then use a Monte-Carlo algorithm to simulate DNA loop
dynamics as a function of time.
If we adopt a diffusion coefficient of ~1 mm2/s, as measured for cohesin movements on DNA fol-
lowing topological loading (Davidson et al., 2016; Kanke et al., 2016; Stigler et al., 2016), we see
that both strands randomly diffuse back and forth, leading to stochastic loop size changes
(Figure 6A). Within a few minutes, a typical time frame used to microscopically observe DNA loop
extrusion, the loop size changes over a range of several kilobases. However, these random move-
ments do not show a preferred direction and cannot drive loop extrusion.
This situation changes when the Scc3-hinge module engages with DNA in the gripping state and
disengages predominantly in the slipping state. The Scc3-hinge module restricts DNA diffusion at
the Scc2-head module to only one direction – toward loop growth. This effect applies only to the
DNA that enters the loop at the Scc2-head module, but not to the DNA that exits cohesin. We
assume that the latter DNA continues to diffuse randomly in both directions irrespective of the cohe-
sin state. If we simulate directed DNA motion at the Scc2-head module of 30 nm per cohesin turn-
over cycle, we see how, overlaid over stochastic diffusive loop size fluctuations, the loop length
steadily increases over time (Figure 6B).
We next explored how the variables in this model affect the outcome of loop extrusion. There are
three independent variables: the two diffusion coefficients that describe the two DNAs that enter
and exit cohesin, as well as the ATPase turnover rate, that is the lifetime of each slipping state. We
simulated multiple 10 min intervals of cohesin-DNA dynamics and compared loop extrusion rates
extracted from these simulations to those determined in our and in published experiments
(Davidson et al., 2019).
The simulations revealed that the average loop extrusion rate is unaffected by the DNA diffusion
coefficients (Figure 6C). Indeed, thermal movement of DNA has no net direction and therefore
should not contribute to directed loop growth. Instead, the average loop extrusion rate v is simply a
product of the step size during cohesin’s state transitions L and the frequency g of these events:
v¼ gL (1)
Using the value of L = 30 nm = 0.088 kb, we find that there must be around 10 successful cohesin
state transitions per second to reach experimentally observed average loop extrusion speeds of ~ 1
kb s 1. The required rate of cohesin state transitions necessitates an equal rate of ATPase cycles.
This means that a cohesin complex that is actively engaged in loop extrusion hydrolyzes ATP ~ 10
times faster than average bulk solution ATP hydrolysis rates suggested.
A striking feature of experimentally observed loop extrusion is a high variation in loop growth
rates (Figure 4B; Ganji et al., 2018; Davidson et al., 2019). To obtain insight into the origin of
these variations, we compared scatter in our modeled traces with experimental data. We quantified
the scatter as the interquartile range, that is the range that contains 50% of datapoints around the
median. This analysis revealed that extrusion rate variations strongly correlated with the DNA diffu-
sion coefficient. The bigger the diffusion coefficient, the greater is the variation (Figure 6D).
Higashi et al. eLife 2021;10:e67530. DOI: https://doi.org/10.7554/eLife.67530 14 of 35Research article Chromosomes and Gene Expression Computational and Systems Biology
A Diffusion only B Diffusion plus ratchet
L
100 100
DNA (out)
Loop length (kb)
Loop length (kb)
80 80
60 60
Smc3
40 40
Smc1
20 Smc3 Smc1 20
D NA (in)
0 20 40 60 80 100 120 0 20 40 60 80 100 120
Time (sec) Time (sec)
C D 0.9
1.0 0.2 μm 2/s 2.5 s -1
Interquartile range (kb/s)
Average LE rate (kb/s)
1.3 μm 2/s 7.5 s-1
0.7
0.8 2.2 μm 2/s 10 s -1
3.6 μm 2/s 12 s -1
0.6 0.5
0.4
0.3
0.2
0.1
0 2 4 6 8 10 12 0 1 2 3 4
ATP turnover rate (s-1) Diffusion coefficient (μm 2 /s)
E 2.5
F
1.2 Ganji et al. 2018
Normalized LE rate
2.0 1 Simulation
LE rate (kb/s)
0.8
Interquartile range
1.5
0.6
1.0
0.4
0.5 0.2
0 0
Davidson This study Simulation 0.2 0.4 0.6 0.8 1
et al. 2019 Force (pN)
Figure 6. Loop extrusion by cohesin as a Brownian ratchet. (A) DNA loop size changes due to diffusion only of both DNAs. (B) DNA loop size changes
due to random diffusion plus directed diffusion generated by cohesin’s gripping to slipping state transition at a rate of 9 s 1. (C) Simulated average
loop extrusion (LE) rates as a function of the cohesin cycle (ATP turnover) rate. Symbol colors represent simulations with the indicated diffusion
coefficients. (D) Scatter in the loop extrusion rates, generated during 3 min simulations and quantified as the interquartile range, shown as a function of
the outbound DNA diffusion coefficient. The diffusion coefficient for the inbound strand was 0.05 mm2/s. Symbol colors indicate simulations with
different cohesin cycle rates. (E) Comparison of experimentally observed LE rate distributions of HeLa cell and recombinant human cohesin (left and
right, Davidson et al., 2019), fission yeast cohesin from Figure 4, and an example of simulated data over the same time interval. (F) Comparison of the
experimentally observed force dependence of condensin LE rates (Ganji et al., 2018) with the simulated outcome. The pink line shows the median
across 35 simulations performed with discrete force values at 0.1 pN increments. The light pink area shows the corresponding interquartile range.
Parameters for the simulations in (E) and (F) were: cohesin cycle rate = 9 s 1, DNA diffusion coefficient = 1.5 mm2/s, simulation time = 3 min.
The online version of this article includes the following figure supplement(s) for figure 6:
Figure 6 continued on next page
Higashi et al. eLife 2021;10:e67530. DOI: https://doi.org/10.7554/eLife.67530 15 of 35Research article Chromosomes and Gene Expression Computational and Systems Biology
Figure 6 continued
Figure supplement 1. Interquartile range of loop extrusion (LE) rates when the DNAs entering and exiting the cohesin ring show divergent diffusion
coefficients.
Of the two DNAs that enter and exit cohesin, additional simulations showed that only the DNA
with the higher diffusion coefficient determines the amount of scatter in extrusion speed (Figure 6—
figure supplement 1). A diffusion coefficient of ~1.5 mm2/s resulted in a good match to the experi-
mentally observed variation (Figure 6E), matching the upper range of experimentally measured val-
ues (Davidson et al., 2016; Kanke et al., 2016; Stigler et al., 2016). We imagine that the outward
pointing DNA, which is not constrained by the Scc2-head module, might not interact strongly with
cohesin and show the greater diffusion coefficient amongst the two DNAs. In addition to the high
variations of loop extrusion rates, the low friction of the outward pointing DNA could also explain
why DNA can be readily pulled from a condensin complex undergoing loop extrusion (Kim et al.,
2020).
Finally, we explored how Brownian ratchet-driven loop extrusion in our model is affected by
external force. If cohesin unfolding in the slipping state is driven by thermal motion, its rate k in
response to external force is given by:
dF
k ¼ ko e kB T
(2)
where k0 is the rate in the absence of external force, F is the external force and d = 30 nm from our
simulations (Howard, 2001). Introducing this dependency into our model, we find good agreement
between simulations in the presence of a range of applied external forces and the experimentally
observed decay of the force-velocity relationship (Figure 6F; Ganji et al., 2018). Both the similarity
between the simulated and experimentally observed responses to external force, as well as the high
variation of experimentally observed loop extrusion rates, support the idea of a largely diffusion-
driven molecular mechanism of loop extrusion.
Symmetric loop extrusion as a special case of asymmetric loop
extrusion
In our molecular model of DNA loop extrusion, the Brownian ratchet acts only on the DNA that
enters the cohesin ring through the Scc2-head module. No directional effect is exerted on the DNA
that exits cohesin. This results in asymmetric loop extrusion (Figure 7A, Asymmetric loop extrusion),
a scenario that is seen in the case of the condensin complex (Ganji et al., 2018; Golfier et al.,
2020). In contrast, both our and the published experimental observations (Davidson et al., 2019;
Kim et al., 2019) suggest that the cohesin complex symmetrically extrudes DNA loops. How could
this difference be explained?
In our model, the cohesin loader is a stable part of the cohesin complex. However, Scc2Mis4 only
weakly binds to the cohesin complex. Suggestive of subunit turnover, the continuous presence of
cohesin loader in the incubation buffer is a requirement for processive loop extrusion by human
cohesin (Davidson et al., 2019). If we picture a situation in which Scc2Mis4 dissociates from the cohe-
sin complex, DNA will be released from the Scc2-head module (Figure 7A, Symmetric loop extru-
sion). The DNAs that enter and exit the cohesin ring are now indistinguishable and, once Scc2Mis4
rebinds, both DNAs have an equal chance to associate with the Scc2-head module during gripping
state formation. Every round of cohesin loader dissociation and reloading thereby results in a one-in-
two chance that the extruded DNA strand switches. Averaged over time, this takes the appearance
of symmetric loop extrusion.
Loop extrusion versus directional cohesin translocation
In addition to loop extrusion, single-molecule studies have reported ATP-dependent unidirectional
cohesin and condensin translocation along DNA (Terakawa et al., 2017; Davidson et al., 2019).
The experimental conditions under which both complexes move along DNA, or extrude DNA loops,
are largely similar. A difference lies in the DNA substrates on which translocation was observed.
These substrates were stretched, either by liquid flow or by being double tethered to a flow cell sur-
face. We have seen above that a Brownian ratchet is able to extrude DNA loops only against very
Higashi et al. eLife 2021;10:e67530. DOI: https://doi.org/10.7554/eLife.67530 16 of 35Research article Chromosomes and Gene Expression Computational and Systems Biology
A Asymmetric loop extrusion Symmetric loop extrusion
Scc2Mis4
dissociation
DNA exchange
Scc2Mis4
reloading
B
Loop extrusion Translocation
Loop translocation Cohesin translocation
Low tension High tension
Topological
loading
Scc2Mis4 reloading
Figure 7. A model for asymmetric and symmetric loop extrusion, as well as possible mechanisms for cohesin translocation along stretched DNA. (A) A
model for symmetric loop extrusion as a special case of asymmetric loop extrusion. Continued action of the Brownian ratchet on the DNA that enters
the cohesin ring results in Asymmetric loop extrusion. If the cohesin loader dissociates, reassembly of the Brownian ratchet following Scc2Mis4 reloading
gives both DNAs an equal chance to become part of the ratchet. Over time, alternating asymmetric extrusion of both DNAs results in apparent
Symmetric loop extrusion. (B) Two possible mechanisms for cohesin translocation along DNA under tension. Loop extrusion is possible only against
very weak DNA counterforces. If loop growth stalls due to DNA tension, the continued operation of the Brownian ratchet leads to Loop translocation.
Figure 7 continued on next page
Higashi et al. eLife 2021;10:e67530. DOI: https://doi.org/10.7554/eLife.67530 17 of 35You can also read