Do Carbon-Plated Running Shoes with Different Characteristics Influence Physiological and Biomechanical Variables during a 10 km Treadmill Run? - MDPI
←
→
Page content transcription
If your browser does not render page correctly, please read the page content below
applied
             sciences
Article
Do Carbon-Plated Running Shoes with Different
Characteristics Influence Physiological and Biomechanical
Variables during a 10 km Treadmill Run?
Pierre Kiesewetter 1, * , Sabrina Bräuer 1 , Ralf Haase 2 , Nico Nitzsche 2 , Christian Mitschke 1
and Thomas L. Milani 1

                                          1   Department of Human Locomotion, Chemnitz University of Technology, 09126 Chemnitz, Germany
                                          2   Department of Sports Medicine/Sports Biology, Chemnitz University of Technology,
                                              09126 Chemnitz, Germany
                                          *   Correspondence: pierre.kiesewetter@hsw.tu-chemnitz.de; Tel.: +49-371-531-31969

                                          Abstract: Footwear properties can influence physiological and biomechanical variables, which may
                                          lead to positive changes in distance running performance. One innovative development in running
                                          shoe technology is adding carbon fiber plates to increase midsole bending stiffness. However, there
                                          are only a few studies investigating the influence of shoe conditions on both physiological and
                                          biomechanical variables, simultaneously, when running for longer than 5 min or for distances > 1 km.
                                          Hence, the purpose of the current study was to investigate the influence of different running shoe
                                          concepts with carbon fiber plates on physiological and biomechanical parameters during a 10 km
                                          treadmill run. Twenty-three athletes participated in the study, which comprised four measurement
                                          days for each subject. On the first day, subjects performed a treadmill exhaustion test to determine
Citation: Kiesewetter, P.; Bräuer, S.;
                                          maximum oxygen uptake. On the second, third, and fourth days, each subject ran 10 km at 70% of their
Haase, R.; Nitzsche, N.; Mitschke, C.;    maximum oxygen uptake in one of three shoe models. Significant differences were found between
Milani, T.L. Do Carbon-Plated             the shoe conditions for the biomechanical parameters, but not for the physiological parameters. It
Running Shoes with Different              seems that runners adjusted their running styles to the shoe conditions during the 10 km run to
Characteristics Influence                 reduce the load on the lower extremities without compromising their endurance performance. These
Physiological and Biomechanical           results may have practical implications for runners, coaches, and shoe manufacturers.
Variables during a 10 km Treadmill
Run? Appl. Sci. 2022, 12, 7949.           Keywords: oxygen uptake; performance; biomechanics; footwear
https://doi.org/10.3390/
app12157949

Academic Editor: Iain Hunter
                                          1. Introduction
Received: 19 July 2022
Accepted: 5 August 2022
                                                Distance running performance can be influenced by a variety of shoe factors. Multiple
Published: 8 August 2022
                                          studies have reported that certain footwear characteristics, such as shoe mass, midsole
                                          bending stiffness (MBS), and foam midsole material, can influence both physiological [1–5]
Publisher’s Note: MDPI stays neutral      and biomechanical variables [6–8]. This, in turn, may result in positive changes in distance
with regard to jurisdictional claims in
                                          running performance.
published maps and institutional affil-
                                                Running economy (RE) is a determinant of distance running performance and is
iations.
                                          defined as the rate of oxygen consumption at a given velocity of submaximal running [9,10].
                                                Shoe mass is a frequently examined footwear property that is related to RE and
                                          performance. Greater shoe mass can lead to increased energy consumption and thus to a
Copyright: © 2022 by the authors.
                                          reduction in RE [1,11]. In 3000 m time trials, Hoogkamer et al. [1] showed that RE degrades
Licensee MDPI, Basel, Switzerland.        and running time increases 0.78% for each additional 100 g per shoe. Furthermore, previous
This article is an open access article    research found that heavier footwear has significant effects on biomechanical parameters
distributed under the terms and           such as ankle joint angles, ankle moments, and plantar pressure during running [12].
conditions of the Creative Commons              The effect of increased MBS is considered a key factor for optimizing running shoes.
Attribution (CC BY) license (https://     It is closely linked to individual runner characteristics (e.g., anthropometrics, strength
creativecommons.org/licenses/by/          capacities, running style), but also related to running speed [13,14] and the rollover feel-
4.0/).                                    ing [15]. It has become increasingly common to use carbon fiber plates in running shoes

Appl. Sci. 2022, 12, 7949. https://doi.org/10.3390/app12157949                                           https://www.mdpi.com/journal/applsci
Appl. Sci. 2022, 12, 7949 2 of 11
to increase MBS to improve distance running performance [6,7]. Recent analyses have
shown that these technological advances in running shoes have resulted in significant
improvements in international half marathon and marathon best times among world-class
athletes [16,17]. However, research shows inhomogeneous results of the effects of MBS on
RE. According to the findings of Roy and Stefanyshyn [18], carbon fiber plates in running
shoes can reduce the energy cost of running by approximately 1%. This varies depending
on the plates’ design (e.g., curved, flat, length) [19]. Recent studies have found that running
with the “Nike Vaporfly 4%” can lead to an increased running economy of approximately
4% on average [6,20]. In addition to varying MBS to improve running performance, several
studies have investigated the effects of midsole stiffness [5,21], midsole thickness [22] and
midsole structure [23]. However, Healey and Hoogkamer [24] found that the curved carbon
fiber plates only play a small role in the 4% metabolic savings generated by the “Nike
Vaporfly 4%”. The authors suggest that the savings likely result from a combination of and
interaction between the midsole foam, shoe geometry, and plate.
From a biomechanical perspective, research shows that increased MBS reduces neg-
ative work at the metatarsophalangeal (MTP) joint and influences joint mechanics in the
ankle and knee [7,25]. Furthermore, Hoogkamer et al. [7] concluded that the energy sav-
ings from the curved carbon fiber plates provided a clever lever effect on the joint ankle
mechanics, a stiffening effect of the plate on the MTP joint, and superior energy stor-
age in the midsole foam. However, current studies have reported conflicting results in
terms of biomechanical variables [26]. Results of spatiotemporal parameters (e.g., ground
contact time or step frequency) were inhomogeneous [6–8,20]. It can be concluded that
there is currently no plausible explanation for improved running performance based on
biomechanical parameters.
To the best of the authors’ knowledge, there are only few studies that have investigated
the influence of different footwear conditions on both physiological and biomechanical
variables simultaneously during endurance runs longer than 1 km. However, it seems
necessary to examine the long-term effects of the different shoe components on running
performance in order to be able to explain (half-) marathon personal best times using
physiological and biomechanical variables.
Therefore, the purpose of this study was to investigate the influence of different
running shoe concepts with carbon fiber plates on physiological (e.g., oxygen consumption
.
(VO2 )) and biomechanical (e.g., peak tibial acceleration (PTA)) parameters in runners
during a 10 km run. We hypothesized that different shoe properties (midsole bending
stiffness, midsole stiffness) but similar shoe mass have an influence on a) biomechanical
variables and b) physiological variables when running at 70% of subjects’ maximum oxygen
.
uptake (VO2 max).
2. Materials and Methods
2.1. Participants
Twenty-three athletes without any injuries in the last six months participated in this
study (mean ± SD; age: 35.2 ± 10.4 years, body height: 176.7 ± 5.1 cm, body mass:
70.3 ± 8.4 kg, weekly running distance: 45.3 ± 23.6 km). The subjects were informed about
the purpose and design of the study, signed an informed consent document, and completed
a form with their personalized data. All procedures were performed in accordance with the
recommendations of the Declaration of Helsinki. This study was approved by the Ethics
Committee of the Faculty of Behavioural and Social Sciences of the Chemnitz University of
Technology (#101501815).
2.2. Footwear Conditions
Three shoes with different construction concepts were used in this study (Figure 1).
The shoes, the “Puma Fast-FWD” (S1), the “Puma Fast-R” (S2) and the “Nike Vaporfly
Next%” (S3) (UK sizes 8 and 10), differed in sole geometry and in the type of carbon fiber
plates incorporated in the midsole material. The shoes were similar with regard to weight.2.2. Footwear Conditions
Three shoes with different construction concepts were used in this study (Figure 1).
The shoes, the “Puma Fast-FWD” (S1), the “Puma Fast-R” (S2) and the “Nike Vaporfly
Appl. Sci. 2022, 12, 7949 (S3) (UK sizes 8 and 10), differed in sole geometry and in the type of carbon fiber
Next%” 3 of 11
plates incorporated in the midsole material. The shoes were similar with regard to weight.
S1 S2 S3
Figure 1. The test shoes used in this study. Left: “Puma Fast-FWD” (S1), Middle: "Puma Fast-R" (S2)
1. The test
Figure Next%"
and Right: "Nike Vaporfly shoes used in this study. Left: “Puma Fast-FWD” (S1), Middle: “Puma Fast-R”
(S3).
(S2) and Right: “Nike Vaporfly Next%” (S3).
To quantify both Tomidsole
quantifystiffness and stiffness
both midsole midsoleandbending
midsolestiffness, the shoes
bending stiffness, werewere tested
the shoes
tested in a servo-hydraulic device (HC10,
in a servo-hydraulic Zwick Zwick
device (HC10, GmbHGmbH& Co. & KG, Ulm,
Co. KG, Ulm,Germany)
Germany)as as described
described in Schwanitz and Odenwald
in Schwanitz [27], and
and Odenwald [27], Bräuer et al.et[15]
and Bräuer (Table
al. [15] 1).1).
(Table
Table
Table 1. Characteristics Characteristics
of1.shoe conditionsoffor
shoe conditions
men’s for men’s size UK8.
size UK8.
Rearfoot BendingForefootRearfoot Forefoot Rearfoot Forefoot
Rearfoot Rearfoot
Forefoot Forefoot
Bending Weight [g] Stiffness Rearfoot
Stiffness Stiffness Forefoot
Height Height EnergyLost Energy
ght [g] Stiffness Stiffness Energy Lost Energy
Stiffness [N] [N] Height [mm]
[N/mm] [N/mm]Height [mm]
[mm] [mm] Lost [%] Lost [%]
[N/mm] [N/mm] [%] [%]
S1 172.4 130 284
72.4 130 284 215 25.7 215 26.325.7 26.3
21 21
21 21
S2 203.0 104 209 226 31.0 28.2 19 12
03.0 104
S3 183.1209 107 226 194 31.0 180 28.229.2 19
29.4 12
14 15
83.1 107 194 180 29.2 29.4 14 15
2.3. Experimental Setup and Procedures
2.3. Experimental Setup and Procedures
The study comprised four measurement days for each subject. On the first day, the
.
The study comprised four measurement days for each subject. On the first day, the
subjects performed a treadmill exhaustion test to determine VO2 max. During the second,
subjects performedthird,
a treadmill exhaustion test todays,
determine ̇
VO2max. During
and fourth measurement each subject ran 10 km inthe second,
different shoe models
third, and fourth measurement days, each subject ran 10 km in different
(S1, S2, and S3) in randomized order at an individual speed based on the shoe models (S1,
results of the
S2, and S3) in randomized orderThe
exhaustion test. at time
an individual speed based
of the measurements could onbethe results
chosen of by
freely thethe subjects.
exhaustion test. TheHowever,
time ofmeasurements
the measurements should could
alwaysbetake place freely
chosen at the same
by the time with a minimum
subjects.
of one week
However, measurements shouldbetween
always measurement
take place days
at theinsame
ordertime
to minimize the influence
with a minimum of of the time
of day and to avoid training effects. Previous studies
one week between measurement days in order to minimize the influence of the time of reported good reliability using
this procedure [28,29]. In addition, inertial sensors (Opal-Sensor, APDM, Portland, OR,
day and to avoid training effects. Previous studies reported good reliability using this
USA, mass 25 g) were used to record biomechanical parameters. A stationary metabolic
procedure [28,29]. analysis
In addition, inertial sensors (Opal-Sensor, APDM, Portland, OR, USA,
system (Metalyzer 3B, CORTEX Biophysik GmbH, Leipzig, Germany) was used to
mass 25 g) were used to record biomechanical parameters. . A stationary metabolic analysis
measure oxygen consumption (VO2 ) during running on a treadmill (h/p/cosmos® quasar
system (Metalyzer5.0,3B, CORTEX Biophysik GmbH, Leipzig,
h/p/cosmos sports & medical GmbH, Nussdorf-Traunstein, Germany) was used to
Germany). Prior to data
measure oxygen consumption (V ̇ O 2) during running on a treadmill (h/p/cosmos ®
collection, the system was calibrated according to manufacturer’s recommendations usingquasar
5.0, h/p/cosmos sports
ambient& medical GmbH,gas
air and known Nussdorf-Traunstein,
concentrations. The volumeGermany).was Prior to data
calibrated using a 3-liter
® , H7, Kempele,
collection, the system was calibrated
syringe. Heart rate according to manufacturer’s
(HR) was recorded using a Polarrecommendations
chest strap (Polarusing
Finland).
ambient air and known gasThe incline of the The
concentrations. treadmill was was
volume set atcalibrated
1% to compensate for air resistance
using a 3-liter
for all running sessions [30,31]. To prevent falls runners
syringe. Heart rate (HR) was recorded using a Polar chest strap (Polar , H7, Kempele, wore
® a security belt during all
treadmill tests.
Finland). The incline of the treadmill was set at 1% to compensate for air resistance for all
running sessions [30,31]. To prevent
2.3.1. Exhaustion falls runners wore a security belt during all treadmill
Test
tests. Subjects wore their own shoes for the exhaustion test. After a warm-up of at least 5 min
at their individual pace to familiarize themselves with the treadmill, participants completed
a modified ramp protocol according to [32]. The ramp test to exhaustion was performed to
.
determine VO2 max as a baseline for the subsequent 10 km runs. After resting for 2 min, the
treadmill speed was set to 8 km/h for 3 min, and velocity was then increased by 1.2 km/h
every minute until volitional exhaustion or abort criteria occurred, such as cardiovascular
. .
problems or pain [33]. The highest VO2 over 30 s was considered VO2 max [34].Appl. Sci. 2022, 12, 7949 4 of 11
2.3.2. 10 km Tests
Subjects began with a 5-min warm-up trial at a self-selected speed in their own shoes.
Following the warm-up, subjects completed a 10 km run with the first pair of running shoes
to be tested. Following the methods of previous studies, running speed was set individually
.
at 70% of VO2 max for each subject [35,36]. Two lightweight inertial measurement units
(IMU) combining a tri-axial accelerometer (measurement range 1982 m/s2 ) and a tri-axial
gyroscope (measurement range ±2000◦ /s) were used to measure biomechanical data
during the 10 km tests. One IMU was attached to the shaved skin at the medial aspect
and midway between the malleolus and the plateau of the right tibia using double-sided
adhesive tape. Furthermore, an elastic strap and a compression sleeve for calves were used
to stabilize the accelerometer and prevent excessive movements due its own weight. The
sensate axis of the IMU was aligned with the longitudinal axis of the tibia according to
Hennig et al. [37]. The second sensor was attached to the heel cap of the right running shoe
using a sturdy lightweight sensor mount printed with a 3D printer.
2.4. Data Analysis
Raw data from the IMUs were analyzed in post-processing using MATLAB 2021a
(MathWorksTM, Natick, MA, USA). Prior to all processing steps, data were filtered using a
zero-lag Butterworth low-pass filter (accelerometers: 4th order at 80 Hz; gyroscopes: 4th
order at 50 Hz) to remove noise. To separate the strides in continuous data, the vertical
acceleration signal of the IMU mounted to the heel cap was zero-lag Butterworth high-pass
filtered (80 Hz). The first peak in the filtered signal was defined as the initial ground contact
of the foot [38,39].
Biomechanical variables
To examine shoe rollover, the maximum angular velocity in the sagittal plane of the
shoe was analyzed according to [15], and the peak angular velocity (PAV) was extracted
within 200 ms after initial ground contact. The angular velocity in the frontal plane of the
shoe was used to determine the peak eversion velocity (evVel) [40]. To determine the heel
strike angle at initial ground contact time (HSA), the shoe orientation angle in the sagittal
plane was calculated using data from the IMU mounted to the heel cap as described in
Mitschke et al. [41]. The maximum IMU acceleration (within 200 ms after initial ground
contact) at the tibia was used to identify peak tibial acceleration (PTA).
Physiological variables
.
HR and VO2 were provided by Metasoft Studio (CORTEX Biophysik GmbH, Leipzig,
.
Germany). Relative oxygen uptake (rel. VO2 ) was calculated by dividing subjects’ VO2
by their individual body mass (kg). A standard method of assessing RE is to look at
.
the amount of VO2 required to run a kilometer at a predefined running speed [42]. The
following Equation (1) was used to determine RE:
.
rel. VO2
RE = (1)
v 70% o f .
rel. VO2 max
.
For the exhaustion test, VO2 max was calculated as the mean of the highest 30 s to
volitional exhaustion. For the 10 km tests, both biomechanical and physiological variables
were calculated from the mean of all strides over the last 5 min of the run.
2.5. Statistical Analysis
Mean and standard deviations (mean ± SD) were calculated for the biomechanical and
physiological variables. Given that the variables were normally distributed according to the
Shapiro–Wilk test, a one-way analysis of variance (ANOVA) for repeated measurements
followed by the Bonferroni post-hoc test was used to determine whether differences existed
between the footwear conditions regarding biomechanical and physiological variables.
Statistical significance was set at α = 0.05 for all analyses. In addition, effect size (Cohen’sAppl. Sci. 2022, 12, 7949 5 of 11
d) was calculated to quantify the magnitude of differences when statistical significance
was found. The coefficients were interpreted as trivial (d < 0.2), small (d < 0.5), medium
(d < 0.8), or large effects (d ≥ 0.8) [43].
3. Results
3.1. Exhaustion Test
Table 2 represents the results from the exhaustion test.
Table 2. Group mean ± standard deviation of the exhaustion test for physiological variables (all subjects).
. Rel. 70%
. of rel. v70% of rel.
HRmax . HR70% of rel.
VO2 max vmax [km/h] VO2 max VO2 max .
[bpm] VO2 max [bpm]
[mL/kg/min] [mL/kg/min] [km/h]
Mean 59.3 18.5 185.5 41.5 12.2 155.2
± ± ± ± ± ± ±
SD 7.8 2.1 10.6 5.4 1.6 12.6
3.2. 10 km Tests
3.2.1. Physiological variables
The physiological data showed no significant differences between shoe conditions.
.
(Figure 2a–c). For rel. VO2 , the range was between 42.0 ± 5.4 mL/min/kg for S2 and
42.3 ± 5.3 mL/min/kg for S1. Similar trends were seen in RE and HR. S2 showed the best
values for RE (207.8 ± 13.1 mL/kg/km) and for HR (162.1 ± 14.4 bpm), and S1 the worst
values (209.5 ± 12.8 mL/kg/km), respectively (164.6 ± 16.6 bpm).
a 100 b 250
rel. VO2 [ml/min/kg]
80 200
RE [ml/kg/km]
60 150
40 100
20 50
0 0
S1 S2 S3 S1 S2 S3
c 200
150
HR [bpm]
100
50
0
S1 S2 S3
.
Figure
Figure2.2.Comparison
Comparisonofofshoe
shoeconditions
conditions.Panel
Panela:(a):
relative oxygen
relative consumption
oxygen consumption V̇OVO
(rel.(rel. 2); ); Panel
2
Panel b: running
(b): running economy
economy (RE),
(RE), andand Panel
Panel (c):c:heart
heartrate
rate(HR).
(HR).NoNostatistical
statisticaldifferences
differenceswerewerefound for
found for any variables
any variables between between shoe conditions.
shoe conditions.Appl. Sci. 2022, 12, 7949 6 of 11
3.2.2. Biomechanical Variables
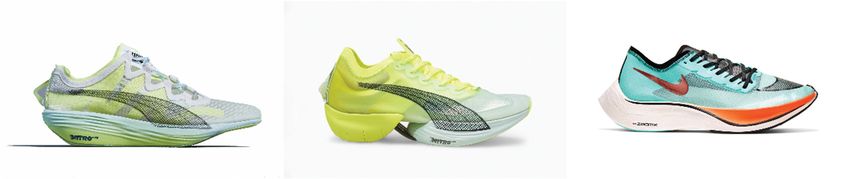
Figure 3 shows the results for biomechanical parameters of the 10 km tests. For PAV,
Appl. Sci. 2022, 12, 7949 7 of 12
the ANOVA revealed significant differences (p = 0.004) and a small effect (d = 0.45) between
S1 (757.8 ± 105.2 deg/s) and S3 (814.1 ± 142.7 deg/s) (Figure 3a).
Figure 3.
Figure 3. Comparison
Comparison of ofshoe
shoeconditions
conditionsfor:
for:(a)(a) peak
peak angular
angular velocity
velocity (PAV);
(PAV); (b) maximum
(b) maximum eversion
eversion velocity; (c) heal strike angle and (HSA); and (d) peak tibial acceleration (PTA). Significant
velocity; (c) heal strike angle and (HSA); and (d) peak tibial acceleration (PTA). Significant differences
differences between shoe conditions are marked with * (p < 0.05) and ** (p < 0.001).
between shoe conditions are marked with * (p < 0.05) and ** (p < 0.001).
When comparing evVel, highly significant differences (p < 0.001) and large effects (d
When comparing evVel, highly significant differences (p < 0.001) and large effects
≥ 0.8) were found between S1 (552.1 ± 162.2 deg/s) and S2 (407.3 ± 124.9 deg/s) and between
(d ≥ 0.8) were found between S1 (552.1 ± 162.2 deg/s) and S2 (407.3 ± 124.9 deg/s) and
S1 and S3 (431.5 ± 111.4 deg/s); (p < 0.001; d ≥ 0.8) (Figure 3b).
between S1 and S3 (431.5 ± 111.4 deg/s); (p < 0.001; d ≥ 0.8) (Figure 3b).
The analysis of HSA revealed the lowest value for S1 (25.2 ± 4.0 deg) and the highest
The analysis of HSA revealed the lowest value for S1 (25.2 ± 4.0 deg) and the highest
value for S3 (31.1 ± 5.1 deg) (Figure 3c). The ANOVA showed highly significant differences
value for S3 (31.1 ± 5.1 deg) (Figure 3c). The ANOVA showed highly significant differences
between S1 and S2 (p < 0.001) and between S1 and S3 (p < 0.001). Cohen´s d showed large
between S1 and S2 (p < 0.001) and between S1 and S3 (p < 0.001). Cohen´s d showed large
effects (d ≥ 0.8) for both significant pairwise comparisons. No significant differences were
effects (d ≥ 0.8) for both significant pairwise comparisons. No significant differences were
found for PTA when comparing shoe conditions (Figure 3d). The values were 7.5 ± 2.3 g
found for PTA when comparing shoe conditions (Figure 3d). The values were 7.5 ± 2.3 g
for S1, 7.2 ± 2.3 g for S2 and 7.3 ± 2.2 g for S3.
for S1, 7.2 ± 2.3 g for S2 and 7.3 ± 2.2 g for S3.
4. Discussion
4. Discussion
The aim of the present study was to investigate the influence of different running
The aim of the present study was to investigate the influence of different running shoe
shoe concepts with carbon fiber plates and different material properties on both
concepts withand
physiological carbon fiber plates
biomechanical and different
variables during material properties
a 10 km treadmill run.on
Toboth physiological
provoke great
and biomechanical variables during a 10 km treadmill run. To provoke great
influence on the examined parameters, shoes with different materials and geometries, influence
but
on the examined
similar parameters,
weights were used. We shoes with different
hypothesized that materials and geometries,
these distinctly but similar
different footwear
conditions influence (a) biomechanical and (b) physiological variables.
The biomechanical results show that the subjects adjusted their running style in
response to the different shoe properties. Therefore, hypothesis (a) was confirmed.Appl. Sci. 2022, 12, 7949 7 of 11
weights were used. We hypothesized that these distinctly different footwear conditions
influence (a) biomechanical and (b) physiological variables.
The biomechanical results show that the subjects adjusted their running style in
response to the different shoe properties. Therefore, hypothesis (a) was confirmed.
PAV (757.8 ± 105.2 deg/s) and HSA (25.2 ± 4.0 deg) were significantly lower in S1,
compared to S2 and S3. In addition, evVel (552.1 ± 162.2 deg/s) was significantly higher
in S1 in contrast to the other shoes. Contrary to the mentioned parameters, PTA was not
influenced by shoe conditions. In general, no significant differences were found for the
biomechanical variables when comparing S2 and S3. It appears that running in the shoe
with the highest midsole stiffness in the rearfoot and the lowest rearfoot height (Table 1)
led to a distinct adjustment of the running style as a mechanism of shock absorption
during the landing phase. The results HSA and PAV were consistent with the findings
of Heidenfelder et al. [44]. The authors found significantly lower values for the shoe
with the flattest construction and the lowest cushioning. Additionally, Law et al. [45] also
demonstrated that a shoe with thinner midsoles can lead to lower HSA due to reduced
cushioning and subsequently to greater discomfort [46]. For evVel, a similar trend as in
our study was found by other authors. For example, the lowest evVel for the shoe with the
highest rearfoot cushioning and the highest evVel for the shoe with the hardest midsole was
observed by Sterzing et al. [47] when comparing six shoes differing in midsole hardness,
and by Mitschke et al. [40] when comparing three shoes with different midsole properties
when running at different velocities. It seems that runners reduced HSA and PAV and
increased evVel to protect the lower extremities from impact forces during the landing
phase when running in flatter shoes with less cushioning. In the current study, this led to
PTA values that were similar for all three shoe conditions. This is in contrast to most studies
that found higher values for PTA or force rising rates (measured with force plates) when
running in harder shoes [47–49]. However, most of these data were examined on short-term
measurements on treadmills (Appl. Sci. 2022, 12, 7949 8 of 11
found a “U-shaped” curve relationship between MBS and RE and concluded that a running
shoe with medium MBS improves RE compared to more flexible or stiffer MBS. In the
present study, MBS ranged from 104 to 130 N/mm. Comparing the reported MBS values
with the aforementioned studies is difficult because of the different test procedures used to
determine MBS. We found no significant differences in physiological variables between
shoe conditions. However, our data shows the same tendency as found by [6,13,18]. Shoes
.
S2 and S3 (lower MBS) showed lower HR, rel. VO2 , and RE than S1 (highest MBS). One
reason for similar performance results may be the additional influence of midsole stiffness.
Adjusting the midsole stiffness to enhance running performance has been investigated
in several studies [5,21,52]. However, adjusting midsole stiffness is also controversial. For
example, Frederick et al. [53] reported lower oxygen consumption while running in shoes
with softer midsoles. In contrast, Bosco and Rusko [54] provided data showing greater
values for oxygen consumption when running in shoes with softer midsoles compared
to harder shoes. Additionally, Mitschke et al. [21] found no significant differences in rel.
.
VO2 or HR when running below and slightly above the individual ventilatory threshold in
distinctly different shoe conditions (cushioning and energy loss). Our results show that
neither MBS nor midsole properties influenced physiological variables in our study.
It seems that runners adjusted their running styles, especially the foot strike pattern,
.
during the 10 km run at 70% of rel. VO2 max to reduce the load on lower extremities.
.
However, RE, HR, or rel. VO2 were not affected by the adapted running styles. Run-
.
ning at higher velocities (e.g., at 75 or 80% VO2 max) could lead to greater differences in
biomechanical and physiological parameters.
This study has a few limitations that should be mentioned. First, our test group
consisted mainly of recreational runners with a wide range of running speeds for the 10 km
tests (8.0 to 14.2 km/h), since RE improvement be speed dependent [14]. The runners in
this study preferred stiffer shoes when running velocities over 17 km/h. Future studies
should focus on high-level runners who can achieve the required running speed. Second, in
our study we did not collect data about the perception of footwear. Since there is evidence
relating to improved running economy when wearing more comfortable compared to less
comfortable footwear [55], follow-up studies should include subjective measurements.
Third, compared to outdoor running, running on the treadmill shows some differences
in terms of biomechanical parameters, such as sagittal foot strike angle or knee flexion at
foot strike [56]. These small differences could be due to insufficient experience running
on a treadmill, surface stiffness, and differences in air resistance, and result in limited
transferability to outdoor measurements, since there is evidence that RE differs between
treadmill and track running [57]. Future studies should be conducted under field conditions
to achieve more realistic results.
5. Conclusions
.
Our study found that running at 70% of rel. VO2 max in shoes with different character-
istics impacts biomechanical parameters, but does not influence physiological parameters.
It seems that runners adapt their running style to different shoe conditions to reduce impact
forces during landing without compromising their endurance performance. Our test condi-
tions were limited to a laboratory setting when using a stationary metabolic analysis system.
Therefore, subsequent studies based on this methodology and using mobile spirometry in
combination with the IMUs should be performed under field conditions to obtain more
realistic information, since running kinematics differ under laboratory conditions.
Author Contributions: Conceptualization, P.K., C.M. and T.L.M.; methodology, P.K., R.H., N.N. and
C.M.; formal analysis, P.K. and C.M.; investigation, P.K., S.B. and C.M.; data curation, P.K., R.H., N.N.
and C.M.; writing—original draft preparation, P.K., S.B., R.H., N.N. and C.M.; writing—review and
editing, T.L.M. All authors have read and agreed to the published version of the manuscript.Appl. Sci. 2022, 12, 7949 9 of 11
Funding: The publication of this article was funded by Chemnitz University of Technology and by
the Deutsche Forschungsgemeinschaft (DFG, German Research Foundation)—491193532.
Institutional Review Board Statement: The study was conducted in accordance with the Declaration
of Helsinki, and approved by the Ethics Committee of the Faculty of Behavioural and Social Sciences
at Chemnitz University of Technology (#101501815).
Informed Consent Statement: Informed consent was obtained from all subjects involved in the study.
Data Availability Statement: The data presented in this study are available on request from the
corresponding author.
Acknowledgments: We would like to thank all subjects for participating in this study. We are very
grateful to Lisa Peterson for proofreading the paper as a native speaker. This research was supported
by Puma Inc., Herzogenaurach, Germany.
Conflicts of Interest: The authors declare no conflict of interest. The funders had no role in the design
of the study; in the collection, analyses, or interpretation of data; in writing the manuscript, or in the
decision to publish the results.
References
1. Hoogkamer, W.; Kipp, S.; Spiering, B.A.; Kram, R. Altered Running Economy Directly Translates to Altered Distance-Running
Performance. Med. Sci. Sports Exerc. 2016, 48, 2175–2180. [CrossRef] [PubMed]
2. Dinato, R.C.; Cruz, R.; Azevedo, R.A.; Hasegawa, J.S.; Silva, R.G.; Ribeiro, A.P.; Lima-Silva, A.E.; Bertuzzi, R. Footwear designed to
enhance energy return improves running economy compared to a minimalist footwear: Does it matter for running performance?
Braz. J. Med. Biol. Res. 2021, 54, e10693. [CrossRef] [PubMed]
3. Hébert-Losier, K.; Finlayson, S.J.; Driller, M.W.; Dubois, B.; Esculier, J.-F.; Beaven, C.M. Metabolic and performance responses
of male runners wearing 3 types of footwear: Nike Vaporfly 4%, Saucony Endorphin racing flats, and their own shoes. J. Sport
Health Sci. 2022, 11, 275–284. [CrossRef]
4. Joubert, D.P.; Jones, G.P. A comparison of running economy across seven highly cushioned racing shoes with carbon-fibre plates.
Footwear Sci. 2022, 14, 71–83. [CrossRef]
5. Worobets, J.; Wannop, J.W.; Tomaras, E.; Stefanyshyn, D. Softer and more resilient running shoe cushioning properties enhance
running economy. Footwear Sci. 2014, 6, 147–153. [CrossRef]
6. Hoogkamer, W.; Kipp, S.; Frank, J.H.; Farina, E.M.; Luo, G.; Kram, R. A Comparison of the Energetic Cost of Running in Marathon
Racing Shoes. Sports Med. 2018, 48, 1009–1019. [CrossRef]
7. Hoogkamer, W.; Kipp, S.; Kram, R. The Biomechanics of Competitive Male Runners in Three Marathon Racing Shoes: A Random-
ized Crossover Study. Sports Med. 2019, 49, 133–143. [CrossRef]
8. Hunter, I.; McLeod, A.; Valentine, D.; Low, T.; Ward, J.; Hager, R. Running economy, mechanics, and marathon racing shoes.
J. Sports Sci. 2019, 37, 2367–2373. [CrossRef]
9. Conley, D.L.; Krahenbuhl, G.S. Running Economy and Distance Running Performance of Highly Trained Athletes. Med. Sci.
Sports Exerc. 1980, 12, 357–360. [CrossRef]
10. Barnes, K.R.; Kilding, A.E. Strategies to Improve Running Economy. Sports Med. 2015, 45, 37–56. [CrossRef]
11. Fuller, J.T.; Bellenger, C.R.; Thewlis, D.; Tsiros, M.D.; Buckley, J.D. The Effect of Footwear on Running Performance and Running
Economy in Distance Runners. Sports Med. 2015, 45, 411–422. [CrossRef] [PubMed]
12. Hoitz, F.; Vienneau, J.; Nigg, B.M. Influence of running shoes on muscle activity. PLoS ONE 2020, 15, e0239852. [CrossRef]
[PubMed]
13. Willwacher, S.; König, M.; Braunstein, B.; Goldmann, J.-P.; Brueggemann, P. The gearing function of midsole longitudinal bending
stiffness in running. Footwear Sci. 2013, 5, S109–S111. [CrossRef]
14. Day, E.; Hahn, M. Optimal footwear longitudinal bending stiffness to improve running economy is speed dependent. Footwear
Sci. 2020, 12, 3–13. [CrossRef]
15. Bräuer, S.; Kiesewetter, P.; Milani, T.L.; Mitschke, C. The ‘Ride’ Feeling during Running under Field Conditions—Objectified with
a Single Inertial Measurement Unit. Sensors 2021, 21, 5010. [CrossRef]
16. Bermon, S.; Garrandes, F.; Szabo, A.; Berkovics, I.; Adami, P.E. Effect of Advanced Shoe Technology on the Evolution of Road
Race Times in Male and Female Elite Runners. Front. Sports Act. Living 2021, 3, 653173. [CrossRef]
17. Senefeld, J.W.; Haischer, M.H.; Jones, A.M.; Wiggins, C.C.; Beilfuss, R.; Joyner, M.J.; Hunter, S.K. Technological advances in elite
marathon performance. J. Appl. Physiol. 2021, 130, 2002–2008. [CrossRef]
18. Roy, J.-P.R.; Stefanyshyn, D.J. Shoe Midsole Longitudinal Bending Stiffness and Running Economy, Joint Energy, and EMG. Med.
Sci. Sports Exerc. 2006, 38, 562–569. [CrossRef]
19. Nigg, B.M.; Cigoja, S.; Nigg, S.R. Effects of running shoe construction on performance in long distance running. Footwear Sci.
2020, 12, 133–138. [CrossRef]Appl. Sci. 2022, 12, 7949 10 of 11
20. Barnes, K.R.; Kilding, A.E. A Randomized Crossover Study Investigating the Running Economy of Highly-Trained Male and
Female Distance Runners in Marathon Racing Shoes versus Track Spikes. Sports Med. 2019, 49, 331–342. [CrossRef]
21. Mitschke, C.; Karger, K.; Milani, T.L. Differences in Mechanical Midsole Characteristics of Running Shoes Do Not Influence
Physiological Variables in Aerobic and Anaerobic Running. J. Hum. Kinet. 2019, 69, 29–38. [CrossRef] [PubMed]
22. Chambon, N.; Delattre, N.; Guéguen, N.; Berton, E.; Rao, G. Is midsole thickness a key parameter for the running pattern? Gait
Posture 2014, 40, 58–63. [CrossRef] [PubMed]
23. Wunsch, T.; Alexander, N.; Kröll, J.; Stöggl, T.; Schwameder, H. Effects of a leaf spring structured midsole on joint mechanics and
lower limb muscle forces in running. PLoS ONE 2017, 12, e0172287. [CrossRef] [PubMed]
24. Healey, L.A.; Hoogkamer, W. Longitudinal bending stiffness does not affect running economy in Nike Vaporfly Shoes. J. Sport
Health Sci. 2022, 11, 285–292. [CrossRef] [PubMed]
25. Cigoja, S.; Firminger, C.R.; Asmussen, M.J.; Fletcher, J.R.; Edwards, W.B.; Nigg, B.M. Does increased midsole bending stiffness of
sport shoes redistribute lower limb joint work during running? J. Sci. Med. Sport 2019, 22, 1272–1277. [CrossRef]
26. Patoz, A.; Lussiana, T.; Breine, B.; Gindre, C. The Nike Vaporfly 4%: A game changer to improve performance without
biomechanical explanation yet. Footwear Sci. 2022. [CrossRef]
27. Schwanitz, S.; Odenwald, S. Long-term Cushioning Properties of Running Shoes. Eng. Sport 2008, 7, 95–100. [CrossRef]
28. Driller, M.; Brophy-Williams, N.; Walker, A. The Reliability of a 5km Run Test on a Motorized Treadmill. Meas. Phys. Educ. Exerc.
Sci. 2017, 21, 121–126. [CrossRef]
29. Saunders, P.U.; Pyne, D.B.; Telford, R.D.; Hawley, J.A. Reliability and Variability of Running Economy in Elite Distance Runners.
Med. Sci. Sports Exerc. 2004, 36, 1972–1976. [CrossRef]
30. Hanson, N.J.; Berg, K.; Deka, P.; Meendering, J.R.; Ryan, C. Oxygen Cost of Running Barefoot vs. Running Shod. Int. J. Sports Med.
2011, 32, 401–406. [CrossRef]
31. Jones, A.M.; Doust, J.H. A 1% treadmill grade most accurately reflects the energetic cost of outdoor running. J. Sports Sci. 1996, 14,
321–327. [CrossRef] [PubMed] .
32. Lourenço, T.F.; Martins, L.E.B.; Tessutti, L.S.; Brenzikofer, R.; Macedo, D.V. Reproducibility of an Incremental Treadmill Vo2 max
Test with Gas Exchange Analysis for Runners. J. Strength Cond. Res. 2011, 25, 1994–1999. [CrossRef] [PubMed]
33. Steinacker, J.M.; Liu, Y.; Reißnecker, S. Abbruchkriterien Bei Der Ergometrie. Dtsch. Z. Sportmed. 2002, 53, 228–229.
34. Robergs, R.A.; Dwyer, D.; Astorino, T. Recommendations for Improved Data Processing from Expired Gas Analysis Indirect
Calorimetry. Sports Med. 2010, 40, 95–111. [CrossRef]
35. Xu, F.; Montgomery, D.L. Effect of Prolonged Exercise at 65 and 80 % of VO2 max on Running Economy. Int. J. Sports Med. 1995,
16, 309–313. [CrossRef]
36. Scharhag-Rosenberger, F.; Meyer, T.; Gäßler, N.; Faude, O.; Kindermann, W. Exercise at given percentages of VO2max: Heteroge-
neous metabolic responses between individuals. J. Sci. Med. Sport 2010, 13, 74–79. [CrossRef]
37. Hennig, E.M.; Milani, T.L.; Lafortune, M.A. Use of Ground Reaction Force Parameters in Predicting Peak Tibial Accelerations in
Running. J. Appl. Biomech. 1993, 9, 306–314. [CrossRef]
38. Mitschke, C.; Heß, T.; Milani, T.L. Which Method Detects Foot Strike in Rearfoot and Forefoot Runners Accurately when Using an
Inertial Measurement Unit? Appl. Sci. 2017, 7, 959. [CrossRef]
39. Maiwald, C.; Dannemann, A.; Gaudel, J.; Oriwol, D. A simple method to detect stride intervals in continuous acceleration and
gyroscope data recorded during treadmill running. Footwear Sci. 2015, 7, S143–S144. [CrossRef]
40. Mitschke, C.; Öhmichen, M.; Milani, T.L. A Single Gyroscope Can Be Used to Accurately Determine Peak Eversion Velocity
during Locomotion at Different Speeds and in Various Shoes. Appl. Sci. 2017, 7, 659. [CrossRef]
41. Mitschke, C.; Zaumseil, F.; Milani, T.L. The influence of inertial sensor sampling frequency on the accuracy of measurement
parameters in rearfoot running. Comput. Methods Biomech. Biomed. Eng. 2017, 20, 1502–1511. [CrossRef] [PubMed]
42. Foster, C.; Lucia, A. Running Economy: The Forgotten Factor in Elite Performance. Sports Med. 2007, 37, 316–319. [CrossRef]
[PubMed]
43. Cohen, J. A Power Primer. Psychol. Bull. 1992, 112, 155–159. [CrossRef] [PubMed]
44. Heidenfelder, J.; Sterzing, T.; Bullmann, M.; Milani, T.L. Heel strike angle and foot angular velocity in the sagittal plane during
running in different shoe conditions. J. Foot Ankle Res. 2008, 1, O16. [CrossRef]
45. Law, M.H.C.; Choi, E.M.F.; Law, S.H.Y.; Chan, S.S.C.; Wong, S.M.S.; Ching, E.C.K.; Chan, Z.Y.S.; Zhang, J.H.; Lam, G.W.K.;
Lau, F.O.Y.; et al. Effects of footwear midsole thickness on running biomechanics. J. Sports Sci. 2019, 37, 1004–1010. [CrossRef]
46. Lieberman, D.E.; Venkadesan, M.; Werbel, W.A.; Daoud, A.I.; D’Andrea, S.; Davis, I.S.; Mang’Eni, R.O.; Pitsiladis, Y. Foot strike
patterns and collision forces in habitually barefoot versus shod runners. Nature 2010, 463, 531–535. [CrossRef]
47. Sterzing, T.; Schweiger, V.; Ding, R.; Cheung, J.T.-M.; Brauner, T. Influence of rearfoot and forefoot midsole hardness on
biomechanical and perception variables during heel-toe running. Footwear Sci. 2013, 5, 71–79. [CrossRef]
48. Mitschke, C.; Kiesewetter, P.; Milani, T.L. The Effect of the Accelerometer Operating Range on Biomechanical Parameters: Stride
Length, Velocity, and Peak Tibial Acceleration during Running. Sensors 2018, 18, 130. [CrossRef]
49. Heidenfelder, J.; Sterzing, T.; Milani, T.L. Systematically modified crash-pad reduces impact shock in running shoes. Footwear Sci.
2010, 2, 85–91. [CrossRef]
50. Fuller, J.T.; Thewlis, D.; Tsiros, M.D.; Brown, N.A.T.; Buckley, J.D. The long-term effect of minimalist shoes on running performance
and injury: Design of a randomised controlled trial. BMJ Open 2015, 5, e008307. [CrossRef]Appl. Sci. 2022, 12, 7949 11 of 11
51. Sakaguchi, M.; Wannop, J.; Madden, R.; Koska, D.; Stefanyshyn, D. Effects of shoe bending stiffness and surface stiffness on lower
extremity biomechanics during running. Footwear Sci. 2015, 7, S4–S6. [CrossRef]
52. Nigg, B.M.; Stefanyshyn, D.; Cole, G.; Stergiou, P.; Miller, J. The effect of material characteristics of shoe soles on muscle activation
and energy aspects during running. J. Biomech. 2003, 36, 569–575. [CrossRef]
53. Frederick, E.C.; Howley, E.T.; Powers, S.K. Lower Oxygen Demands of Running in Soft-Soled Shoes. Res. Q. Exerc. Sport 1986, 57,
174–177. [CrossRef]
54. Bosco, C.; Rusko, H. The effect of prolonged skeletal muscle stretch-shortening cycle on recoil of elastic energy and on energy
expenditure. Acta Physiol. Scand. 1983, 119, 219–224. [CrossRef]
55. Van Alsenoy, K.; van der Linden, M.L.; Girard, O.; Santos, D. Increased footwear comfort is associated with improved running
economy—A systematic review and meta-analysis. Eur. J. Sport Sci. 2021, 1–13. [CrossRef] [PubMed]
56. Van Hooren, B.; Fuller, J.T.; Buckley, J.D.; Miller, J.R.; Sewell, K.; Rao, G.; Barton, C.; Bishop, C.; Willy, R.W. Is Motorized Treadmill
Running Biomechanically Comparable to Overground Running? A Systematic Review and Meta-Analysis of Cross-Over Studies.
Sports Med. 2020, 50, 785–813. [CrossRef]
57. Mooses, M.; Tippi, B.; Mooses, K.; Durussel, J.; Mäestu, J. Better economy in field running than on the treadmill: Evidence from
high-level distance runners. Biol. Sport 2015, 32, 155–159. [CrossRef]You can also read