Dividend Strategy Guide 9.30.2021 - Berkshire Asset Management, LLC I 46 Public Square I Wilkes-Barre, PA 18701 I - Berkshire Asset ...
←
→
Page content transcription
If your browser does not render page correctly, please read the page content below

Dividend Strategy Guide 9.30.2021
Berkshire Asset Management, LLC I 46 Public Square I Wilkes-Barre, PA 18701 I 570.825.2600
Berkshire Dividend Growth Strategy
Berkshire Firm Update
Our current business fundamentals are the strongest in our history
Ownership: 100% employee owned with more than a 30 year operating history*
Extremely low professional turnover
Controlled, measured growth
Low overhead cost structure enhancing the long-term stability of the firm
Our investment principles remain consistent and focused
Deliver quality investment results
Narrow focus on large cap dividend investing
‐ Enduring dividend growth to meet client goals and objectives
‐ “Forward looking” fundamental process vs. backward looking screening
Our service model provides distinguished support
Maintain premier boutique status to quality advisors and platforms
Direct communication with portfolio managers to enhance advisor support
Customized portfolio management
*Berkshire Asset Management, LLC (Berkshire) is a fee-based, SEC registered advisory firm serving the portfolio management needs of high net worth and institutional clients.
Berkshire Asset Management, Inc. was formed in 1986 as a SEC registered investment adviser. In 1999 the company was sold to Legg Mason. In 2007, senior leadership repurchased 2
the firm, forming Berkshire Asset Management, LLC, the company built to serve you today.
Berkshire Dividend Growth Strategy Philosophy & Objectives We believe a diversified portfolio of high quality businesses consistently increasing dividends can lead to attractive long term investment results: Dividend growth provides transparent insight into a company’s fundamentals and vitality Dividends have contributed a significant amount to total market return over time Downside protection in volatile markets On-going opportunity set created by the COVID-19 Pandemic (Source: Zacks) Portfolio Goals: Achieve a blend of high current income and growth in cash flow over time Achieve capital appreciation in underlying holdings through superior stock selection Dampen volatility in uncertain market environments Avoid stocks with high correlation to fixed income Through quality and transparency, help clients to understand/appreciate what they own Investments are not FDIC-insured, nor are they deposits of or guaranteed by a bank or any other entity, so they may lose value. Investors should carefully consider investment objectives, risks, charges and expenses. Additional information can be obtained from a financial professional and should be read carefully before investing. Dividends and yields 3 represent past performance, there is no assurance they will continue to be paid in the future. Platform restrictions may apply.
Berkshire Dividend Growth Strategy
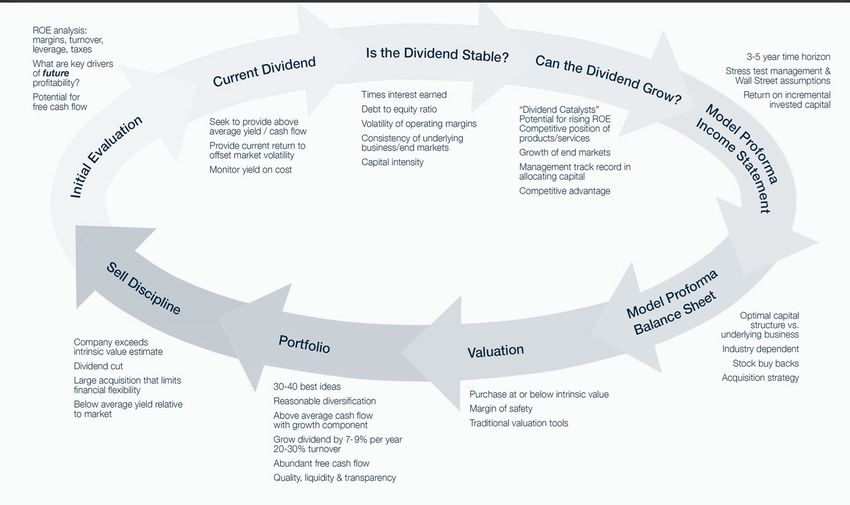
“Forward Looking” Process
Simple screens of historical data may fail to capture the full dividend growth opportunity set…
Berkshire’s Process: Identify perennial dividend growers before they are fully recognized by the market using a
“Forward Looking” bottom up selection process:
Understand how a business generates free cash flow by decomposing ROE components
Model future income statement, balance sheet and free cash flow
Measure dividend growth potential by analyzing optimal capital structure & future payout ratio
Own tomorrow’s dividend growers trading at discounts to intrinsic value estimates
Some of our highest conviction dividend growth stories would have flunked traditional backward looking
screens at time of Berkshire’s purchase*:
Emerging tech and health care businesses
High quality financials
Our edge? Patience, discipline and the ability to capitalize on the short sightedness of others.
Investors should carefully consider investment objectives, risks, charges and expenses. Additional information can be obtained from a financial professional and should be read
carefully before investing. Dividends and yields represent past performance and there is no assurance they will continue to be paid in the future. Platform restrictions may apply.
“Forward Looking” does not imply a level of skill, however the term is used to reference the way we approach our analysis of individual companies. *We highlight these companies
solely for illustrative purposes and not on the basis of investment performance or attribution to the overall performance of the strategy. The companies identified herein do not
represent all of the securities purchased, sold or recommended for client accounts, and you should not assume that an investment in the companies identified was or will be 4
profitable. Berkshire retains the right revise or modify portfolios and strategies if it believes such modifications would be in the best interests of its clients. Model portfolios may or may
not contain any specific security at any time, and decisions to invest should not be made based on the presumed or current composition of any model portfolio.Equity Selection Process SCREENING: High and sustainable return on equity (ROE) CAREFUL OBSERVATION: Price events, earnings misses, reservoir of company knowledge, areas of expertise by Portfolio Manger, contrarian, attempt to capitalize on short-sightedness of others.
Berkshire Dividend Growth Strategy
    Rolling Period Dividend Growth as of 9.30.2021

                                                    1 Year
                                                                                                                Source: Zacks
                                     Portfolio   Dividend     3 Year Average  5 Year Average         Current    Positions are in order of portfolio weighting in
Company Name                Symbol    Weight       Growth    Dividend Growth Dividend Growth   Dividend Yield   the “Berkshire Dividend Growth and Income
                                                                                                                Model Portfolio” as of publish date. Weightings
Bank Of America           BAC         6.16%        4.17%             13.72%          27.23%           1.98%     may vary. Dividend increase results are based
JPMorgan Chase            JPM         5.33%        0.00%             17.13%          14.87%           2.44%     on underlying holdings of a representative
PNC Financial             PNC         4.63%        2.17%             13.67%          17.71%           2.56%     account in our Dividend Growth Strategy
Microsoft                 MSFT        4.31%        9.80%             10.06%           9.24%           0.88%     Composite. Growth rate over one year in the
Norfolk Southern          NSC         3.68%        6.65%             12.06%          11.19%           1.82%     gross dividend per share. Calculated as:
Chevron                   CVX         3.56%        3.95%              5.81%           4.21%           5.28%     (Current year's dividend per share / Prior
Cisco Systems             CSCO        3.54%        2.82%              5.60%           9.21%           2.72%     year's), minus 1, times 100. Dividends per
                                                                                                                share includes Interim and Final payments, as
Intel                     INTC        3.28%        5.17%              5.39%           6.12%           2.61%
                                                                                                                well as all Abnormal Dividends. Dividend
Apple                     AAPL        3.22%        6.92%              7.72%           9.30%           0.62%     amounts are adjusted for stock splits and other
Qualcomm                  QCOM        3.19%        4.72%              3.78%           5.66%           2.11%     corporate actions. Growth rate over three years
Nucor                     NUE         3.14%        0.62%              2.15%           1.55%           1.64%     in net dividend per share. Calculated as:
Abbvie                    ABBV        2.87%       10.20%             15.82%          18.01%           4.82%     (Current year's dividend per share /Dividend
Lockheed Martin           LMT         2.86%        8.33%              9.14%           9.52%           3.25%     per share three years prior), raised to the
McDonald's                MCD         2.77%        3.20%              8.50%           7.71%           2.29%     power of one-third, minus 1, times 100.
Waste Management          WM          2.74%        5.70%              7.64%           7.05%           1.54%     Dividends per share includes Interim and Final
                                                                                                                payments, as well as all Abnormal Dividends.
Bristol-Myers             BMY         2.68%       11.36%              7.22%           5.36%           3.31%     Dividend amounts are adjusted for stock splits
Emerson Electric          EMR         2.60%        1.00%              1.36%           1.23%           2.14%     and other corporate actions. Growth rate over
Walmart                   WMT         2.56%        1.86%              1.90%           1.93%           1.58%     five years in net dividend per share. Calculated
Honeywell International   HON         2.51%        3.33%              7.67%           9.34%           1.75%     as: (Current year's dividend per share /
Abbott Laboratories       ABT         2.45%       22.14%             15.67%          10.89%           1.52%     Dividend per share five years prior), raised to
Johnson & Johnson         JNJ         2.39%        5.61%              5.96%           5.96%           2.63%     the power of 0.2, minus 1, times 100.
PepsiCo                   PEP         2.08%        6.07%              6.58%           7.59%           2.86%     Dividends per share includes Interim and Final
Merck                     MRK         2.00%        6.56%             10.63%           7.16%           3.46%     payments, as well as all Abnormal Dividends.
                                                                                                                Dividend amounts are adjusted for stock splits
W.P. Carey                WPC         1.99%        0.77%              1.02%           1.45%           5.76%     and other corporate actions. There is no
Procter & Gamble          PG          1.99%        8.06%              5.68%           4.50%           2.49%     guarantee dividends will continue to be paid in
Pfizer                    PFE         1.96%        3.33%              4.97%           5.61%           3.63%     the future. All information provided is
PPL                       PPL         1.94%        0.15%              0.71%           1.81%           5.95%     supplemental to its attached GIPS compliant
Kinder Morgan             KMI         1.94%        3.90%             17.89%           3.77%           6.46%     presentation. The information contained herein,
Chubb                     CB          1.85%        3.27%              3.14%           3.04%           1.84%     is for Investment Personnel use only.
Leggett & Platt           LEG         1.82%        2.50%              3.48%           4.44%           3.75%
M & T Bank                MTB         1.77%        0.00%             10.06%           9.46%           2.95%
Amgen                     AMGN        1.64%       10.08%             10.42%          12.67%           3.31%
Kimberly-Clark            KMB         1.57%        5.90%              4.19%           4.29%           3.44%
AT&T                      T           1.48%        0.48%              1.49%           1.72%           7.70%
General Mills             GIS         1.42%        4.08%              1.34%           2.31%           3.41%
Viatris                   VTRS        1.02%      100.00%              0.00%           0.00%           3.25%
                                                                                                                                                          6
Weighted Average                                   5.77%             7.96%           8.64%            2.71%
Berkshire Dividend Growth Strategy
Portfolio Value and Income w/ Dividends Reinvested
Inception (6.30.2009) through 9.30.2021 -- Net of 1% Annual Fee
$200,000.00
$5,000,000.00 $180,000.00
$4,425,645.36
$160,000.00
$4,000,000.00 $2,475,884.73
$140,000.00
$120,000.00
$3,000,000.00
$100,000.00
$1,000,000.00
$80,000.00
$2,000,000.00 $119,527.14
$60,000.00
$78,980.81 $40,000.00
$1,000,000.00
$36,991.81 $20,000.00
$- $-
Berk Div Portfolio Value w/ Dividend Income Reinvested Berkshire Annualized Dividend Income w/ Dividends Reinvested
Intended for illustrative purposes only. Income chart is based on the assumption $1,000,000 is invested in the Berkshire Dividend Growth and Income Strategy at the inception of the Berkshire
Dividend Growth and Income composite. (6/30/2009) The $1,000,000 investment is adjusted monthly based on the stated monthly total returns for the given composite. This includes accumulation
and reinvestment of the dividend. The monthly adjusted account values are then multiplied by the current yield of the respective composite. The resulting monthly income figures are then charted in
the graph. Dividends are not guaranteed, and may be subject to change. Investing based on dividends alone may not be favorable as it does not include all material risks. There is no guarantee any
stated (or implied) portfolio or performance objective mentioned by Berkshire can be met. A fee of 1% annually is included in analysis. Berkshire Dividend Growth and Income current yields are
calculated in Zacks from a representative account only. Individual account yields and returns can vary. Calculation limitations: Changes of the underlying holdings in the index or composite can
change current yield calculations. This can lead to various ranges of results that may appear more or less favorable. Example: Stock A with 3% current dividend yield is sold. Stock B with 4%
current dividend yield is purchased. This would result in higher yielding portfolio but is not the result of “dividend growth”.Berkshire Dividend Growth Strategy
Portfolio Value and Income w/ Dividends Distributed
Inception (6.30.2009) through 9.30.2021 -- Net of 1% Annual Fee
$3,500,000.00
Total Distribution of all Dividends Since
$3,021,923.26 $140,000.00
Inception: $739,630
$3,000,000.00
$120,000.00
$2,010,564.53
$2,500,000.00
$100,000.00
$1,000,000.00
$2,000,000.00
$80,000.00
$1,500,000.00
$60,000.00
$81,615.63
$1,000,000.00 $64,137.08 $40,000.00
$36,991.81
$500,000.00 $20,000.00
$- $-
Berkshire Div Portfolio Value w/ Distribution of Dividend Income Annualized Dividend Income
Intended for illustrative purposes only. Income chart is based on the assumption $1,000,000 is invested in the Berkshire Dividend Growth and Income Strategy at the inception of the Berkshire
Dividend Growth and Income composite. (6/30/2009) The $1,000,000 investment is adjusted monthly based on the stated monthly total returns for the given composite. This includes distribution of
the dividend monthly based upon portfolio current yield at the end of each month. The monthly adjusted account values are then multiplied by the current yield of the respective composite. The
resulting monthly income figures are then charted in the graph. Dividends are not guaranteed, and may be subject to change. Investing based on dividends alone may not be favorable as it does
not include all material risks. There is no guarantee any stated (or implied) portfolio or performance objective mentioned by Berkshire can be met. A fee of 1% annually is included in analysis.
Berkshire Dividend Growth and Income current yields are calculated in Zacks from a representative account only. Individual account yields and returns can vary. Calculation limitations: Changes of
the underlying holdings in the index or composite can change current yield calculations. This can lead to various ranges of results that may appear more or less favorable. Example: Stock A with
3% current dividend yield is sold. Stock B with 4% current dividend yield is purchased. This would result in higher yielding portfolio but is not the result of “dividend growth”.Berkshire Dividend Growth Strategy
Performance Update 9.30.2021
Growth of $1,000,000 Investment
$7,000,000.00
$6,000,000.00
$5,000,000.00
$4,000,000.00
$3,000,000.00
$2,000,000.00
$1,000,000.00
Berkshire Dividend Strategy S&P 500 Russell 1000 Value
Investments are not FDIC-insured, nor are they deposits of or guaranteed by a bank or any other entity, so they may lose value. Investors should carefully consider investment
objectives, risks, charges and expenses. Additional information can be obtained from a financial professional and should be read carefully before investing. Dividends and yields 9
represent past performance, there is no assurance they will continue to be paid in the future. Platform restrictions may apply.Berkshire Dividend Growth Strategy
Performance vs. Russell 1000 Value – 9.30.2021
Berkshire Divid end Russell 1000 V alue Berkshire - Russell Berkshire Divid end
S trateg y (Gross)* Return 1000 V alue Difference S trateg y (Net)*
2009* 23.24% 21.86% 1.39% 22.74%
2010 11.62% 14.36% -2.74% 10.62%
2011 10.04% 0.39% 9.66% 9.04%
2012 14.18% 17.50% -3.32% 13.18%
2013 31.26% 32.54% -1.29% 30.26%
2014 13.88% 13.46% 0.42% 12.88%
2015 2.27% -3.84% 6.11% 1.27%
2016 15.29% 17.31% -2.01% 14.29%
2017 16.95% 16.58% 0.37% 15.95%
2018 -5.15% -8.28% 3.12% -6.15%
2019 26.78% 26.52% 0.26% 25.78%
2020 4.01% 2.78% 1.23% 3.01%
2021 Y TD 12.27% 16.12% -3.85% 11.52%
Cumulative Return 400.26% 350.25% 50.02% 348.39%
Annualized 14.04% 13.07% 0.98% 13.62%
1 Y ear 25.75% 34.98% -9.24% 24.75%
3 Y ears 10.30% 10.04% 0.26% 9.30%
5 Y ears 11.31% 11.49% -0.18% 10.31%
7 Y ears 10.77% 9.70% 1.07% 9.77%
10 Y ears 13.92% 13.79% 0.13% 12.92%
*Performance measured from inception (6.30.2009). Investments are not FDIC-insured, nor are they deposits of or guaranteed by a bank or any other entity, so they may lose value.
Investors should carefully consider investment objectives, risks, charges and expenses. Additional information can be obtained from a financial professional and should be read 10
carefully before investing. Dividends and yields represent past performance, there is no assurance they will continue to be paid in the future. Platform restrictions may apply.Berkshire Dividend Growth Strategy
Performance vs. S&P 500 – 9.30.2021
Berkshire Divid end Berkshire - S &P 500 Berkshire Divid end
S &P 500 Return
S trateg y (Gross)* Difference S trateg y (Net)*
2009* 23.24% 22.50% 0.74% 22.74%
2010 11.62% 15.06% -3.45% 10.62%
2011 10.04% 2.11% 7.93% 9.04%
2012 14.18% 16.00% -1.82% 13.18%
2013 31.26% 32.39% -1.13% 30.26%
2014 13.88% 13.69% 0.19% 12.88%
2015 2.27% 1.38% 0.89% 1.27%
2016 15.29% 11.96% 3.33% 14.29%
2017 16.95% 21.83% -4.88% 15.95%
2018 -5.15% -4.39% -0.77% -6.15%
2019 26.78% 31.48% -4.69% 25.78%
2020 4.01% 18.39% -14.38% 3.01%
2021 Y TD 12.27% 15.91% -3.64% 11.52%
Cumulative Return 400.26% 499.46% -99.19% 348.39%
Annualized 14.04% 15.74% -1.70% 13.62%
1 Y ear 25.75% 29.99% -4.24% 24.75%
3 Y ears 10.30% 15.97% -5.67% 9.30%
5 Y ears 11.31% 16.89% -5.58% 10.31%
7 Y ears 10.77% 14.01% -3.23% 9.77%
10 Y ears 13.92% 16.63% -2.71% 12.92%
*Performance measured from inception (6.30.2009). Investments are not FDIC-insured, nor are they deposits of or guaranteed by a bank or any other entity, so they may lose value.
Investors should carefully consider investment objectives, risks, charges and expenses. Additional information can be obtained from a financial professional and should be read 11
carefully before investing. Dividends and yields represent past performance, there is no assurance they will continue to be paid in the future. Platform restrictions may apply.Berkshire Dividend Growth Strategy Trading & Research Personnel Rachel Ames, CFA Vice President, Trading and Portfolio Analyst Education BS, Finance George Washington University CFA Charterholder Experience Rachel has over 15 years of experience in portfolio management. Prior to joining Berkshire in September of 2019, she worked at various asset management companies in the Washington DC area. Most recently she served as Vice President of Portfolio Management with CBOE Vest. She also spent 14 years at ProShare Advisors, LLC in the role of Portfolio Manager. Rachel holds the Chartered Financial Analyst (CFA) designation and a bachelor’s degree in Finance from George Washington University. Investments are not FDIC-insured, nor are they deposits of or guaranteed by a bank or any other entity, so they may lose value. Investors should carefully consider investment objectives, risks, charges and expenses. Additional information can be obtained from a financial professional and should be read carefully before investing. Dividends and yields 12 represent past performance, there is no assurance they will continue to be paid in the future. Platform restrictions may apply.
Berkshire Dividend Growth Strategy Investment Management & Research Personnel Kenneth J. Krogulski, CFA Managing Partner and Chief Investment Officer Education BS, Indiana University of Pennsylvania MBA, Wilkes University CFA Charterholder since 1986 Experience Ken has 42 years of experience in security analysis and portfolio management. He joined Berkshire in 1990 after serving for 11 years as senior portfolio manager for the First Eastern Bank’s trust company. He is director of Allied Services and Cumberland Pharmaceuticals, Inc. (CPIX: NASDAQ). Investments are not FDIC-insured, nor are they deposits of or guaranteed by a bank or any other entity, so they may lose value. Investors should carefully consider investment objectives, risks, charges and expenses. Additional information can be obtained from a financial professional and should be read carefully before investing. Dividends and yields 13 represent past performance, there is no assurance they will continue to be paid in the future. Platform restrictions may apply.
Berkshire Dividend Growth Strategy Investment Management & Research Personnel Gerard Mihalick, CFA Partner and Portfolio Manager Education BA, Gettysburg College CFA Charterholder Member, New York Society of Security Analysts Experience Gerry has over 25 years of experience in the investment management industry and joined Berkshire in 1995. At Berkshire, Gerry is a member of the firm’s investment committee and has equity research and portfolio management responsibilities. Prior to joining Berkshire, he was employed as a portfolio manager with Fleet Investment Advisors in Rochester, New York. Gerry has served on the board of directors for various local non- profit organizations. Investments are not FDIC-insured, nor are they deposits of or guaranteed by a bank or any other entity, so they may lose value. Investors should carefully consider investment objectives, risks, charges and expenses. Additional information can be obtained from a financial professional and should be read carefully before investing. Dividends and yields 14 represent past performance, there is no assurance they will continue to be paid in the future. Platform restrictions may apply.
Berkshire Dividend Growth Strategy Institutional and Advisory Distribution Jason J Reilly, CFP® Vice President, Distribution Education BS, Finance Kings College CERTIFIED FINANCIAL PLANNER™ Professional Experience Jason has held various roles within the wealth and investment management business since 2006. Prior to joining Berkshire in 2015, he spent eight years with PNC Bank in both the Philadelphia and Northeast PA markets, where he served their high-net worth client base. At Berkshire, Jason helps build and maintain our institutional relationships and intermediary distribution channels. He also serves a select group of high-net worth families. Jason has served on the board of directors for various local non-profit organizations. Investments are not FDIC-insured, nor are they deposits of or guaranteed by a bank or any other entity, so they may lose value. Investors should carefully consider investment objectives, risks, charges and expenses. Additional information can be obtained from a financial professional and should be read carefully before investing. Dividends and yields 15 represent past performance, there is no assurance they will continue to be paid in the future. Platform restrictions may apply.
Berkshire Dividend Growth Strategy Investment Management & Research Personnel Gregory C. Weaver, CFA Partner and Portfolio Manager Education BS, Business Administration, University of Central Florida CFA Charterholder Experience Greg is a member of the firm’s investment committee and has equity and fixed income research and portfolio management responsibilities. Prior to joining Berkshire in 2007, Greg was a financial analyst for both MGM Studios and Paramount Pictures. He was also previously an Investment Representative for Trust Company of the West and served as Wealth Manager for the M&T Bank Investment Group. He is a member of the CFA Society of Philadelphia and serves on the board of The Luzerne Foundation, the Home For Homeless Women, CASA of Luzerne County, and the Wyoming Commemorative Association. Investments are not FDIC-insured, nor are they deposits of or guaranteed by a bank or any other entity, so they may lose value. Investors should carefully consider investment objectives, risks, charges and expenses. Additional information can be obtained from a financial professional and should be read carefully before investing. Dividends and yields 16 represent past performance, there is no assurance they will continue to be paid in the future. Platform restrictions may apply.
Berkshire Dividend Growth Strategy Investment Management & Research Personnel Michael D. Weaver, CFA Partner and Portfolio Manager Education BA, Economics, University of Virginia CFA Charterholder Experience Mike has over 20 years experience in security analysis and portfolio management. At Berkshire, Mike is a member of the firm’s investment committee and has equity research and portfolio management responsibilities. Prior to joining Berkshire in 1999, Mike was a senior portfolio manager for Mellon Private Asset Management. He is a former director of the North Branch Land Trust and the Luzerne Foundation. Investments are not FDIC-insured, nor are they deposits of or guaranteed by a bank or any other entity, so they may lose value. Investors should carefully consider investment objectives, risks, charges and expenses. Additional information can be obtained from a financial professional and should be read carefully before investing. Dividends and yields 17 represent past performance, there is no assurance they will continue to be paid in the future. Platform restrictions may apply.
Berkshire Dividend Growth Strategy
Disclosure Information

Berkshire Asset Management, LLC claims compliance with the Global Investment Performance Standards (GIPS®). Berkshire Asset Management is a fee-based, SEC
registered advisory firm serving the portfolio management needs of institutional and high-net worth clients. Registration with the SEC or any state securities authority
does not imply a certain level of skill or training. The Dividend Growth Composite contains portfolios invested in Berkshire’s Dividend Growth Strategy with an equity
allocation target of 90% - 100%. The Dividend Growth Strategy’s primary objective is to generate a growing stream of equity income by investing in a diversified
portfolio of equities with stable, high, and growing dividends. The benchmark is the S&P 500 Index. The index returns are provided to represent the investment
environment existing during the time periods shown. For comparison purposes, the index is fully invested, does not include any trading costs, management fees, or
other costs, and the reinvestment of dividends and other distributions is assumed. An investor cannot invest directly in an index. Gross returns are presented before
management and other fees but after all trading expenses. Net returns are calculated by deducting actual management fees from gross returns. Returns reflect the
reinvestment of dividends and other earnings. Valuations are computed and performance is reported in U.S. dollars. To receive a complete list of composite
descriptions and/or a compliant presentation, contact Jason Reilly, CFP® Tel: 570-825-2600 or info@berkshiream.com. Past performance does not guarantee future
results. Platform restrictions may apply. Individual accounts vary.
Definitions: The S & P 500 Index is a market capitalization weighted index of the largest 500 U.S. stocks. It is a market-value weighted index (stock price times # of
shares outstanding), with each stock’s weight in the index proportionate to its market value. The index is designed to measure changes in the economy and is
representative of most major industries. Russell 1000 Value Index (RLV) measures the performance of those Russell 1000 companies with lower price-to-book ratios
and lower forecasted growth values. The index was developed as of August 31, 1992. You cannot invest directly in an index. Beta is a measure of volatility vs. an
index. Current yield is the mean estimated annual dividend amount based on current calendar year, divided by the current stock price. Dividend Payout ratio is the
fraction of net income a firm pays to its shareholders in dividends, in percentage. Forward Price Earnings Ratio (P/E) is the ratio of the price of a stock and the
company's projected earnings per share. Upside/Downside capture ratios refer to a portfolios performance as a percentage of either positive returns (upside) or
negative returns (downside) vs. an index. Standard Deviation is a measure of total risk. Return on equity (ROE) measures profitability by dividing dollars of profit by
shareholders' equity. If represented in this presentation - Alpha, Beta and capture ratios are generally presented as calculated by Morningstar.
Risks: Past performance does not guarantee future results. Different types of investments involve varying degrees of risk, and there can be no assurance that any
specific investment will either be suitable or profitable for an individual’s investment portfolio. Dividends are subject to change, are not guaranteed, and may be cut.
Investing based on dividends alone may not be favorable as it does not include all material risks. There is no guarantee any stated (or implied) portfolio or performance
objective mentioned by Berkshire can be met. Berkshire’s equity style may focus its investments in certain sectors or industries, thereby increasing potential volatility
relative to other strategies or indices. The dividend strategy may include bundled services also known as a “wrap fee program”. Because there is typically a low
turnover in the strategy, this may be more costly for some investors. No one should assume that any information presented serves as the receipt of, or a substitute for,
personalized individual advice from a qualified advisor or any other investment professional.
Market Commentary, Aggregate Holdings, Securities, Sectors, Portfolio Characteristics Mentioned: No statement made in this presentation shall construe investment
advice. This presentation is for informational purposes only. Views, comments or research mentioned is not intended to be a forecast of future events. The mention of
any security or sector is not deemed as a recommendation to buy or sell. Any reference to any security or sector is used to explain the portfolio manager’s rationale for
portfolio decisions or philosophy. Research or financial statistics cited regarding securities or sectors do not contain all material information about them. Any securities
mentioned represent a partial list of holdings whereas Berkshire portfolios typically contain approximately 30-40 securities in percentage weightings ranging from 1-5%.
A complete list of holdings from a representative account is available upon request. Overall portfolio characteristics mentioned are from a representative account
deemed representative of the strategy; data may be compiled from Zacks, Baseline or Berkshire estimates. Individual holdings, performance and aggregate
characteristics of actual portfolios may vary based on a variety of factors including market conditions, timing of client cash flows and manager discretion. This
presentation contains Berkshire opinions and use of Berkshire estimates which are subject to change at any time. Berkshire employees may have personal positions in
any securities or sectors mentioned. Charts, presentations or articles may be obtained from third parties and Berkshire does not guarantee their accuracy.
                                                                                                                                                                         18
Berkshire Dividend Growth Strategy
Disclosure Information
19Berkshire Dividend Growth Strategy
Disclosure Information
Berkshire Asset Management, LLC claims compliance with the Global Investment Performance Standards (GIPS®) and has prepared and presented this report in
compliance with the GIPS standards. Berkshire Asset Management, LLC has been independently verified for the periods January 1, 2009 through December 31, 2019.
The verification report is available upon request. A firm that claims compliance with the GIPS standards must establish policies and procedures for complying with all
the applicable requirements of the GIPS standards. Verification provides assurance on whether the firm’s policies and procedures related to composite and pooled fund
maintenance, as well as the calculation, presentation, and distribution of performance, have been designed in compliance with the GIPS standards and have been
implemented on a firm-wide basis. Verification does not provide assurance on the accuracy of any specific performance report.
Notes:
1. Berkshire Asset Management is a fee-based, SEC registered advisory firm serving the portfolio management needs of personal high net worth and institutional
clients. Policies for valuing portfolios, calculating performance, and preparing compliant presentations are available upon request. Policies for valuing investments,
calculating performance, and preparing GIPS reports are available upon request.
2. The Dividend Growth Composite contains portfolios invested in Berkshire’s Dividend Growth Strategy with an equity allocation target of 90% - 100%. The Dividend
Growth Strategy’s primary objective is to generate a growing stream of equity income by investing in a diversified portfolio of equities with stable, high, and growing
dividends. The minimum size required to be in this composite is $300,000.
3. The benchmark is the S&P 500 Index. The index returns are provided to represent the investment environment existing during the time periods shown. For
comparison purposes, the index is fully invested, does not include any trading costs, management fees, or other costs, and the reinvestment of dividends and other
distributions is assumed. An investor cannot invest directly in an index.
4. Valuations are computed and performance is reported in U.S. dollars.
5. Gross returns are presented before management and other fees but after all trading expenses. Net returns are calculated by deducting actual management fees
from gross returns. Returns reflect the reinvestment of dividends and other earnings. The standard investment management fee schedule is as follows: 1.00% on
the first $2 million; 0.75% on the next $3 million; 0.65% on the next $5 million; and 0.50% over $10 million.
6. This composite was created in August 2016 and incepts on January 1, 2009. A list of composite descriptions and limited distribution pooled fund descriptions are
available upon request.
7. Internal dispersion is calculated using the equal-weighted standard deviation of annual gross returns of those portfolios that were included in the composite for the
entire year. It is not presented for any period with five or fewer accounts in the composite for the full year.
8. The three-year annualized standard deviation measures the variability of the composite gross returns and the benchmark returns over the preceding 36-month
period.
9. Past performance does not guarantee future results.
10. GIPS® is a registered trademark of CFA Institute. CFA Institute does not endorse or promote this organization, nor does it warrant the accuracy or quality of the
content contained herein
20You can also read